Federal Share of State Revenue Rises as Medicaid Grants Expand
This data was updated in July 2018. Please see "Federal Share of State Revenue Rises for Third Year."
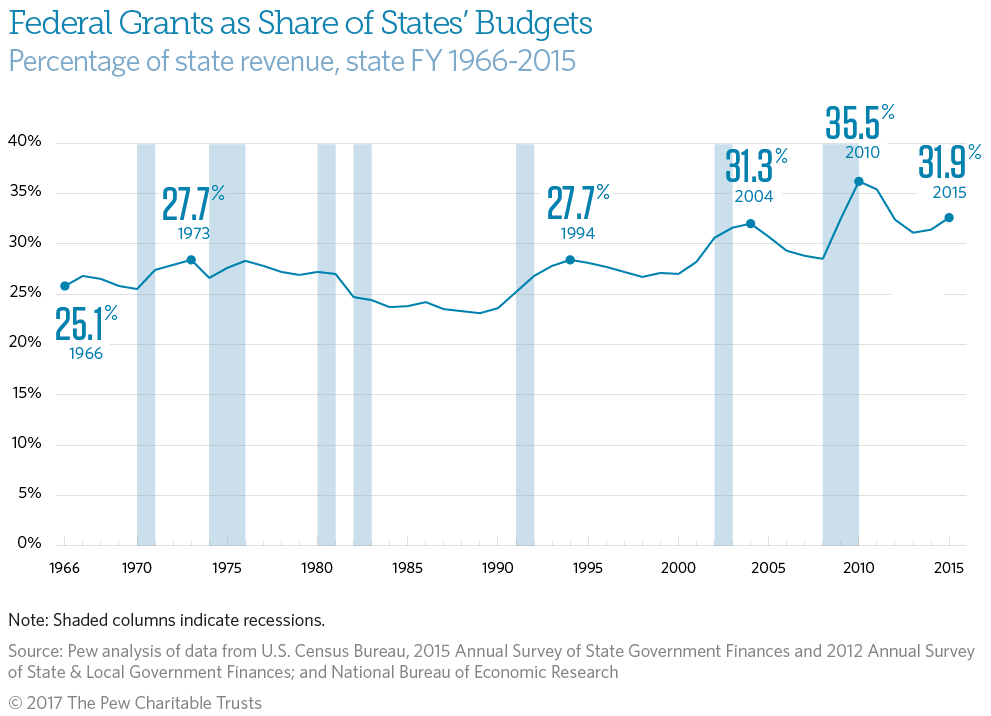
The share of states’ revenue made up by federal dollars rose in fiscal year 2015, capturing the first full year of expanded Medicaid eligibility in some states. The federal government provided 31.9 percent of 50-state revenue in fiscal 2015—the third-largest share on record—up from 30.7 percent in fiscal 2014.
For a second consecutive year, federal dollars as a share of state revenue increased in a majority of states—29 in fiscal 2015. Health care grants have been the main driver of increases in federal funding to states in recent years.
Federal grants to states rose 10.2 percent in fiscal 2015, outpacing overall revenue growth of 6.3 percent. The $55 billion increase in federal funds boosted the share of state revenue coming from the U.S. government to its third-highest level since at least 1961. The federal share of state revenue, however, was still lower than just after the Great Recession, when an influx of economic stimulus dollars and falling state tax revenue increased the federal share to 35.5 percent in fiscal 2010 and 34.7 percent in fiscal 2011. Declines in the federal share after fiscal 2010 reflected the phasing out of stimulus funds and the recovery of states’ tax collections. Changes in either revenue source affect the ratio of federal to total dollars.
Most states with higher federal shares had expanded their Medicaid health insurance programs under the Affordable Care Act (ACA) and received their first full year of grants under the expanded program in fiscal 2015. Fiscal 2014 included the first six months of Medicaid expansion. Total Medicaid spending recorded its fastest growth in more than a decade in fiscal 2015, primarily due to more Americans being eligible for the program, according to the Centers for Medicare & Medicaid Services.Under the Medicaid provisions in the ACA, the federal government reimburses states for all costs to extend health coverage to previously ineligible low-income adults through 2016, gradually dropping to 90 percent by 2020. U.S. lawmakers are debating the future of the Medicaid expansion, casting uncertainty over this revenue stream.
The federal share of state revenuereflects how much funding states receive from the federal government to help pay for specific public services such as health care, education and training, transportation, and other infrastructure. (See “Federal Spending Decisions Affect State Budgets.”) The indicator measures the combined effects of swings in state and federal funds. A higher or lower percentage does not necessarily indicate a problem for state budgets.
Historically, the federal share of 50-state revenue has ranged from about a quarter to a third. The fiscal 2015 share was higher than a 10-year pre-recession average of 28.5 percent.
State Highlights
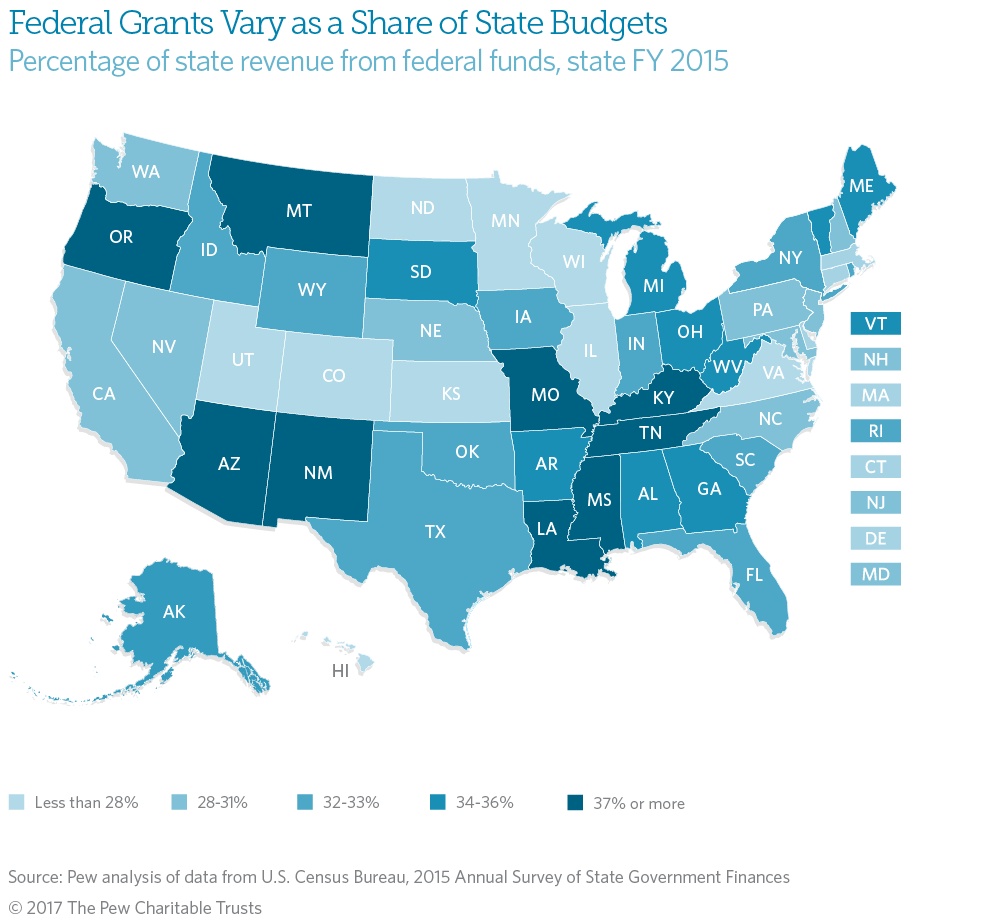
Federal shares vary across the country. Fiscal 2015 data show:
- Of the 29 states that recorded an increase in their federal share of state revenue, 22 were Medicaid expansion states.
- The percentage of state revenue from federal funds was roughly twice as great in Louisiana (42.2 percent) and Mississippi (42.1 percent)—the states where federal shares were highest—as in North Dakota (18.4 percent), Virginia (21.5 percent), and Hawaii (22.8 percent), where the federal shares were lowest.
- In fiscal 2015, Alaska had the largest percentage-point gain in the federal share of state revenue, up 7.4 points from the previous year, as general revenue dropped along with oil prices. The next-biggest increases—all tied to rising federal funds—were in Nevada (5.6 points), New Mexico (4.9 points), and California (4.4 points). The state with the steepest decline was Georgia, at 2.4 percentage points. The next-biggest drops were in Maine (2.3 points), Colorado and South Dakota (2.1 points each), and Hawaii (2.0 points).
- Compared with their 10-year pre-recession averages, six states received a smaller percentage of their revenue from the federal government in fiscal 2015. The biggest difference was in North Dakota, where an oil boom drove general revenue increases, though petroleum prices have cooled in recent years. The federal share of North Dakota’s revenue averaged 34.4 percent before the recession, but was 16 percentage points below that in fiscal 2015. The next-biggest decreases were in Wyoming (5.7 percentage points), Kansas (4.2 points), and South Dakota (3.5 points).
- Of the 44 states where the federal shares exceeded their 10-year pre-recession averages, Nevada had the largest increase—10.6 percentage points. The next-biggest increases were in Alaska (10.2 points), Arizona (10 points), and New Mexico (8.6 points).
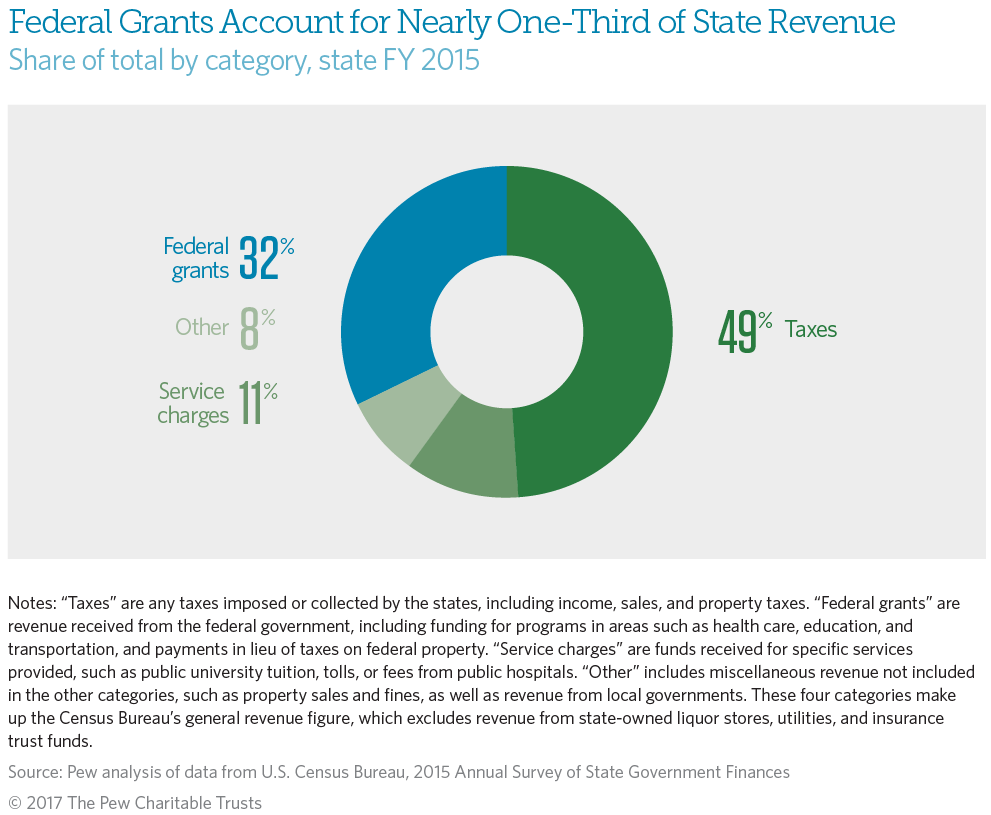
Federal dollars remained the second-largest source of states’ revenue in fiscal 2015, accounting for about $591 billion, or about a third of the $1.9 trillion collected by state governments. Tax collections are states’ leading revenue generator and reached $912 billion in fiscal 2015. In addition to taxes and federal funds, state revenue includes funds such as public university tuition, tolls, and lottery income.
Download the data to see individual state trends. Visit Pew’s interactive resource Fiscal 50: State Trends and Analysis to sort and analyze data for other indicators of state fiscal health.

Fiscal 50: State Trends and Analysis
Sort and chart data about key fiscal and economic trends in the 50 states, and read Pew's insights.


America’s Overdose Crisis
Sign up for our five-email course explaining the overdose crisis in America, the state of treatment access, and ways to improve care
Sign up
ADDITIONAL RESOURCES

Fact Sheet

Podcast