States' Personal Income Shows Uneven Economic Growth
Note: These data have been updated. To see the most recent data and analysis, visit Fiscal 50
One of the longest U.S. economic expansions has lifted personal income in all states. But growth has varied, from a constant annual rate of less than 1 percent in Illinois and Nevada to almost 5 percent in North Dakota since the start of the Great Recession. In six states, personal income fell for the year ending in the third quarter of 2016, hit by factors such as weak energy and agricultural earnings.
Nationwide, growth in personal income has been slower than usual. Since the downturn began in the fourth quarter of 2007, estimated U.S. personal income has increased by the equivalent of 1.7 percent a year through the third quarter of 2016, compared with the equivalent of 2.8 percent a year over the past 30 years, after accounting for inflation.
States have recovered at different paces. Only in mid-2015 did the final state—Nevada—recover its personal-income losses and return to its pre-recession level. Since the end of 2007, personal income in 17 states has grown faster than in the nation as a whole, after adjusting for inflation.
Looking at recent trends, data indicate that inflation-adjusted personal income rose by 2.2 percent in the third quarter of 2016 from a year earlier, with 18 states outpacing U.S. growth. Although six states recorded year-over-year declines, their personal income remained higher than before the recession. These results are based on estimates and subject to revision, as is Pew’s ranking of states’ growth rates.
Personal income estimates are widely used to track state economic trends. As the economy expands or shrinks, state personal income also changes. These trends matter not only for individuals and families but also for state governments, because tax revenue and spending demands may rise or fall along with residents’ incomes. Comprising far more than simply employees’ wages, the measure counts all sorts of income received by state residents, such as earnings from owning a business or investing, as well as benefits provided by employers or the government.
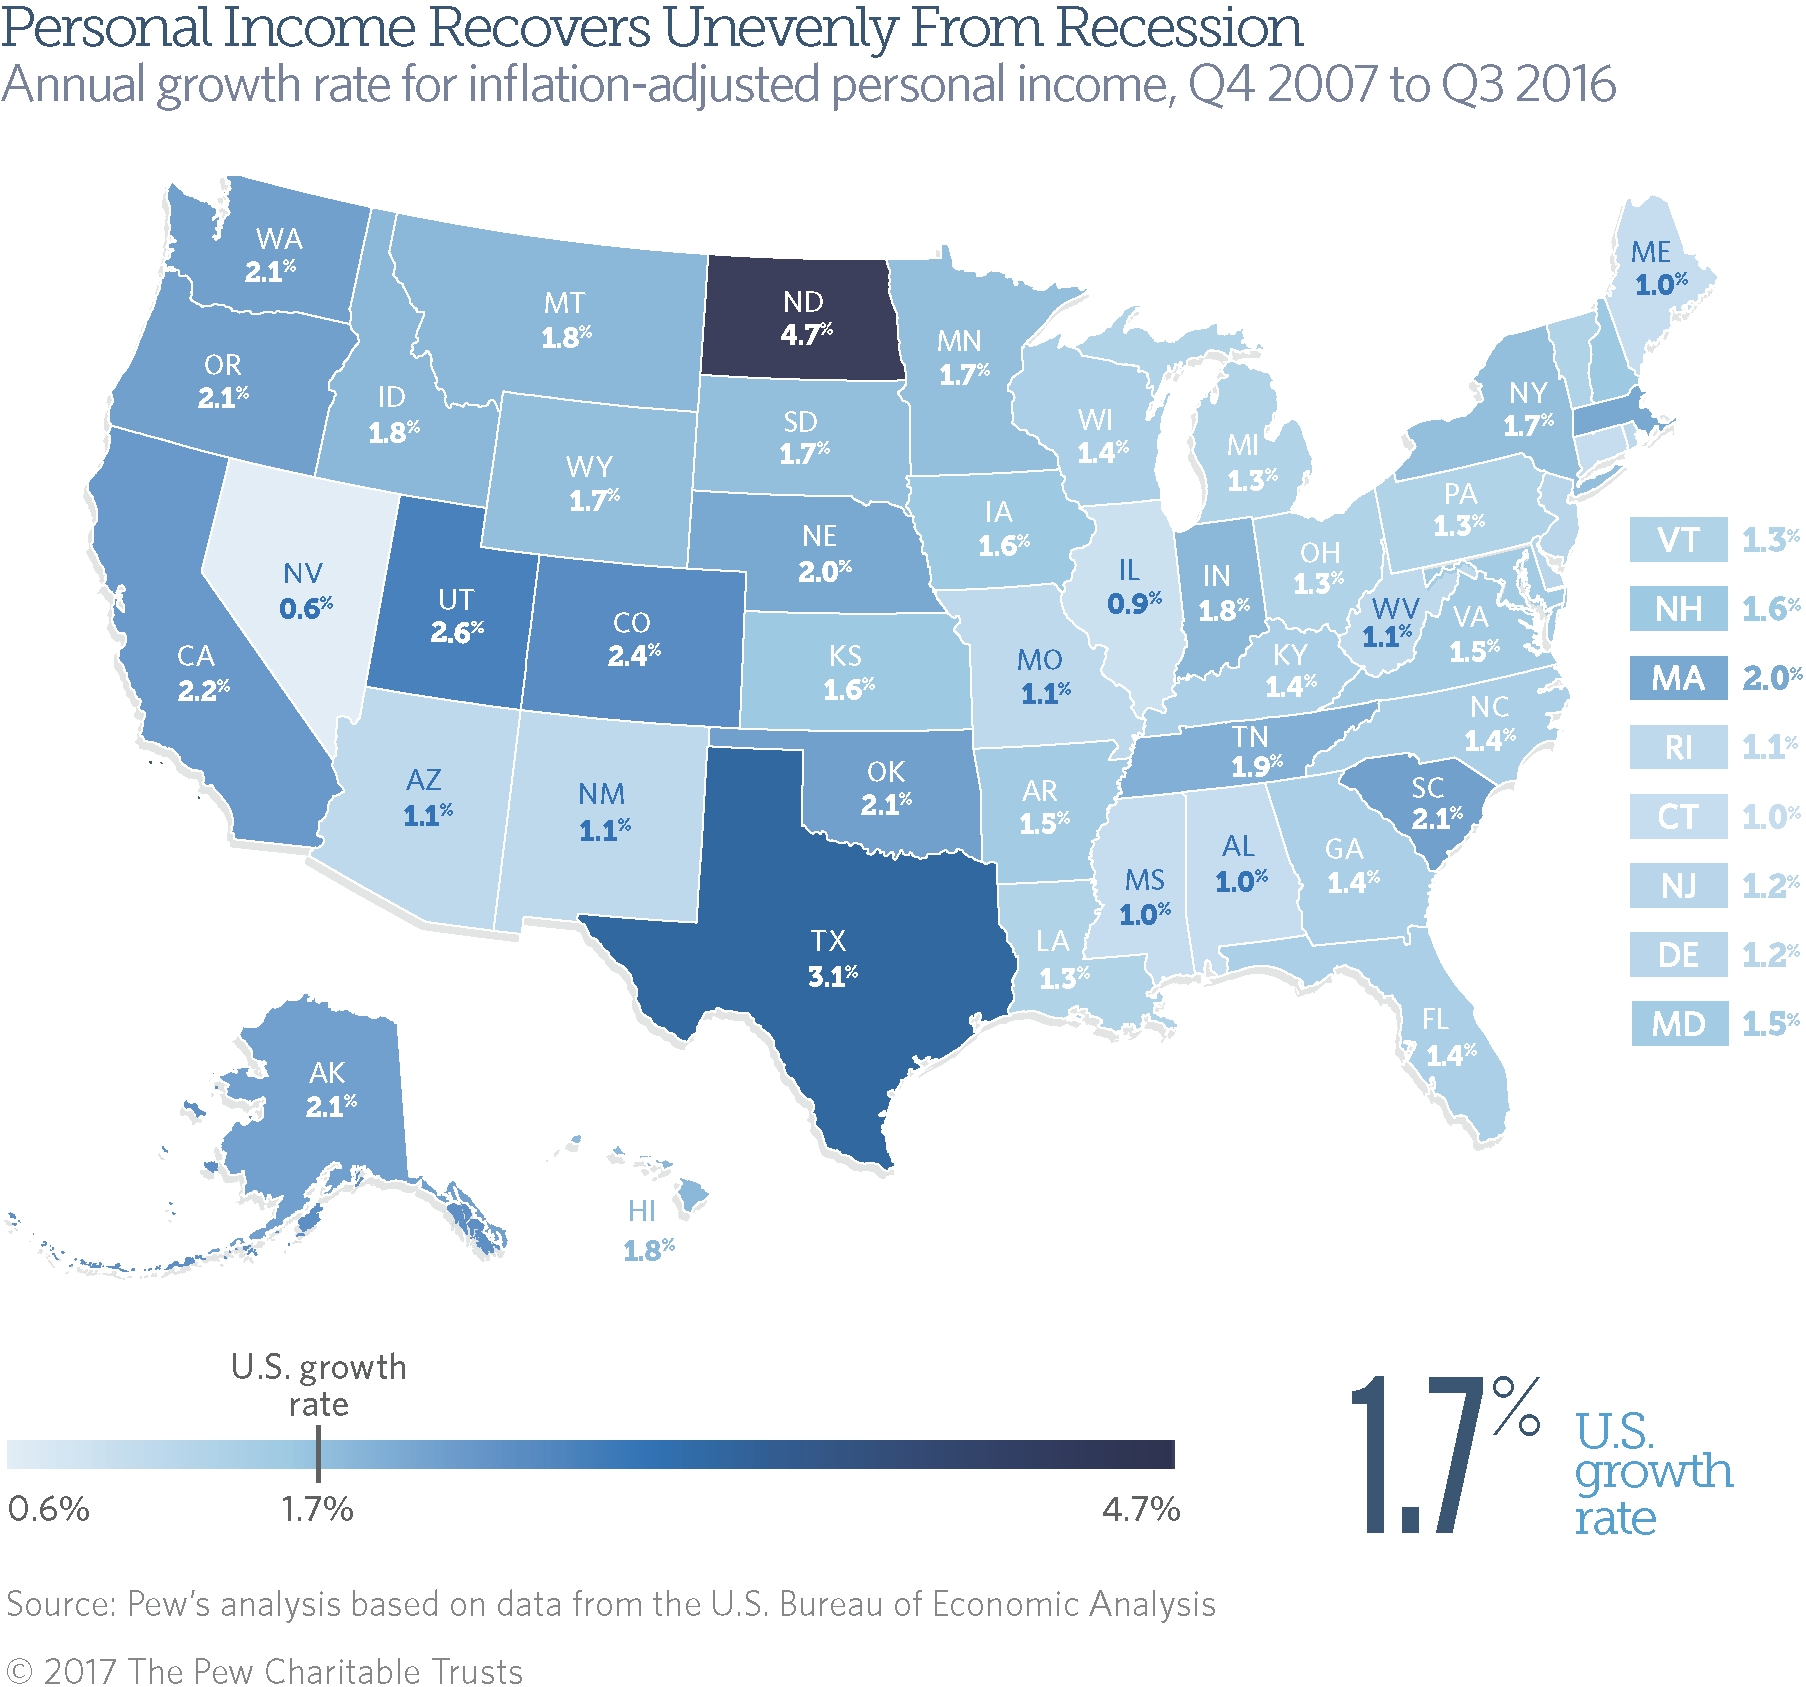
Trends in inflation-adjusted personal income since 2007, the onset of the recession, indicate:
- North Dakota has enjoyed the fastest annualized growth (4.7 percent) since the start of the recession, even though a worldwide drop in petroleum prices has cooled its oil boom and led to the third-sharpest drop (1.8 percent) in personal income among states over the past year.
- The next-fastest growth over the past 8 ¾ years has been in Texas (3.1 percent), Utah (2.6 percent), Colorado (2.4 percent), and California (2.2 percent).
- Nevada, where home prices and construction earnings plunged when the housing bubble burst, has had the slowest growth among all states: an annualized rate of just 0.6 percent since the fourth quarter of 2007.
- The next-slowest growth since the start of the recession has been in Illinois (0.9 percent), followed by Alabama, Connecticut, Maine, and Mississippi (each at 1.0 percent).
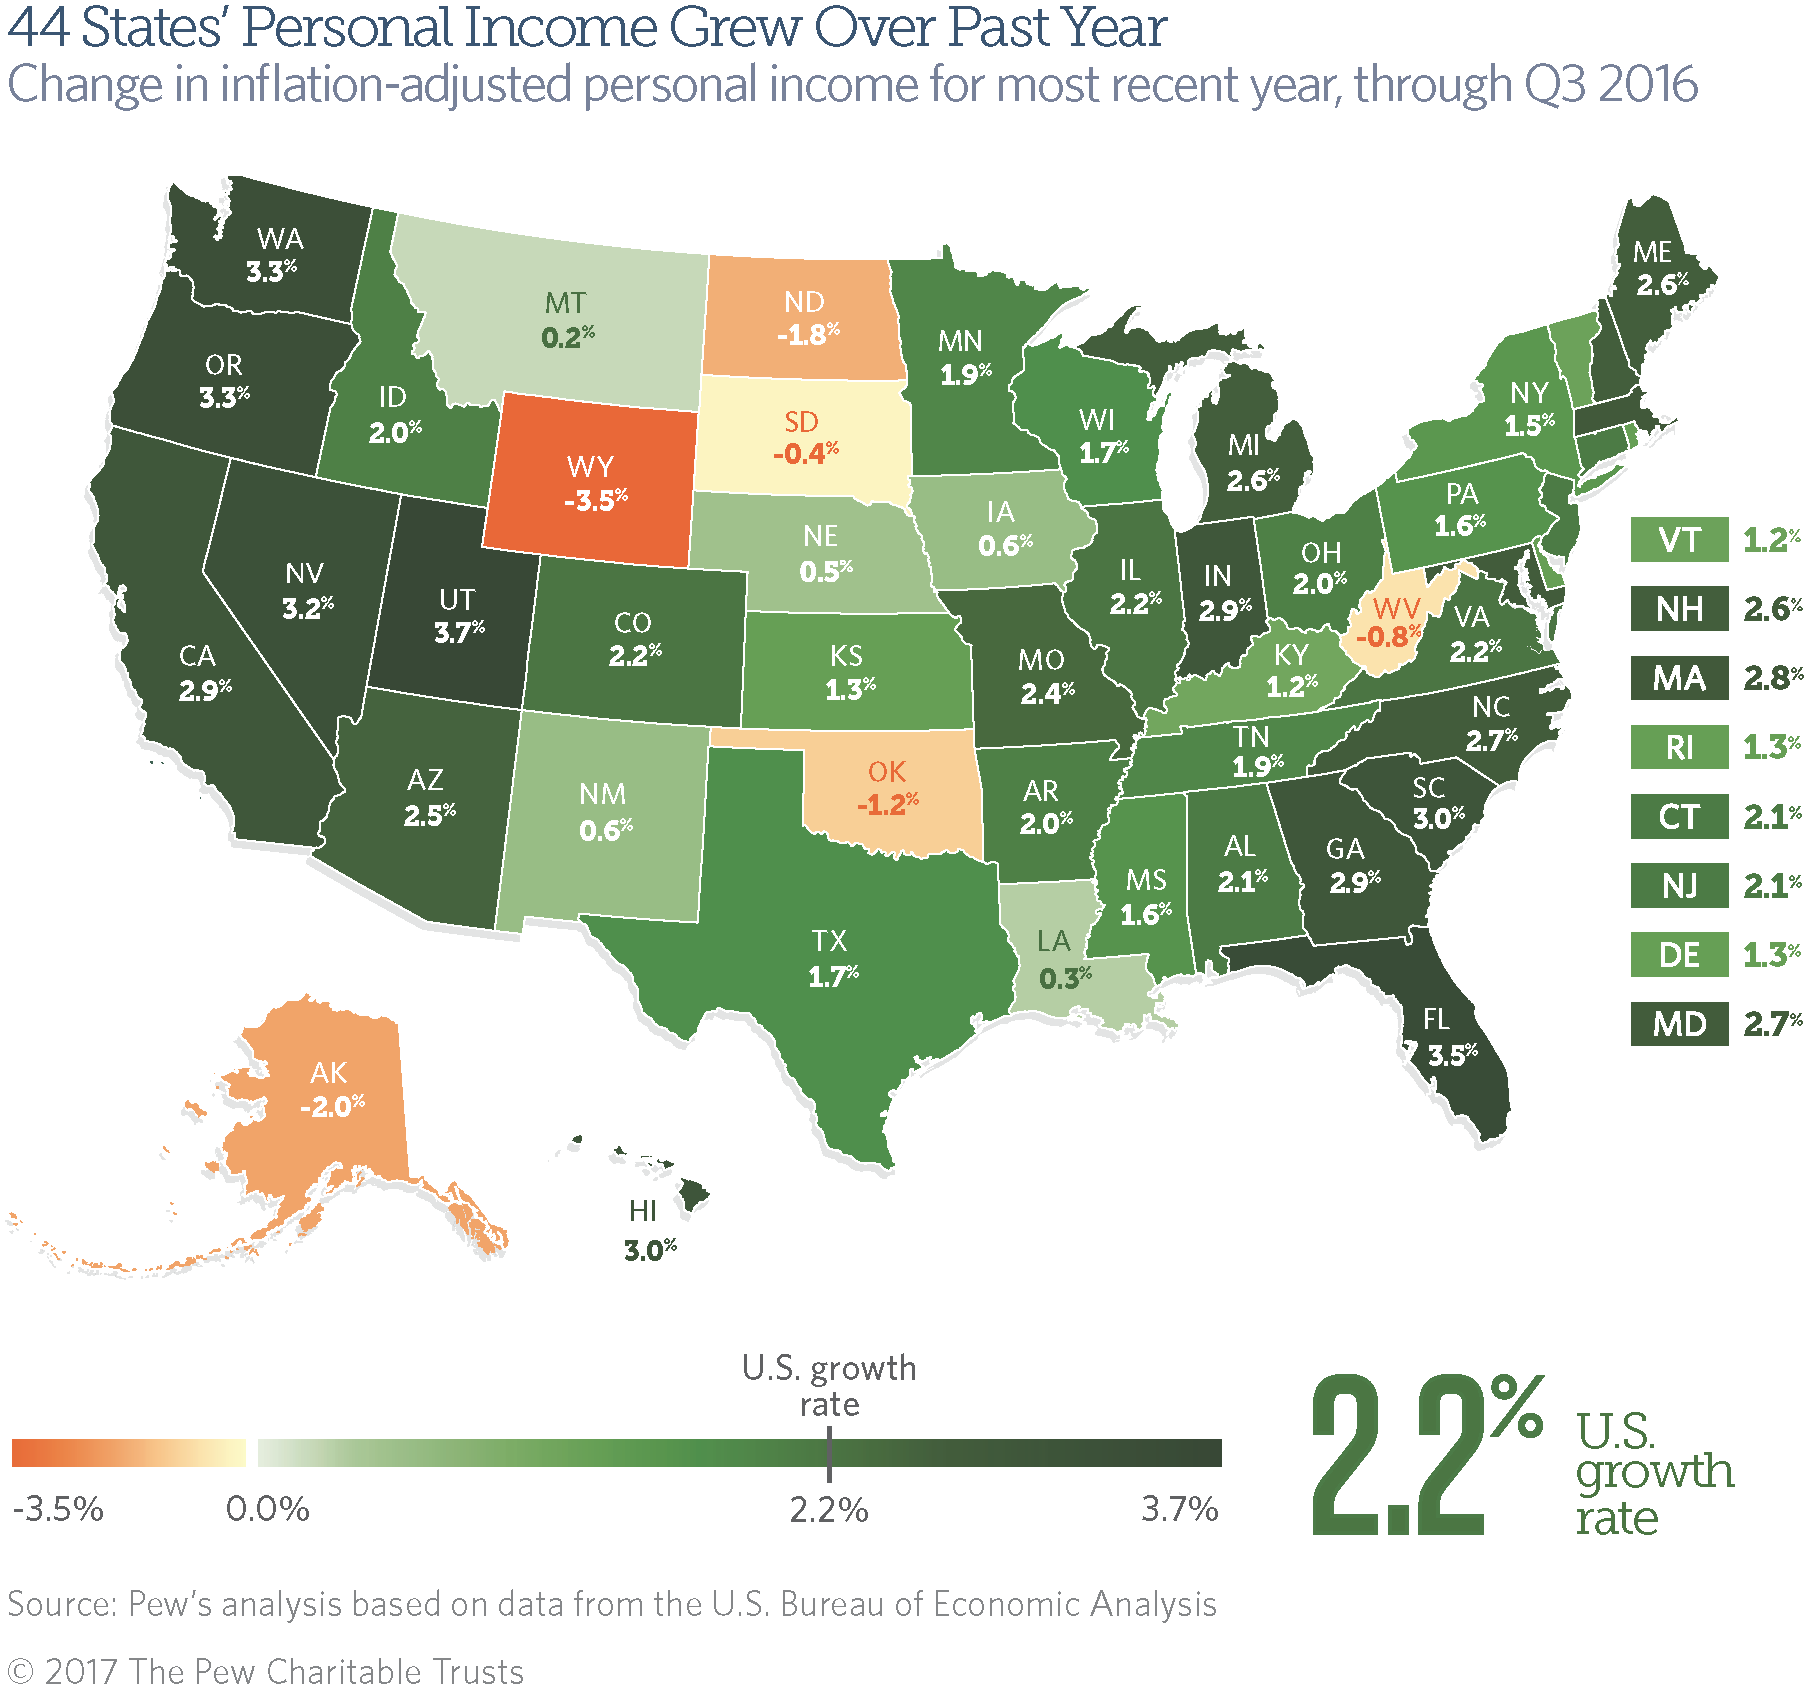
Trends in personal income for the third quarter of 2016, based on preliminary estimates, adjusted for inflation and compared with a year earlier, indicate:
- The five states with the fastest personal income growth over the year ending in the third quarter of 2016 were Utah (3.7 percent), Florida (3.5 percent), Oregon and Washington (each at 3.3 percent), and Nevada (3.2 percent).
- The six states where personal income fell were Wyoming (by 3.5 percent), Alaska (2.0 percent), North Dakota (1.8 percent), Oklahoma (1.2 percent), West Virginia (0.8 percent), and South Dakota (0.4 percent). All but South Dakota were hurt by declining earnings in mining and mineral extraction, which includes coal, natural gas, and oil production. South Dakota was hit primarily by weak farm earnings.
- Among the 44 states with gains, Montana’s was the smallest, at just 0.2 percent.
- Oregon and Utah stand out as the only states with one-year growth rates that ranked among the five fastest during each of the most recent four quarters.
- Likewise, North Dakota, Oklahoma, West Virginia, and Wyoming posted among the five slowest one-year growth rates in personal income during each of the past four quarters.
Between the third quarters of 2015 and 2016, personal income rose faster in 33 states than it had since the end of 2007, showing that each state’s economic growth over the past year was stronger than longer-term rates. In 17 states, personal income growth was weaker in the past year than since the recession, signaling that recent economic trends in these states were cooler than their expansions since the recession began.
Some ups and downs since recession
The steady pace that income would have to rise each year to reach its latest level is the constant growth rate. These rates provide a way to compare states’ growth. However, personal income did not actually change at a steady pace since the recession, instead falling in some years and rising in others. (See the “Year by year” tab for annual results in each state between calendar years 2007 and 2015.)
Comparing total inflation-adjusted dollars in each calendar year, personal income fell in just five states in 2008, but 49 states in 2009, with West Virginia the only state to escape the 18-month recession without a calendar year drop in personal income. The country rebounded over the next three years: Forty-six states’ personal income rose in 2010—Arizona, Delaware, Kansas, and North Carolina being the exceptions. All states saw increases in 2011, and all but Delaware and Georgia experienced gains in 2012. In 2013, personal income fell in 36 states, reflecting a number of taxpayers’ accelerating income into 2012 in anticipation of a potential federal tax increase in 2013. The rebound resumed over the next two years, with personal income rising in every state but Kansas in 2014 and every state but North Dakota and Wyoming in 2015.
What is personal income?
Personal income tallies residents’ paychecks, Social Security benefits, employers’ contributions to retirement plans and health insurance, income from rent and other property, and benefits from public assistance programs such as Medicare and Medicaid, among other items.
Federal officials use state personal income to determine how to allocate support to states for certain programs, including funds for Medicaid. State governments use personal income statistics to project tax revenue for budget planning, set spending limits, and estimate the need for public services.
Looking at personal income per capita or state gross domestic product, which measures the value of all goods and services produced within a state’s borders, can yield different insights on state economies.
Download the data to see state-by-state growth rates for personal income from 2007 through the third quarter of 2016. Visit Pew’s interactive resource Fiscal 50: State Trends and Analysis to sort and analyze data for other indicators of state fiscal health.

ADDITIONAL RESOURCES

Fact Sheet

Podcast


