Despite a Slump, Tax Revenue Has Recovered in 27 States
Note: These data have been updated. To see the most recent data and analysis, visit Fiscal 50
Tax collections fell in a majority of states in the second quarter of 2016, ending seven straight quarters of growth in total state tax revenue. Despite the slump, the 50-state total and receipts in 27 states were higher than before their plunge in the Great Recession, after adjusting for inflation.
Declines in 32 states dragged down total state tax revenue in the second quarter of 2016, after accounting for inflation and seasonal fluctuations. States collectively took in 5.5 percent more tax revenue at the midpoint of 2016 than they did in the third quarter of 2008, before receipts fell during the downturn. That compares with a post-recession high of 6.6 percent in the first quarter of 2016.
In the seven years since the recession ended, widespread declines in quarterly state tax revenue have been rare. The only other exception occurred in the first half of 2014 after taxpayers shifted income in response to federal tax changes. The latest declines were largely driven by economic factors, including low energy prices, downturns in the stock market in 2015 and early 2016, and lackluster growth in consumer spending. Tax cuts also contributed to recent declines in a handful of states.
The slide in tax revenue appeared to be temporary, though. Growth resumed in fiscal 2017, which began in July 2016 for most states, but has been modest, according to preliminary figures from the Nelson A. Rockefeller Institute of Government.
New uncertainty loomed for state revenue, however, with the potential for changes to federal taxes in 2017. Forty states that collect personal income taxes incorporate a range of federal exclusions, deductions, and credits into their tax codes, so federal changes could affect state tax revenue. In addition, the possibility that Congress could cut tax rates or make other tax policy changes could incentivize some taxpayers—especially high-income earners—to start timing income or deductions in anticipation of policy changes that might lower their tax liabilities, creating additional volatility in states’ tax collections.
States’ recovery from tax revenue losses since the onset of the recession has varied widely. In seven of the 27 states in which tax revenue had recovered by the second quarter of 2016, receipts were more than 15 percent higher than at their inflation-adjusted peak before or during the recession. Conversely, collections in five of the 23 states with below-peak tax revenue were down 15 percent or more, after adjusting for inflation.
State results differ dramatically because of variations in economic conditions, population changes, and tax policy choices since the recession. Among states in which tax revenue has recovered, some, such as Nevada and Washington, have raised taxes since the recession, contributing to gains. Among states in which receipts remain below their previous peaks, some, such as Florida and Ohio, chose to cut taxes since the recession.
Source: Pew analysis is based on the U.S. Census Bureau’s quarterly tax revenue data, as adjusted by the Nelson A. Rockefeller Institute of Government.
State highlights
A comparison of each state’s tax receipts in the second quarter of 2016 with its peak quarter of revenue before the end of the recession, averaged across four quarters and adjusted for inflation, shows:
- Seven states’ tax revenue had rebounded by 15 percent or more: North Dakota (36.9 percent), Minnesota (21.7 percent), Colorado (19.9 percent), Iowa (19.5 percent), Hawaii (17.2 percent), California (16.1 percent), and Maryland (16.0 percent).
- North Dakota remained the leader among all states in tax revenue growth since the recession, even though its oil fracking boom has cooled and tax collections have dropped dramatically since the 2014 plunge in oil prices. At the end of that year, receipts hit a high of 124.5 percent above their peak during the recession, compared with 36.9 percent above at the end of fiscal 2016. Besides the decline in oil-related tax dollars, an income tax cut enacted in 2015 also reduced revenue.
- Five states’ receipts were down more than 15 percent from previous peaks: Alaska (-93.9 percent), Wyoming (-31.1 percent), Louisiana (-19.1 percent), Florida (-17.7 percent), and Oklahoma (-15.1 percent).
- Alaska hit its lowest point since the recession (-93.9 percent), collecting only 6 percent as much in inflation-adjusted tax dollars as it did at its short-lived peak in 2008, when a new state oil tax coincided with record-high crude prices. Without personal income or general sales taxes, Alaska is highly dependent on oil-related severance tax revenue, which began falling even before worldwide crude prices declined in 2014 as its oil production waned.
- Also hitting a new low in tax collections since the recession were Wyoming (-31.1 percent) and West Virginia (-8.0 percent) amid weak coal, oil, and natural gas prices.
- In the second quarter of 2016, four states fell off the list of states whose tax revenue had recovered: Missouri (-0.8 percent), Indiana (-0.9 percent), Kansas (-1.0 percent), and Maine (-2.0 percent).
- Each of the top 10 oil-producing states registered a decline in tax dollars in the second quarter of 2016: Alaska, California, Colorado, Kansas, Louisiana, New Mexico, North Dakota, Oklahoma, Texas, and Wyoming. Fresh tax cuts also contributed to the drops in North Dakota and Texas.
- An additional 22 states also experienced declines: Delaware, Illinois, Indiana, Iowa, Kentucky, Maine, Maryland, Massachusetts, Missouri, Montana, Nebraska, New Jersey, New York, Ohio, Oregon, Pennsylvania, Rhode Island, South Carolina, South Dakota, Vermont, Virginia, and West Virginia.
- Six states have had at least a full year of declining tax revenue: Illinois and energy-reliant New Mexico, North Dakota, Oklahoma, Texas, and West Virginia. The lengthiest slide—of seven straight quarters—has been in Illinois, where a temporary personal income tax hike expired in January 2015.
- Eighteen states bucked the trend and took in more tax revenue in the second quarter of 2016, led by Nevada, which raised cigarette and business taxes but also has seen above-average economic growth in recent quarters.
Trends over time
The number of states that have shaken off the effects of the Great Recession and regained their tax revenue levels has risen and fallen, reflecting increased volatility in state tax collections. Compared with the previous three recessions, tax revenue growth has been significantly slower during this recovery.
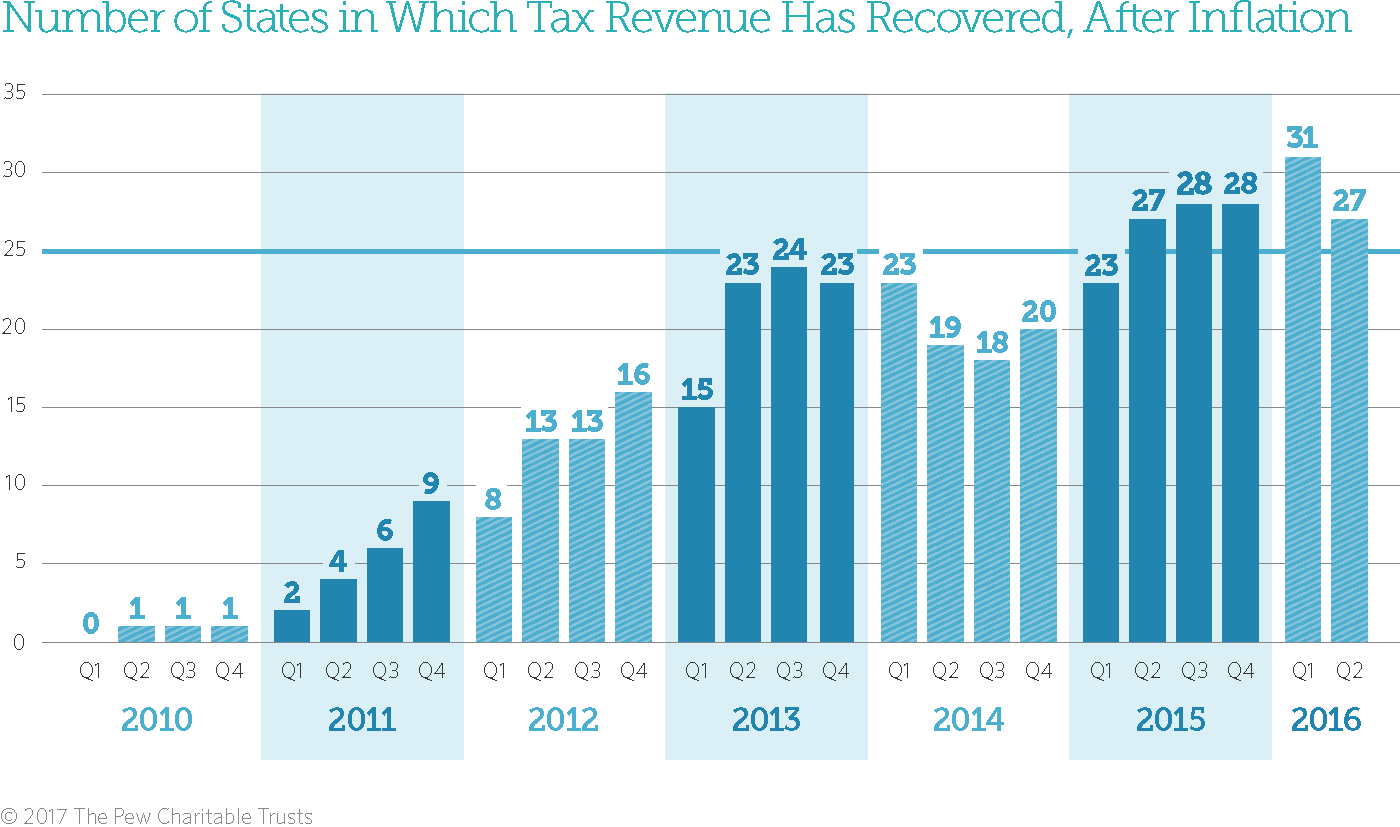
In 2010, North Dakota was the first state to surpass its recession-era peak, followed by Vermont, then Arkansas and New York by mid-2011. Tax receipts were above peak in nine states at the end of calendar 2011; 16 states at the end of 2012; 23 states at the end of 2013; 20 states at the end of 2014; and 28 states at the end of 2015.
Combined, the 50 states now have the equivalent of 5.5 cents more in purchasing power for every $1 they collected at their 2008 peak. Even states with extra purchasing power since the recession, though, can face budget pressures because of increased expenditures due to population growth, changes in Medicaid costs and enrollment, and deferred or new needs for schools, safety-net programs, corrections, employee salaries and pensions, and road maintenance and construction.
State budgets do not adjust revenue for inflation, so tax revenue totals in states’ own documents will appear higher than or closer to pre-recession totals. Without adjusting for inflation, 50-state tax revenue was 18.3 percent above peak and tax collections had recovered in 45 states—all except Alaska, Florida, Louisiana, Oklahoma, and Wyoming—as of the second quarter of 2016. Unadjusted figures do not take into account changes in the price of goods and services.
Adjusting for inflation is just one way to evaluate state tax revenue growth. Different insights would be gained by tracking revenue relative to population growth or state economic output.
Download the data to see individual state trends from the first quarter of 2006 to the second quarter of 2016. Visit The Pew Charitable Trusts’ interactive resource Fiscal 50: State Trends and Analysis to sort and analyze data for other indicators of state fiscal health.


America’s Overdose Crisis
Sign up for our five-email course explaining the overdose crisis in America, the state of treatment access, and ways to improve care
Sign up

Fiscal 50: State Trends and Analysis
Sort and chart data about key fiscal and economic trends in the 50 states, and read Pew's insights.
ADDITIONAL RESOURCES

Fact Sheet

Podcast


