Long-Term Obligations Vary as a Share of State Resources
Note: These data have been updated. To see the most recent data and analysis, visit Fiscal 50
Editor's note: The Debt and Unfunded Retirement Indicator is temporarily unavailable as Pew updates its methodology and data sources.
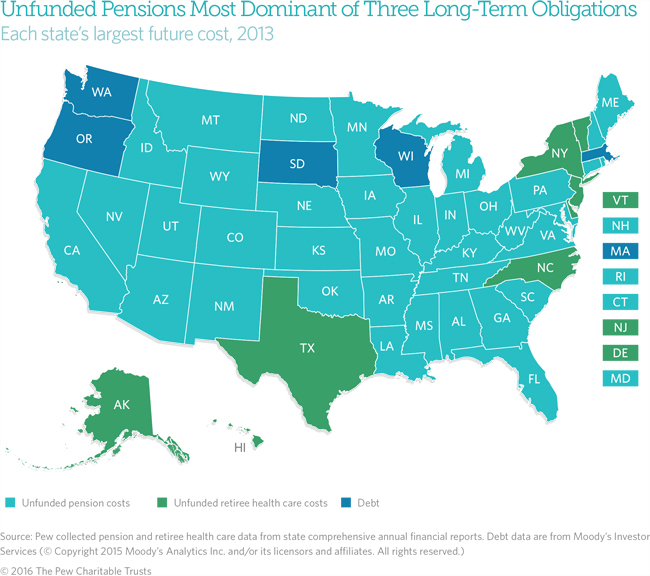
States commit to future spending when they borrow, when they fall short of fully funding pension promises, or when they commit to providing retiree health care benefits to their public employees. Unfunded pension costs grew the most and were the largest of these obligations in a majority of states, as of 2013.
Even though states may balance their budgets, they still face some long-term spending commitments—such as debt and unfunded retirement costs —that they must reckon with in the future. In 2013, states reported that they owed $968 billion in unfunded pension benefits—the equivalent of 6.9 percent of 50-state personal income, which is a measure of their economic resources. States also reported $587 billion in unfunded retiree health care liabilities (4.2 percent of personal income) and $518 billion in outstanding debt (3.7 percent).
States’ unfunded pension costs—the shortfall between benefits promised to government workers and the savings available to meet those obligations—stand out. Collectively, they not only were the largest in dollar terms of the three long-term liabilities but also grew the most over the past decade. In addition, they were larger than either of the other liabilities in 37 states.
State to state, though, the challenges posed by these claims varied. In eight states, unfunded retiree health care was the largest cost. In five states, the greatest was net tax-supported debt, which comprises bonds and other obligations typically repaid with money from a state’s operating budget. The total of these future costs also ranged widely, from more than half of personal income in Alaska (52.9 percent) to just 1.1 percent in South Dakota.
Although states have decades to pay off these sums—or, in the case of retiree health care, make changes that reduce their liabilities—these claims on future revenue can limit states’ budget flexibility when the costs come due. Less money may be available to fund other priorities, such as health care for low-income Americans or education, or to cover unexpected needs. As part of a state’s full financial picture, these liabilities also can affect credit ratings and borrowing costs. When measured as a share of personal income to reflect each state’s current resources, a snapshot of outstanding debt and unfunded retirement obligations (based on data for all retiree plans that states report on their financial statements, using their own assumptions about future costs) allows comparisons between states as well as insights into trends within states.
State highlights: Overall trends in 2013
- As a share of personal income, Alaska’s unfunded liabilities for both pensions (23.7 percent) and retiree health care (26.2 percent) were the largest among the states, explaining why its total long-term obligations including debt amounted to more than half of all the wages, salaries, business and investment income, and government-issued checks and benefits received by Alaska residents in 2013.
- After Alaska, the next-largest total liabilities were in Hawaii (46.1 percent of personal income) and Illinois (31.7 percent). The largest component of future costs in Hawaii was unfunded retiree health care; in Illinois, it was unpaid pension costs.
- Seventeen states had total liabilities greater than the national aggregate of 14.8 percent of 50-state personal income.
- The least-encumbered states overall were South Dakota (1.1 percent of personal income), Tennessee (2.4 percent), and Nebraska (2.8 percent).
Differences between liabilities
The degree of fiscal challenge posed by these liabilities varies depending on the size of a state’s budget, economy, and population. States with faster-growing economies or large reserve funds may find their obligations more manageable.
The type of liability also matters significantly. Debt and unfunded retirement costs are alike in that each creates a liability that a state must pay down or manage over time. But states take on these obligations for different reasons. They often borrow to build infrastructure projects, which can deliver services for years and spur economic growth. But when states set aside less than is needed to cover the expected full costs of pension benefits earned by their employees, it shifts expenses for public services already performed to future taxpayers.
Payment practices also differ. States usually cover their annual debt obligations before other long-term expenses because of constitutional or statutory requirements to prioritize debt repayment. Meanwhile, they sometimes defer a portion of their recommended annual payments to pension accounts and commonly set aside nothing for future retiree health care costs, preferring to pay for the cost of retired employees’ health insurance on a pay-as-you-go basis. States may refinance debt to reduce their interest costs but are obliged to fully pay back whatever they borrow, and they are legally bound under court rulings in many states to fully fund their pension promises as well. But in some cases, retiree health care benefits have fewer legal protections than pensions do. Some states have chosen to manage their liabilities by reducing retiree health benefits for current workers, retirees, or newly hired workers.
For more information, see Pew’s “State Retiree Health Care Liabilities” issue brief and "State Retiree Health Plan Spending" report.
States also face other long-term budget pressures, such as expenses for deferred maintenance and upgrades to infrastructure. But states generally do not account for these future costs.
Change in liabilities
Although a number of states have taken steps in recent years to shore up their pension savings or cut costs by modifying benefits, mostly for new workers, unfunded pension liabilities have grown more than debt or unfunded retiree health care costs.
Unfunded pension obligations increased from 2.5 percent of personal income in 2003 to 6.9 percent of personal income by 2013, the highest level in a decade, driven by a combination of factors including underfunding, lower-than-expected investment returns, and, in some cases, expanded but unfinanced benefits. (Preliminary data from Pew’s public sector retirement systems project point to a reduction in unfunded pension liabilities for the majority of states in 2014, when strong investment returns were fully recognized under new accounting standards. Some of these improvements may have been undercut by weak investment returns in pension fund accounts in 2015 and 2016, according to analysis by other groups.)
Unlike pensions, unfunded retiree health care obligations fell—from 5.0 percent of personal income in 2010, the first year for which there are reliable 50-state data, to 4.2 percent in 2013—driven by slower growth in health care costs and changes to retiree health care benefits and funding policies. State debt levels increased from 3.2 percent of 50-state personal income in 2003 to 3.7 percent in 2013, showing a reduced appetite for borrowing after debt levels peaked in 2010 as a share of personal income.
A review of state-by-state results for 2013 shows:
Pensions
- Unfunded pension liabilities were highest in Alaska (23.7 percent of personal income), Illinois (16.8 percent), Mississippi and New Mexico (both 15.3 percent), and Kentucky (14.8 percent).
- The lowest levels were in states with some of the best-funded pension plans: South Dakota and Wisconsin (both with unfunded liabilities less than 0.1 percent of personal income ), and North Carolina and Tennessee (both 1.0 percent).
- Forty-four states’ unfunded obligations grew relative to personal income from 2003 to 2013. The largest increases were in Kentucky, where pension debt rose from 2.6 percent of personal income in 2003 to 14.8 percent in 2013, an increase of 12.3 percentage points. The next-largest increases were in New Mexico (11.2 points) and Alaska (9.5 points).
- Five states saw decreases: West Virginia, where unfunded pension costs as a share of personal income fell 5.9 percentage points since 2003, helped in part by a transfer of tobacco settlement proceeds into the pension system, as well as Maine (-1.2 points), Oklahoma (-1.1 points), South Dakota (-0.5 points), and Wisconsin (-0.3 points).
Retiree health care trends
- Unfunded retiree health care liabilities were highest in Alaska (26.2 percent of personal income), Hawaii (21.9 percent), Delaware (13.9 percent), and New Jersey (13.6 percent). In all four states, unfunded retiree health care was the largest long-term obligation.
- Nebraska had no liabilities for these benefits; Indiana and Oklahoma owed 0.1 percent or less of personal income.
- In 41 states, unfunded retiree health care costs declined between 2010 and 2013 as a percentage of their personal income. The largest decreases were in West Virginia (-7.6 percentage points), Michigan (-7.2 points), and Hawaii (-6.1 points).
- In five states, these obligations increased as a share of personal income since 2010: Alaska (7.9 percentage points), Illinois (1.3 points), New York (0.6 points), Florida (0.3 points), and New Mexico (0.1 points). An additional four states were unchanged.
Debt trends
- The highest debt levels were in Hawaii (10.6 percent of personal income), and Massachusetts and Connecticut (both 8.8 percent), but each hold some debt on behalf of their local governments, particularly school districts.
- The lowest levels were in Nebraska (less than 0.1 percent of personal income), Wyoming (0.1 percent), and North Dakota (0.5 percent).
- Thirty-three states saw debt grow between 2003 and 2013. The largest increases in debt, measured as a percentage of personal income, were in California (2.1 percentage points), and New Jersey and Washington (both 1.6 points).
- Fourteen states saw decreases and three were unchanged since 2003. The largest decreases were in Florida (-0.8 percentage points), Kansas (-0.7 points), and Wyoming (-0.6 points).
Analysis by Sarah Babbage and Kil Huh
Visit The Pew Charitable Trusts’ interactive resource Fiscal 50: State Trends and Analysis to sort and analyze data for other indicators of state fiscal health.


ADDITIONAL RESOURCES

Fact Sheet

Podcast


