States Slow to Regain Fiscal Ground Lost in the Great Recession
More than four years after the Great Recession officially ended in June 2009, states’ financial conditions are improving, but most states have not regained lost ground on some key measures of fiscal health. And recovery to prerecession levels is just one hurdle. State governments face additional difficulties that could set them back even as the economy picks up.
An examination of 50-state data by The Pew Charitable Trusts’ Fiscal 50: State Trends and Analysis, a new online resource, shows that the recovery has been fragile and varies widely from state to state. Tax revenue, employment rates, and reserve funds still are lower in a majority of states than they were before they plunged during the recession. While those measures are moving in the right direction, unavoidable pressures loom and could slow further progress.
One hurdle is the burden of unfunded pension and retiree health care costs for public workers. In 43 states, the aggregate of these long-term retirement obligations is larger than the public debt from bond issuances and other state borrowing. States also will have to adjust to belt-tightening by the federal government after a period in which federal dollars made up a bigger share of overall state revenue than at any time in at least 50 years. Federal funds have largely driven growth in total state spending over the past two decades, and especially after the recent recession.
Why does state fiscal health matter?
All of these factors affect the fiscal health of state governments, which deliver critical services such as health care for the needy, education, transportation, and public safety. State finances also matter because of their impact on the U.S. economy. State spending accounts for 4 percent of the nation’s economic output, and states provide about one-third of local governments’ budgets. Because of this crucial role, Congress and the White House rushed economic stimulus aid to state capitals after the deepest and longest recession since World War II hit the country in December 2007.
What is this new fiscal resource?
Pew’s Fiscal 50 identifies five core areas that contribute to states’ fiscal health: Revenue, Spending, Economy and People, Long-term Costs, and Fiscal Policy. Within this framework, Pew highlights trends, makes 50-state comparisons, and provides unique insights into significant fiscal, economic, and demographic indicators that influence state finances. The goal is to be selective rather than comprehensive in choosing indicators. Each indicator is designed with states’ long-term financial well-being in mind rather than the short-term perspective of what it takes to balance the budget each year.
Fiscal 50 currently focuses on six indicators and their key takeaways.
- Tax Revenue—For the first time, the combined tax revenue of the 50 states appears to have narrowly recovered to its peak level before receipts plunged in the recession, in inflation-adjusted dollars. Results for the second quarter of 2013 represent a milestone but fall short of erasing the recession’s effects. For one thing, recovery was uneven. Only 20 states’ tax collections were above their inflation-adjusted peaks.
- Federal Share of State Revenue—A record-high level of more than $1 of every $3 of state revenue came from the federal government in the wake of the recession, ranging from nearly 49 percent of revenue in Mississippi to a low of 24 percent in Alaska in fiscal year 2011. Since then, states have had to cope with the loss of federal stimulus dollars and the effects of tighter federal budgets.
- Change in State Spending—After the Great Recession ended, total spending by state governments hit its highest level as a share of the economy in at least 20 years. Federal funds drove the growth as spending from states’ own dollars shrank as a share of personal income.
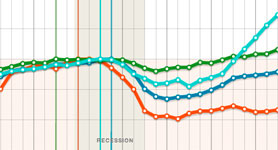
- Employment-to-Population Ratio—About 76 of every 100 Americans in their prime working years had a job in the 12 months ending in June 2013, compared with nearly 80 of every 100 in 2007, before the recession. The decline translates to lower tax revenue for states and increased expenses for assistance programs for the jobless.
- Debt and Unfunded Retirement Costs—Although states pass balanced budgets, some spending commitments that will not come due for years go unpaid. Among these are long-term obligations for public debt and unfunded pension and retiree health care benefits. As of fiscal 2010, unfunded pension costs in 31 states were a bigger liability than either debt or unfunded retiree health care promises.
- Reserves and Balances—Sixteen states expected their financial cushions to be restored to prerecession levels by the end of fiscal 2013. Although states’ rainy day reserves and general fund balances collectively are growing, three states expected to have less than five days’ worth of operating costs set aside for unexpected expenses.
For most indicators, Fiscal 50 allows users to compare their states with others and to a national benchmark, providing insights and perhaps raising questions in state capitals about why states lead or trail their peers. This resource will be updated when new data are available, and more indicators and analysis will be added.
Fiscal 50 builds on data from the 50 states obtained from U.S. government agencies, the Nelson A. Rockefeller Institute of Government, the National Association of State Budget Officers, the National Governors Association, and Pew’s own research. Differences can be expected between certain fiscal data used in this analysis and data compiled and used by states for their own budgeting purposes. Data featured in Fiscal 50 are the best available for drawing fair comparisons across states.
ADDITIONAL RESOURCES

Fact Sheet

Podcast


