Lines at the Polls in the 2012 General Election
Return to Election Data Dispatches
Today’s data dispatch is the first of five that will take a closer look at the 2012 Survey of the Performance of American Elections. The survey, conducted by Charles Stewart III, Kenan Sahin distinguished professor of political science at the Massachusetts Institute of Technology, in partnership with The Pew Charitable Trusts, asked 10,200 registered voters nationwide about their experiences in the 2012 presidential election.
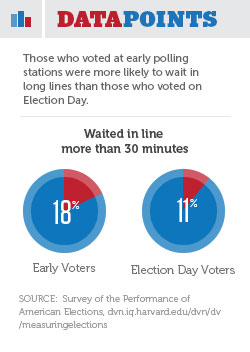
Lines at the polls were the big story in election administration in 2012, and data from the survey provide a clearer picture of who waited in line and where:
- Early voters were more likely than Election Day voters to wait in line for more than half an hour. Of those who voted at early polling stations, 18 percent reported waiting more than 30 minutes, compared with 11 percent of those who voted on Election Day.
- Differences were found across racial groups. Twenty percent of black voters and 17 percent of Hispanic voters reported waiting more than 30 minutes, compared with 11 percent of white voters.
- Many of the states with the longest average wait times in 2008 also had the longest waits in 2012: Florida, Georgia, Indiana, Maryland, Michigan, Oklahoma, South Carolina, and Virginia. Florida had the longest average wait time in 2012 at 45 minutes.
ADDITIONAL RESOURCES

Article

Article