COVID-19 Deals Setback to All States’ Employment Rates
Note: This data has been updated. To see the most recent data and analysis, visit Fiscal 50.
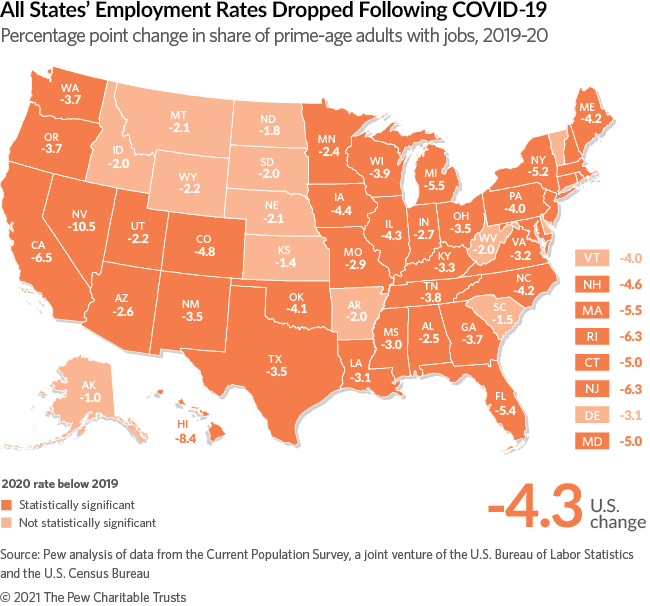
For people of prime working age, employment rates fell in all states in 2020 compared with the year before the COVID-19 pandemic disrupted the economy. States most dependent on leisure and hospitality businesses, such as Nevada and Hawaii, experienced the steepest drops. Economic growth has since strengthened, with national prime-age employment recouping about three-quarters of its losses from early in the pandemic as of July.
An average of 75.6% of Americans ages 25-54 were employed last year, down sharply from 80% in 2019. This means that for every 100 people of prime working age, about four fewer were employed in 2020 than in 2019 as the pandemic stifled economic activity for much of the year.
The pandemic hit just as the national prime-age employment-to-population ratio had finally surpassed its pre-Great Recession level in 2019, although rates in 24 states still had not fully recovered. The new downturn dealt all but three states their largest annual declines in the prime-age employment rate in more than 10 years.
Rates dropped throughout the country, but the change was statistically significant—or clearly below pre-pandemic levels—in 37 states. Among those states were Nevada and Hawaii, which recorded the largest average declines (-10.5 and -8.4 percentage points, respectively) over the 12 months of 2020 compared with the average for 2019. Some of the hardest-hit jobs were those in leisure and hospitality. Casinos, hotels, and other attractions closed or scaled back operations for months in Nevada, accounting for about two-thirds of the state’s annual average job losses among people of all ages. Air travel to tourism-dependent Hawaii ceased nearly completely as the pandemic struck, and as of July 2021 still hadn’t fully recovered. California’s employment rate among prime-age adults had the third-biggest dip of 6.5 points as total annual employment dropped for every major sector of the state’s economy, led by a loss of more than half a million jobs in leisure and hospitality.
Data in early 2021 pointed to a recovering labor market that still had a long way to go. The national percentage of employed 25- to 54-year-olds was 77.8% in July, suggesting that the rate had rebounded by an estimated three-quarters from its initial drop to 69.6% in April 2020 when the pandemic triggered business closures, according to the Labor Department’s national seasonally adjusted estimates.
The prime-age employment-to-population ratio serves as a key economic indicator. It provides a broader view of labor market conditions than the often-cited unemployment rate, which excludes those not looking for work.
Employment ratios are influenced not only by job losses, but also by population and demographic shifts. The ratio decreases when the number of 25- to 54-year-old workers in a state either declines faster or increases slower than the population for the same age group. Although the prime-working-age population dipped in nearly half of states last year, the loss in corresponding employment was even greater, so their rates declined.
State Highlights
A state-by-state comparison of the percentage point change in annual average employment-to-population ratios for 25- to 54-year-olds between 2019, which was before the pandemic, and 2020 shows:
- After Nevada, Hawaii, and California, the next-largest drops were in New Jersey and Rhode Island, where rates in both states were 6.3 percentage points lower than in 2019. This means that for every 100 people in this age group, at least six fewer had jobs in 2020 than before the pandemic. Changes were statistically significant.
- Seven of the 10 states sustaining the largest percentage-point declines were on the East or West coast as their economies tend to be more tied to industries devastated by the pandemic.
- Alaska experienced the smallest decline (a 1 percentage point drop that was not considered statistically significant, meaning that the change could have resulted from sampling or other error). But the state’s economy has not fared well during the pandemic. Its prime-age employment rate was already among the nation’s lowest heading into the COVID-19 recession after declining for most of the past decade, so it didn’t have as much room to fall as other states. Across all age groups, Alaska incurred one of the sharpest annual declines in total jobs last year, according to Current Employment Statistics data, and its younger workers sustained far more severe declines than those of prime working age.
- Other states with the smallest annual declines were Kansas (-1.4 percentage points) and South Carolina (-1.5 percentage points), although neither of these changes was statistically significant. States with the smallest statistically significant drops were Utah (-2.2. percentage points) and Minnesota (-2.4 percentage points).
Workers experienced disparate impacts
Stark disparities have emerged in how various segments of the workforce have held up over the two-month recession ending in April 2020 and the subsequent recovery. Low-income workers, in particular, have struggled to regain a foothold in the economy as they are often employed in industries most upended by the pandemic, such as restaurants and hotels. The same is true of younger workers: The 2020 employment-to-population ratio for those under age 25 fell nationally even more sharply than for those in their prime working years, compared with the year earlier. Prime-age employment rates similarly dropped more for Black (-5.9 percentage points) and Hispanic Americans (-5.8 percentage points) last year than for their White peers (-3.9 percentage points.)
How employment affects state ledgers
Economic conditions, including employment, are major drivers of state finances. Changes in employment rates among adults in their prime working years can affect both sides of a state’s budget ledger.
- Revenue: Paychecks help generate individual income tax dollars and fuel consumer spending, which produces tax revenue from sales and business income.
- Expenditures: People without jobs frequently need more services such as Medicaid health care coverage and other safety-net assistance, which can increase states’ costs.
What is the employment-to-population ratio?
Although unemployment figures receive substantial media attention, many economists also track the employment-to-population ratio because it provides a broader view of labor market conditions. The unemployment rate, for example, excludes people who are not looking for jobs, but the employment rate captures this group in its measurement of population.
Focusing on 25- to 54-year-olds reduces the distortion of employment trends resulting from demographic effects such as older and younger workers’ choices regarding retirement or full-time education.
Another gauge of employment trends is the labor force participation rate. While the employment-to-population ratio tracks the percentage of the population that has jobs, the labor force participation rate measures the percentage that is working or actively looking for work.
A statistically significant decrease or increase indicates a higher level of confidence that there was a true change in the employment rate. Changes that are not statistically significant offer less certainty and could be the result of variations in sampling or other methods used to produce employment estimates. Without additional testing for statistical significance, caution should be exercised when comparing changes in employment rates among states.
Download the data to see individual state trends. Visit Pew’s interactive resource Fiscal 50: State Trends and Analysis to sort and analyze data for other indicators of state fiscal health.
Analysis by Jeff Chapman, Mike Maciag, and John Hamman


America’s Overdose Crisis
Sign up for our five-email course explaining the overdose crisis in America, the state of treatment access, and ways to improve care
Sign up
Fiscal 50: State Trends and Analysis
