The State Pension Funding Gap: 2017
Overall debt decreases but disparity grows between well-funded and fiscally challenged public worker retirement plans

Overview
After nine years of revenue growth and strong investment performance, the pension funding gap—the difference between a retirement system’s assets and its liabilities—for all 50 states remains more than $1 trillion, and the disparity between well-funded public pension systems and those that are fiscally strained has never been greater. New research by The Pew Charitable Trusts shows that although every state experienced investment losses during the 2007-09 Great Recession, the eight states with the best-funded retirement systems rebounded and were, on average, 95 percent funded by 2017. Conversely, the 20 states with the lowest-funded pension plans saw the financial position of their systems decline steadily from 76 percent funded in 2007 to 56 percent in 2017.
Ultimately, differences in state pension funding levels are driven by policy choices. These eight well-funded states provide a road map for how, through consistent adherence to contribution policies and the use of tools to manage risk, states can sustainably fund retirement benefits while providing workers with a path to recruitment security.
Our analysis shows how these well-funded states successfully coped with the adverse effects of the recession. They consistently made their actuarially determined contributions and had policies in place to manage risk and costs. For example, South Dakota, Tennessee, and Wisconsin—the three states with the best-funded pension plans in 2017—have all paid 100 percent of the contributions that actuaries recommended. These states also follow policies to automatically lower benefits or increase contributions in response to market downturns. As a result, retirement systems in these states were nearly fully funded or had surplus funding in 2017 while maintaining stable contribution rates. On average, these contributions were less than a quarter of those of the three worst-funded states.
Kentucky, New Jersey, and Illinois have the worst-funded retirement systems in the nation in part because policymakers did not consistently set aside the amount their own actuaries said was necessary to cover the cost of promised benefits to retirees. As a result, the pension funds in those three states had less than half of the assets needed to cover liabilities in 2017. Underfunding pensions also increases pension costs significantly over time. Pension contributions went up 424 percent in Illinois, 267 percent in Kentucky, and more than 100 percent in New Jersey from 2007 to 2017, reducing resources available for other important public priorities. Despite these increases in contributions, the three states collectively fell $11.5 billion short of the amount needed to keep pension debt from growing.
Pew has been tracking state-run pension system funding since 2007. This latest study covers data for state-run pension systems for fiscal year 2017, the most recent year for which comprehensive data were available for all 50 states. The 230 plans included in Pew’s data cover state employees, teachers, police officers, firefighters, university professors, and other state and local public employees. This brief examines the continued divide in most states between the assets and liabilities of their pension plans, and compares the divergent paths of wellfunded and fiscally challenged states over the past decade. The brief also identifies proven practices and tools that can help legislators strengthen policies and better manage risk for their state’s retirement plans.
In 2017, the state pension funds in this study cumulatively reported a $1.28 trillion funding gap—an improvement from the $1.35 trillion deficit in 2016, driven primarily by strong investment returns of about 13 percent for the median plan. But these strong returns masked the fact that total employer contributions in 2017 fell $26 billion short of minimum actuarial funding standards (the amount that would be required to keep pension debt from growing if investment returns had equaled plans’ assumed rates).
What’s more, the strong investment performance in 2017 was due to high allocations of assets to stocks and alternative investments such as private equity, hedge funds, and real estate. Although these vehicles can produce high returns, they also expose plans to increased risk and volatility. Based on investment returns posted since 2017, Pew estimates a deficit of approximately $1.5 trillion as of December 2018.
Ongoing declines in pension funding levels increase the pressure on state and local budgets as the cost of pension debt rises. Employer contributions to state pension systems have grown faster than state revenue since 2007, accounting for nearly $180 billion in additional spending that otherwise could have funded other programs and services. However, this gap is not evenly distributed among the states. For example, employer contributions in 2017 in the three states with the worst-funded pension systems averaged more than 30 percent of the payroll for covered employees. The three states with the best-funded pension systems had contributions averaging only about 8 percent of payroll.1
Forward-looking metrics such as net amortization and the operating cash flow ratio (both defined in “Key Terms”) can aid policymakers in assessing whether their state’s contribution policies are sufficient to make progress in paying down pension debt and keeping assets from being depleted. The operating cash flow ratio, in particular, can serve as an early warning of potential fiscal distress for states whose pension systems are poorly funded.
Key Terms
- Actuarial contribution: Using plans’ own economic and demographic assumptions, the calculation of the actuarial contribution includes the expected cost of benefits earned for the current year and an amount to reduce some of the unfunded liability. Under prior rules, the actuarial required contribution was a mandatory disclosure in governmental financial statements. But starting in 2014, states instead had the option of reporting the actuarially determined employer contribution.
- Assumed rate of return: State and local pension plans make assumptions as to what longterm investment returns will be to estimate the current cost for pension promises that will come due years in the future. The median assumption used by state pension plans in 2017 was 7.15 percent.
- Employer contribution: State pension plans are typically funded by contributions from participating employers—which can include the state itself as well as local governments, public universities, school districts, and other government entities.
- Employer contribution rate: Employer contributions are often expressed as a percentage of covered payroll to compare the size of pension costs across state and local government employers of different sizes. Setting costs as a percentage of payroll also allows costs to be allocated across different participating employers.
- Funded ratio: The level of a plan’s assets, at market value, in proportion to accrued pension liability. This is an annual point-in-time measure as of the valuation date.
- Net amortization: Measures whether total contributions to a public retirement system would have been sufficient to reduce unfunded liabilities if all actuarial assumptions—primarily investment expectations—had been met for the year. The calculation uses the plan’s reported numbers and assumptions about investment returns. Plans that consistently fall short of this benchmark can expect to see the gap between the liability for promised benefits and available funds grow over time.
- Net pension liability: Current-year pension debt calculated as the difference between the total value of pension benefits owed to current and retired employees or dependents and the plan assets on hand. Pension plans with assets greater than accrued liabilities show a surplus.
- Operating cash flow: The difference, before investment returns, between expenses (including benefit payments) and employer and employee contributions. When divided by assets, it is a benchmark for the rate of return required to ensure that asset balances do not decline.
- Own-source revenue: Revenue raised directly by state and local governments, generally excluding funds from the federal government. Pew examines trends in pension costs as a share of own-source revenue to measure the crowding out of state resources to pay for pensions.
- Hybrid plan: A plan type that combines a defined benefit (DB) with a separate defined contribution (DC) savings account. Typically, the separate DB and DC components of a hybrid plan provide a smaller benefit than they would in a stand-alone DB or DC plan. One variation is a risk-managed hybrid that includes provisions to automatically share unexpected costs among employers and employees through the DB component.
Funding gap in 2017 shows economic recovery has not lowered debt
States reported a total liability of $4.1 trillion in pension obligations to workers and retirees in 2017, and $2.9 trillion in assets set aside to pay for those benefits, creating the funding gap of $1.28 trillion. This was a decrease from the previous year’s gap of $1.35 trillion and only the second reported decrease since the recession.2
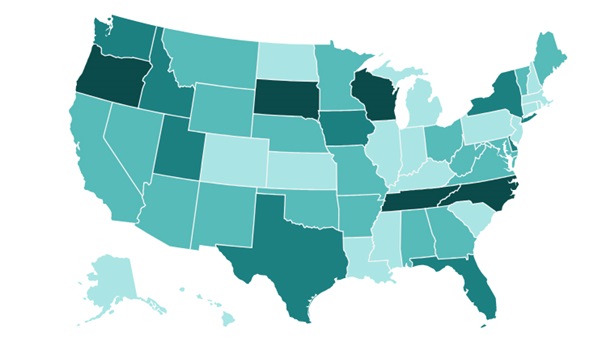
Overall in 2017, states had 69 percent of the assets they needed to fully fund their pension liabilities—ranging from 34 percent in Kentucky to 103 percent in Wisconsin. In addition to Kentucky, four other states—Colorado, Connecticut, Illinois, and New Jersey—were less than 50 percent funded, and another 15 had less than two-thirds of the assets they needed to pay their pension obligations. Only Idaho, Nebraska, New York, North Carolina, South Dakota, Tennessee, and Utah joined Wisconsin in being at least 90 percent funded (Figure 1).

The overall figure of 69 percent of pension liabilities being funded nationwide is down from funded levels before the recession, when state pension plans, in total, were 86 percent funded. Investment losses during the recession caused pension assets to drop in value by 24 percent from Dec. 31, 2007, to December 31, 2008.3 Similarly, state and local pension debt—measured as a share of gross domestic product (GDP)—reached historic highs in 2009 and 2011, with debt levels failing to return to pre-recession levels almost 10 years later (Figure 2). Looking at pension debt as a percentage of GDP sheds light on how pension costs could take up an increasing share of the budget in many states, making it more difficult for lawmakers to find money to invest in other important public services.

The growing funding gap, and accompanying decline in state pension funding levels, has occurred despite a substantial increase in employer contributions—resulting in a higher burden for taxpayers who are on the hook for increasing employer costs. Employer contributions as a share of state own-source revenue have nearly doubled since 2001—from 3.7 percent to 7.4 percent—meaning that a greater share of state resources is being allocated to pay for past pension obligations rather than current public services. Because pension costs have grown faster than the revenue available to pay for them, states have effectively diverted approximately $180 billion in spending since 2007 that could have been used to pay for teachers, firefighters, or bridges.
Disparity between best- and worst-funded systems has never been greater
The past decade has seen a continuing drift between the best- and worst-funded state pension plans. For example, South Dakota, Tennessee, and Wisconsin—the three states with the highest funded ratio, or the percent of the assets they need to fully fund their pension liabilities—were, on average, 97 percent funded in 2007. By 2012, at the low point of the business cycle triggered by the recession, their collective funded ratio had dropped by only 2 percentage points, to 95 percent. Conversely, the three states with the lowest funded ratios in 2017—Illinois, Kentucky, and New Jersey—saw a drop from 69 percent funded, on average, in 2007, to 51 percent funded in 2012.
More concerning is that even with strong investment returns over the five years ending in fiscal year 2017, the states with the worst-funded plans continued to report declining financial positions. Between 2012 and 2017, Illinois, Kentucky, and New Jersey reported an average 15 percent decrease in state funded ratios.
In contrast, funding levels in South Dakota, Tennessee, and Wisconsin increased by 5 percentage points over the same period. The three have funded ratios between 97 and 103 percent, and over the past two decades have never fallen below 89 percent.
The healthy funding ratios in South Dakota, Tennessee, and Wisconsin haven’t required significant increases in employer pension contributions, which averaged 8 percent of payroll in 2017 in the three states and have consistently held between 5 and 12 percent of payroll throughout the past decade. Conversely, the three states with the worst-funded plans had an average employer contribution rate of more than 31 percent of payroll in 2017—a 22 percentage point increase since 2007. Because growing pension debt leads to higher costs, states with poorly funded plans have had to increase their employer contributions. Because well-funded plans have consistently kept pension debt to a minimum, they have achieved full funding while also maintaining low impacts to state budgets.

Most state retirement systems more closely resemble those of the worst-funded states than those in well-funded states. For example, only eight states were at least 90 percent funded in 2017, while 20 states were less than two-thirds funded. And although all states suffered declines in funded status over the five years between 2007 and 2012, the states that were 90 percent funded had a subsequent recovery in funded levels of 5 percentage points, on average, between 2012 and 2017—a period in which investment returns exceeded plan assumptions. States that were less than two-thirds funded suffered, instead, an additional 5 percentage point decline in financial position over the same period.
The overall poor financial position of state pensions, along with the fact that 23 states were not able to sufficiently raise contributions during a period of economic growth to improve their pension balance sheets, raises concerns about how some states would fare in the case of a future recession. In fact, the combined funded level of state pensions in 2017 is nearly identical to that of plans in Illinois, Kentucky, and New Jersey immediately preceding the onset of the recession—collectively, they were 69 percent funded. The experience of these three states during the recession and their inability to recover in the aftermath is a stark reminder that states must plan for downturns now to avoid fiscal distress in the future.

States that have effectively managed their pension obligations
Wisconsin, Tennessee, and South Dakota—states with the best-funded pension plans—successfully weathered the recession for two reasons: They consistently made full actuarial contributions in good financial times and in bad, and they followed sound risk management policies that allowed them to weather the volatility from investment and other risks.
Wisconsin
Wisconsin is one of only 10 states that have paid their full actuarial contribution every year from 2007 to 2013 and one of just 12 that achieved positive amortization from 2014 to 2017.4 Despite incurring losses during the recession, the Wisconsin Retirement System (WRS) maintained total contributions between 2014 and 2017 that exceeded by 36 percent the amount needed to keep pension debt from growing, resulting in positive amortization of over $1 billion.
The WRS is also designed to distribute any costs of short- or long-term deviations from plan expectations among employers, employees, and retirees by sharing the cost of poor investment returns during market downturns, as well as the benefit of strong investment performance during upswings. For example, while an employee is working, contributions from employers and employees rise and fall equally in response to market conditions. Moreover, once an employee begins drawing a pension, cost of living adjustments (COLAs) are set using a conservative return assumption of 5 percent—well below the WRS’ long-term return assumption of 7.2 percent. This approach effectively builds in a margin of safety against the costs of market risk and volatility: Annual COLA increases for retirees are implemented only when earnings exceed 5 percent (which they have done in 23 of the past 33 years), and can be suspended or rescinded if funded levels drop below 100 percent.5
Tennessee
The Tennessee Consolidated Retirement System (TCRS) follows strategies similar to those employed by Wisconsin’s plan. Like Wisconsin, the state and local governments participating in TCRS have never fallen short of the actuarially determined contribution to the system since 2000, and have increased contributions to eliminate pension debt when needed. For example, rather than lowering employer contributions in response to investment gains in 2010 and 2011, TCRS implemented a policy to increase pension payments, effectively speeding up the return to full funding and allowing the plan to keep costs stable in subsequent years despite volatility in investment performance.
In addition, Tennessee adopted in 2013 a risk-managed hybrid benefit design for new state employees and teachers (local governments were given the option to adopt the new plan design) to further reduce future budget pressures from market fluctuations and rising pension costs. Risk-managed hybrid plans combine a smaller defined benefit (DB) plan with a defined contribution (DC) plan. The DB portion of the hybrid offers a fixed benefit to the worker; the DC portion provides a fixed cost for the employer, but the employee’s final benefit will depend on investment performance. The combination distributes risk between both parties, giving each more certainty than a sole defined benefit or a sole defined contribution plan design provides.
Like Wisconsin, Tennessee’s benefit design includes risk management tools to keep employer costs stable by calculating contributions using conservative assumptions. For example, annual employer contributions to the DB component of the hybrid plan are set at a rate, 4 percent, that is higher than the expected cost. Payments in excess of annual costs are placed in a stabilization reserve account that is used to offset additional costs in years when the funded level drops below 100 percent. And if those funds aren’t sufficient to improve the funded status of the plan, the plan design also includes five policy changes that are automatically triggered—reducing benefits and increasing employee contributions, as needed—until the plan is back on track to full funding. As a result, the employer contribution to the DB component will never go above the 4 percent contribution rate. In combination, these policies mitigate risk to taxpayers while providing workers with a secure retirement package.
South Dakota
Like Wisconsin and Tennessee, South Dakota has a track record of meeting actuarial funding benchmarks and uses conservative assumptions, including an expected long-term investment return of 6.5 percent—significantly below state pension plans’ median assumption of 7.15 percent. South Dakota differs, however, in that employer and employee contribution rates are fixed by statute rather than set by actuarial calculations that automatically adjust to fiscal conditions. Instead, the South Dakota Retirement System (SDRS) automatically adjusts benefits as needed to ensure that the statutory contribution rate is adequate to pay for pension benefits and that the plan remains 100 percent funded.
For example, COLAs must remain below the level that plan actuaries calculate is necessary to maintain full funding, so if an investment shortfall or some other change reduces funded levels, the maximum allowable COLA is likewise reduced. This approach provides real-time adjustment to changing conditions based on clear rules, as opposed to the ad hoc reductions in COLAs that many states employed in the years following the recession.6
The SDRS is also notable for its transparent risk reporting. The SDRS began releasing stress tests of its plan assumptions in 2018, projecting funded levels out over five years under both a low-return and high-return scenario in addition to the plan’s assumed rate of 6.5 percent. These scenario analyses are released publicly and employed by the plan to keep stakeholders informed of the exposure of the plan and members’ benefits to investment risk affecting the fund’s financial position. For example, the plan’s most recent stress test revealed that the automatic COLA adjustments would maintain a 100 percent funded ratio through five years of 3.82 percent returns.7
Although there is no one-size-fits-all approach to retirement policy, these three states illustrate that different approaches to offering benefits and managing costs can yield a consistent set of characteristics and practices that all jurisdictions can model. Specifically, all three consistently achieve full actuarial funding while having policies that mitigate the costs of uncertainty and risk—including reasonable assumed rates of return and mechanisms that share unexpected costs among employers, employees, and retirees.
Measures that point to the future can identify states that have unsustainable pension policies
Traditionally, the fiscal health of a retirement system has been assessed using the funded ratio, which measures the impact of past decisions and policies on a plan’s financial position at a fixed point in time. However, the funded ratio cannot shed light on whether current policies provide for a plan’s sustainable funding and fiscal position in the future. Long-term actuarial projections of key financial metrics provide the greatest insight into a plan’s future financial health. But publicly available data can also be used to construct forward-looking metrics that provide some insight into expected balance sheet trends over the near term.
For example, Pew calculates two measures—the net amortization benchmark and the operating cash flow ratio—to assess, respectively, the adequacy of contribution policy and the dependence of public pension plans on investment returns.8 These measures can help identify states that can be expected to see improvement over time—as well as those with unsustainable policies going forward.
Net amortization: Most states fell short of minimum contribution benchmarks
Net amortization measures whether total contributions to a public retirement system would have been sufficient to reduce unfunded liabilities if all expectations had been met for that year. For example, if every plan assumption had been met in 2017, state pension plans collectively would still have a negative calculated net amortization and their debt would have grown by $26 billion.
Over the past three years, most states fell short of the net amortization benchmark, although individual state performance varied significantly (Figure 5). For example, the 10 states with the lowest average net amortization from 2015 to 2017 would have had to contribute an additional 12 percent of payroll over that period to hold pension debt constant. Conversely, the top 10 states exceeded that benchmark by an average of 8 percent of payroll.
Figure 5 shows net amortization as a share of payroll for each state from 2015 to 2017. Factoring in total payroll helps to normalize the results of states of different sizes. It also allows the number to be expressed as the increase in the contribution rate that a state would have needed to achieve positive amortization over that period. Because volatile investment returns, among other factors, can cause the benchmark to fluctuate, aggregating over three years gives a better picture of the long-term trend.

Three states in particular—New Jersey, Illinois, and West Virginia—provide useful case studies on how the net amortization benchmark can be used to identify whether a troubled system’s funding policy is adequate to restore its fiscal position over time.
New Jersey has consistently failed to meet minimum actuarial funding standards since 2000, although policymakers have committed to making the full payment by 2023. The Garden State’s average net amortization as a share of payroll between 2015 and 2017 was minus 25 percent. As a result, the state would have needed additional contributions equal to 25 percent of payroll from 2015 through 2017 to avoid an increase in pension debt. If policymakers adhere to scheduled increases in employer pension contributions over the next five years, this metric will improve, as will the funded status of the state’s pension plans.
In contrast, although Illinois has had a recent track record of meeting the contributions required by the state’s funding plan, those payments were insufficient to make progress on paying down the state’s pension debt. In fact, its pension debt has grown, driven by the state’s contribution policy and practices. First, Illinois’ actuarially recommended contributions are calculated over such a long time horizon—with a 50-year payment schedule ending in 2045—that the resulting annual payments are not large enough to cover both pension benefits and the interest on the pension debt. Even with a 50-year payment schedule, Illinois’ funding target in 2045 still falls short of full funding. Illinois provides a clear example of the impact that poor contribution policies and behavior can have on a plan’s fiscal position, and how a forward-looking metric can reveal it: Despite paying more than 16 percent of the state’s own-source revenue in pension contributions, Illinois would still need to contribute an additional 20 percent of payroll to avoid falling below the net amortization benchmark.
Net amortization can also reveal state systems that are making consistent progress in repairing their retirement system’s fiscal health. West Virginia had a funded ratio of 42 percent in 2001, the lowest among the 50 states by a substantial margin. However, the state was also committed to following a funding policy that was sufficient to make progress toward paying down its pension debt. As a result, West Virginia’s funded status has increased 37 percentage points since 2001 to 79 percent funded in 2017, and the state has had positive amortization for the past several years. In fact, West Virginia exceeded the net amortization benchmark by 7 percent of payroll between 2015 and 2017.
The data in this brief are presented at the state level, but there can be a lot of variance at a plan level within a state. Kentucky is a good example of how two retirement systems in one state can be on very different trajectories.
Kentucky’s retirement systems have consistently had one of the lowest funded ratios of any state. However, the pension plans for state employees there reported positive amortization for the first time in 2017—the result of the state making the full actuarial contribution as required by reforms it made in 2013, additional contribution increases resulting from more recent changes to plan assumptions, and appropriations to make additional contributions in 2017 above the actuarial contribution rate.9 These factors led to the three plans covering state employees exceeding the net amortization benchmark, meaning that if contributions and plan assumptions hold, the funding gap will shrink over time.
This measure tells a different story for the Kentucky Teachers’ Retirement System. Although contributions to that plan doubled from 2016 to 2017, the plan still fell short of the net amortization benchmark. Additional state payments totaling 36 percent of payroll would be needed to meet the minimum contribution threshold.
Operating cash flow ratio reveals five states at risk of declining assets under current policies
The funded ratio and net pension liability are point-in-time estimates of the fiscal health of a pension plan, and net amortization measures whether total contributions are sufficient to reduce unfunded liabilities if all actuarial assumptions—including expected investment returns—are met.
In practice, however, actuarial assumptions are not always met. Given the volatility of market returns, it is important to also understand how dependent state pension plans are on their investment performance and evaluate the risk of long-term asset declines and insolvency. For this purpose, Pew assesses the ratio of operating cash flow to assets, which measures the minimum investment return necessary to keep asset levels steady from year to year.10
Operating cash flow measures the difference between cash coming in to state pension plans—primarily through employer and employee contributions—and cash flowing out in the form of benefit payments. Dividing that difference by the value of plan assets provides a benchmark for the rate of return required to keep plan assets from declining. State pension funds typically exhibit negative operating cash flow, which on average has moved from approximately minus 1.9 percent in 2000 to minus 3.2 percent in 2017. That means that state pension plans are now much more dependent on investment performance to keep assets from declining than they were at the turn of the century and therefore increasingly more vulnerable to market volatility.

The operating cash flow ratio is particularly useful in highlighting plans that are most at risk of fiscal distress. For example, New Jersey, Rhode Island, Oregon, Colorado, and Ohio had operating cash flow ratios below minus 5 percent in 2017. The asset levels of these states will drop if investment returns fall below 5 percent, a likely downside scenario. A continued operating cash flow ratio below minus 5 percent thus represents an early warning sign of potential fiscal distress and a substantial risk of insolvency over time if policies are not enacted to mitigate it.
In some cases, projections can reveal an expected turnaround in cash flow without policy change. Rhode Island’s Employee Retirement System’s actuarial valuations include 10-year operating cash flow projections that show a rebound from minus 5 percent in 2017 to minus 2.2 percent in 2028.11
But more commonly, low cash flow ratios are a signal that contribution policies should be strengthened. New Jersey plans to steadily increase pension funding to full actuarial contributions over the next four years. If the state is successful in doing so, its operating cash flow metric will improve. A stress test analysis conducted for the Colorado Public Employees’ Retirement Association found a risk of future negative cash flow depleting plan assets under current policy—culminating in a 1 in 4 chance of effective insolvency.12 This result prompted a reform package in 2018 intended to share cost increases among employers (through increased contributions), active employees (also through increased contributions), and retirees (through reduced COLAs). Policymakers also approved the continued use of stress testing to provide an early warning system, as well as risk management tools that automatically reduce benefits and increase employee contributions in the case of a future funding crisis.
Ohio’s response was limited to reducing employee benefits with suspended COLAs for active and retired teachers. Policymakers in Oregon reduced COLAs for current and future retirees in 2013. However, courts struck down the reduction in retiree COLAs, and the state has not subsequently made substantial changes.
Conclusion
Even after nine years of economic recovery, most state pension plans are not equipped to face the next downturn. Policymakers have not taken advantage of strong investment markets to make progress on closing the pension funding gap, which remains at historically high levels as a share of GDP.
The gap between the states with the worst-funded plans and those with the best-funded plans has continued to grow, and forward-looking measures—such as net amortization and operating cash flow—suggest that states with the lowest-performing plans can serve as a warning of the consequences of unsustainable pension policies. On the other hand, those with well-funded plans—such as Wisconsin, South Dakota, and Tennessee—can be examples for policymakers struggling to find a fiscally sustainable approach to providing retirement security; all three have well-funded retirement systems with the demonstrated ability to successfully weather market volatility and downturns while providing a secure retirement for public workers.
Almost every state has made some change to pension policy since the recession, including strengthening funding policies, adopting more conservative assumptions, increasing employee contributions, changing the benefit design for new hires, reducing benefits for current employees and retirees, strengthening governance, and improving transparency. Adopting some of these changes could potentially turn around distressed state pension plans in states such as Connecticut if policymakers maintain fiscal discipline as well. Actuarial data combined with metrics such as net amortization and operating cash flow help policymakers assess the adequacy of past reforms and the potential need for future changes, although ultimately policymakers and stakeholders will be the ones who need to navigate the tradeoffs between costs, risk, and benefits for workers and retirees.
Appendix A: Methodology
All figures presented are as reported in public documents or as provided by plan officials. The main data sources used were the comprehensive annual financial reports produced by each state and pension plan, actuarial reports and valuations, and other state documents that disclose financial details about public employment retirement systems. Pew collected data for more than 230 pension plans.
Pew shared the collected data with plan officials to give them an opportunity to review them and to provide additional information. This feedback was incorporated into the data presented in this brief.
Pew assigns funding data to a year based on the valuation period, rather than when the data are reported. Because of lags in valuation for many state pension plans, only partial 2018 data were available, and fiscal 2017 is the most recent year for which comprehensive data were available for all 50 states. Data on Tennessee aggregate political subdivisions were not available for fiscal 2017, so data were rolled forward from 2016. Data on a subset of California local governments participating in CalPERS were not available in aggregate and were not included in our data.
Each state retirement system uses different key assumptions and methods in presenting its financial information. Pew made no adjustments or changes to the presentation of aggregate state asset or liability data for this brief. Assumptions underlying each state’s funding data include the assumed rate of return on investments and estimates of employees’ life spans, retirement ages, salary growth, marriage rates, retention rates, and other demographic characteristics.
Appendix B: State data, 2017

Appendix C: Net amortization details, 2017

Appendix D: Details of changes to net pension liability, 2017

Appendix E: Debt drivers
States’ improved fiscal position in 2017 was driven by strong investment returns—12 percent for those reporting on a fiscal year ending June 30—that exceeded plan assumptions. On their own, investment returns lowered the cumulative funding gap by more than $133 billion, although this reduction was offset by changes in assumptions and insufficient contributions. Strong performance continued through the following fiscal year ending June 30, 2018, which will further reduce reported pension debt for state pension plans. However, weak financial markets in the third and fourth quarters of 2018 more than erased those gains.
States cannot rely on investment income alone to chip away at their accumulated pension debt. Pew has collected annual financial data on state-run pension systems since before the recession. But even after nine years of economic recovery, states have made limited progress in paying down pension debt. In fact, in the decade between 2007 and 2017, the shortfall between actual contributions to state pension plans and minimum actuarial funding standards was more than $190 billion.13
The change in aggregate unfunded liabilities also reflects a continued reduction in plans’ assumptions about expected returns: The median plan had an expected return of 7.15 percent in 2017 compared to 7.5 percent in 2016. The lower assumed rates of return, along with other changes to actuarial assumptions, increased the reported liability by $37 billion. The trend toward lower investment assumptions is consistent with observations by experts, who forecast lower-than-historical returns of about 6.5 percent due to expectations of lower economic growth and persistent low interest rates. As such, this brief provides supplemental analysis examining state pension funding using a 6.5 percent assumed rate of return in addition to plans’ assumed rates.
Other factors, including demographic experience such as changes in mortality assumptions and the effect of benefit changes, served to lower net pension liability by more than $6 billion in 2017. The biggest change of this type was in Ohio, where the elimination of COLAs for current and retired teachers reduced reported liabilities by $12 billion. Since 2007, nearly every state has made some change to benefits by changing plan design for new hires, increasing employee contributions, or making cuts to COLAs for active employees and retirees.
Appendix F: Net amortization benchmark
The benchmark is calculated by taking the sum of service cost (the actuarial value of the benefits earned in 2017, also called normal cost) and interest on the net pension liability at the beginning of the year (each pension plan’s total pension liability and the net pension liability both grow annually at the plan’s assumed rate of return) and subtracting employee contributions. Employer and employee contributions are adjusted to reflect expected interest. After subtracting the $40 billion contributed by workers nationwide in 2017 (including interest), employers would have needed to contribute $127 billion to meet the net amortization benchmark to keep pension debt from growing. To actually make progress on closing the funding gap, states would have to exceed the contribution benchmark on a consistent basis.
Endnotes
- When discussing the employer contribution rate, Pew presents the rate either as a percent of the pension system’s payroll for covered employees, which normalizes employer costs to allow for comparisons among states, or as a percent of own-source revenue, a proxy for state revenue, to provide a picture of the impact of pension costs on the state budget.
- The decrease resulted from an asset growth of $239 billion from 2016 to 2017 while state pension liabilities grew by only $161 billion over the same period. Pew collects data on assets (plan net position), liabilities (total pension liability), and pension debt (net pension liability) for each pension plan covered in its analysis from the Schedule of Changes to Net Pension Liability reported in state and pension plan Comprehensive Annual Financial Reports.
- Based on Federal Reserve data on state and local defined benefit pension plans.
- Changing accounting standards in 2014 led to states’ changing the information disclosed in state and pension plan financial reports. For 2013 and earlier years, we use the Actuarial Required Contribution as our benchmark to assess contribution policy. For 2014 and later years, we use the Net Amortization Benchmark.
- For more detail of WRS’ annuity adjustments for retirees, please see https://etf.wi.gov/retirement/planning-retirement/annuity-payments-and-adjustments.
- According to the National Association of State Retirement Administrators, 18 states have made changes to COLAs for current retirees and another seven did the same for current employees since 2009. These changes, some of which were litigated in courts, were one of the few ways that states were able to reduce current liabilities to plan participants. For more information, see https://www.nasra.org/colabrief.
- A 3.82 percent return is the plan’s 25th percentile expected investment return over 15 years. Under this scenario, plan retirees would see a reduction in the maximum COLA from the current 2.03 percent to 0.85 percent over five years. Alternatively, if returns are at the 75th percentile of expected returns over the same period, the maximum SDRS COLA would increase to the plan’s 3.5 percent cap and the funded ratio would be 112 percent at the end of the period.
- For a more detailed discussion of net amortization, see Appendix F. See, also, The Pew Charitable Trusts, “The State Pension Funding Gap: 2015,” https://www.pewtrusts.org/en/research-and-analysis/issue-briefs/2017/04/the-state-pension-funding-gap-2015.
- The 2013 reforms required the state to make the full actuarial contribution starting with the budget for the 2015 and 2016 fiscal years. As of 2017, the Kentucky Employee Retirement System Non-Hazardous plan and the State Police Retirement System assumed 5.25 percent returns and the Kentucky Employee Retirement System Hazardous plan used a 6.25 percent return assumption. The Kentucky state budget for fiscal 2017 and 2018 included appropriations of $98.2 million and $87.6 million, respectively, to provide additional funds to help amortize unfunded liabilities.
- For an introduction to the operating cash flow ratio, see The Pew Charitable Trusts, “The State Pension Funding Gap: 2016” (2018), https://www.pewtrusts.org/en/research-and-analysis/issue-briefs/2018/04/the-state-pension-funding-gap-2016.
- Calculated from ERSI 2017 Valuation, Table 3C.
- Colorado Public Employees’ Retirement Association, “Sensitivity Analysis of Colorado’s Public Employees’ Retirement Association Hybrid Defined Benefit Plan Actuarial Assumptions” (2015), https://www.copera.org/sites/default/files/documents/ptastudy.pdf.
- Accounting standards changed in 2014. From 2007 to 2013, the shortfall is calculated between the actuarial recommended contribution and actual employer contributions. From 2014 to 2017, the shortfall represents the gap between the net amortization benchmark and employer contributions.


America’s Overdose Crisis
Sign up for our five-email course explaining the overdose crisis in America, the state of treatment access, and ways to improve care
Sign up
State Retirement Fiscal Health and Funding Discipline

The State Pension Funding Gap: 2016


Legal Protections for State Pension and Retiree Health Benefits
ADDITIONAL RESOURCES

Fact Sheet

Podcast