Do Limits on Family Assets Affect Participation in, Costs of TANF?
Restricting holdings has minimal impact on program caseloads, expenses
 © Shutterstock
Overview
States and the federal government coordinate to provide assistance to economically vulnerable households through a range of programs, including Temporary Assistance for Needy Families (TANF) and the Supplemental Nutrition Assistance Program (SNAP), formerly known as food stamps. States administer these programs independently, providing welfare-enhancing benefits such as cash and in-kind transfers, informational pamphlets, and classes, and the federal government provides the majority of the funding through block grants. Within the general parameters set by the federal government, states are able to set broad eligibility guidelines, and specific rules vary substantially across states and even within programs.
To qualify for TANF and SNAP, families in many states must prove, among other criteria, that their income and assets do not exceed state or federal levels. These asset limits are caps on the amount of cash, savings, or material property that a family can hold when applying. In the case of TANF, states often set different limits for people applying for assistance (applicant asset limit) and for those who are already receiving benefits (recipient asset limit). Some states also vary their asset thresholds depending on the household composition, such as the presence of an elderly or disabled person in the home, and many exempt certain assets, including vehicles, houses, retirement savings accounts, or individual development accounts.
Experts, advocates, and policymakers have long debated the merits and effectiveness of these asset limits, particularly as they relate to TANF.1 Some advocates argue that imposing asset limits harms families attempting to gain financial security, while others maintain that people with substantial assets should not qualify for government assistance. Within this debate is an empirical question of how removing the asset limits would affect individual recipients and states. Would recipients save more? Would government agencies be overwhelmed with more caseloads? Might the reduced paperwork yield savings?
The Pew Charitable Trusts conducted original research to examine the second of these questions: How would modifying TANF asset limits affect states’ caseloads and costs? This brief captures the results of that research, which looked at data from 2000 through 2014 and tracked the trends in TANF caseloads and spending and documented what happened in individual states when asset thresholds changed. Key findings include:
- Independent of asset limits, TANF enrollment has significantly declined since 2000. TANF caseloads decreased by more than 38 percent between 2000 and 2014 with 44 states and the District of Columbia experiencing net declines. Seven of those states removed their asset threshold. Among the six states where caseloads increased, just one eliminated its limit.
- Among the seven states that removed their TANF asset limits between 2000 and 2014, there were no statistically significant increases in the number of TANF recipients.2 Louisiana saw the number of recipients per capita plummet by 57 percent after removing its asset limit,3 while Ohio, which removed its threshold before 2000, saw its caseload drop by 50 percent. Changes in state thresholds have not affected the overall nationwide decline in caseloads.
- Raising or eliminating asset limits does not affect the number of monthly applicants. After controlling for a state’s unemployment, population, and other characteristics,4 the level of the asset limit does not affect the number of applications a state receives. Conversely, an increase in unemployment is correlated with a rise in the expected number of applications. Together, these findings suggest that an individual’s decision to seek assistance is most likely linked to conditions within the household rather than the characteristics of the program.
- States that change their asset limits from low ($2,500 or less) to moderate ($3,000 to $9,000) or eliminate them see a decrease in their administrative costs. In particular, among states with moderate asset limits and an exemption for at least one vehicle, administrative expenditures were about 2 percent lower than those in states with low thresholds.
A history of TANF and asset limits
In 1996, Congress enacted the Personal Responsibility and Work Opportunity Reconciliation Act, commonly referred to as welfare reform. The law replaced Aid to Families With Dependent Children (AFDC), a federal public assistance program without time limits on receipt of cash assistance, with TANF, which requires that recipients engage in work and imposes a five-year lifetime cap on benefits.
Before welfare reform, states had less power to shape welfare programs and were required to contribute a greater share of funding than they are for TANF.5 Under the 1996 law, the federal government established a $16.5 billion block grant as the primary source of TANF funding.6 To retain eligibility for the block grant’s full value, states were required to maintain at least 75 percent of their AFDC spending levels (referred to as maintenance of effort, or MOE, funds). The TANF block grant has not increased since its inception in 1996. With neither state MOE contributions nor the block grant indexed to inflation, TANF funding is shrinking year over year.7
Asset limits help states ensure that scarce resources are directed to families they deem are the most financially insecure. However, this sorting can have unintended consequences for recipients and for states. If the asset threshold is too low, applicants who could benefit from keeping liquid savings may not qualify for the program unless they spend down resources before applying for assistance. Such divestment may result in families requiring public assistance longer while they rebuild their safety net.
Low asset thresholds can result in delayed enrollment and premature removal from TANF, both of which can affect caseloads. Low applicant limits reduce the number of eligible families, cutting caseloads in the short run, but low recipient thresholds may increase caseloads because families may save enough to lose benefits before they are able to establish financial stability, potentially causing them to re-enroll, in some cases repeatedly.
When asset limits create this cycle of gained and lost eligibility, they may affect administrative costs. States must unravel the complex financial lives of low-income families to verify that applicants and recipients have limited or no assets, which can be costly and time-consuming,8 and as households churn in and out of the program, the costs of repeated processing mount.
How Do Asset Limits Contribute to Program Churn?
Means-tested public assistance programs require households to verify income and assets during the application process, periodically while accessing benefits, and following any event that alters their income or asset levels. While recurring verification is necessary to ensure continued proper distribution of benefits to families in need, the process may also result in program recipients being deemed ineligible for services and losing access to their benefits.
There are many reasons why a family could become disqualified, such as missing income or asset documentation, missed appointments with a caseworker, or increased income or savings. However, a family’s increased savings level may be due to funds that are transitory. For example, program recipients might receive a lump-sum student loan disbursement, a security deposit return when they move, a tax refund such as the earned income tax credit, an insurance adjustment, or an unexpected overtime or bonus payment from their employer. While each of these may increase a family’s asset level, the savings in most cases are temporary9 and are likely to be spent in short order. However, these short-run increases may cause a needy family to be removed from the program because on paper it has greater assets than are allowed. These families may reapply—in many states within 30 days of the disqualification—creating an on-again, off-again relationship that is inefficient and expensive for state agencies that have to repeatedly process those applications and verify assets.
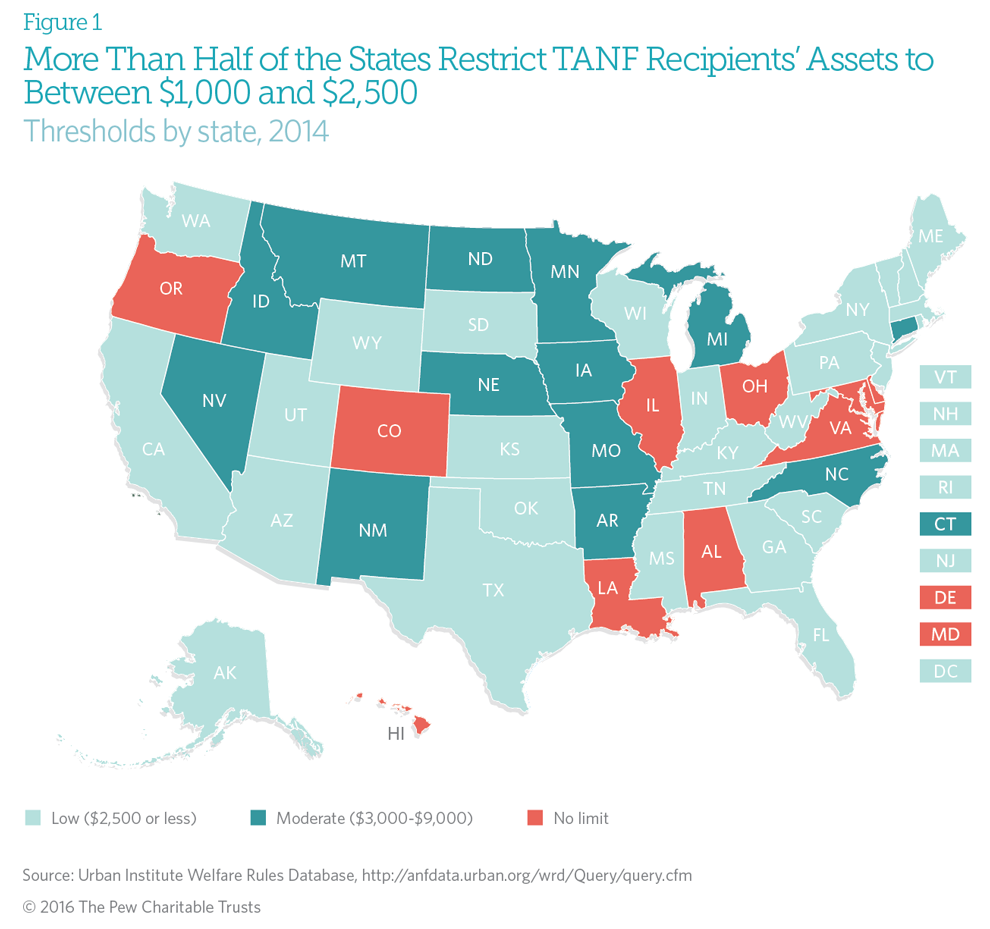
States’ asset thresholds range from $1,000 to $10,000.10 (See Figure 1.) More than half (55 percent) of states have a limit of $2,500 or less, which is defined as a low limit; eight do not use asset thresholds for TANF,11 and the remaining states have a moderate asset limit between $3,000 and $9,000. Only Texas lowered its limit between 2000 and 2014, from $2,000 to $1,000.
Independent of asset limits, TANF enrollment has significantly declined since 2000
Congressional action has consistently encouraged states to reduce overall TANF caseloads. Between 1996 and 2004, various incentive programs sought to accomplish this or to increase enrollment in other programs, such as food stamps and the State Children’s Health Insurance Program.12 Since 1996, the government has allowed states to reduce their TANF MOE obligations by 5 percent by meeting performance goals for work participation.
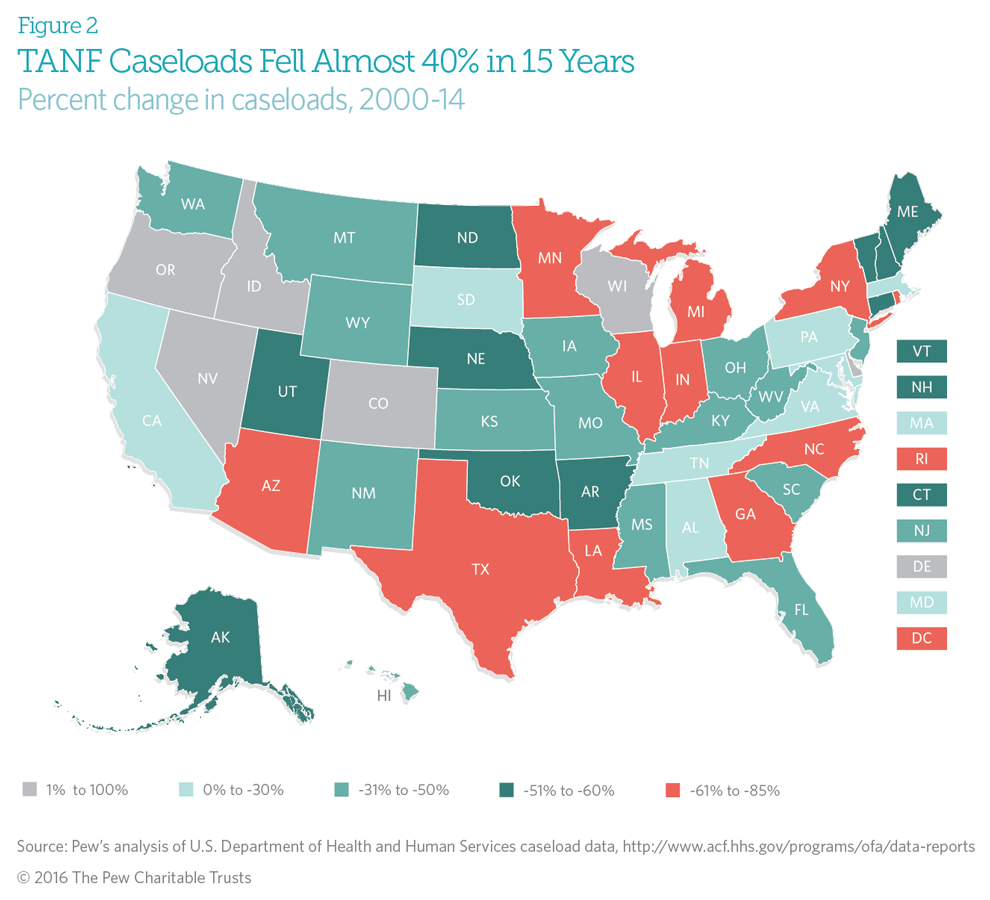
As a result, TANF caseloads have declined over the past two decades, dropping by more than 38 percent nationwide since 2000. Among the 44 states and the District of Columbia that experienced caseload reductions, the combined decline was 50 percent on average, or about 53,000 monthly recipients.13 Seven states—Alabama, Colorado, Hawaii, Illinois, Louisiana, Maryland, and Virginia—removed their asset limits during this period. Between 2000 and 2014, just six states—Colorado, Delaware, Idaho, Nevada, Oregon, and Wisconsin—had an increase in TANF caseloads; of those, only Colorado had fully removed its asset threshold. (See Figure 2.)
Unlike TANF, SNAP caseloads have increased in states that removed their asset limits for food assistance.14 Since 2000, about 35 states eliminated those thresholds; as a result, they have been able to offer assistance to more families.
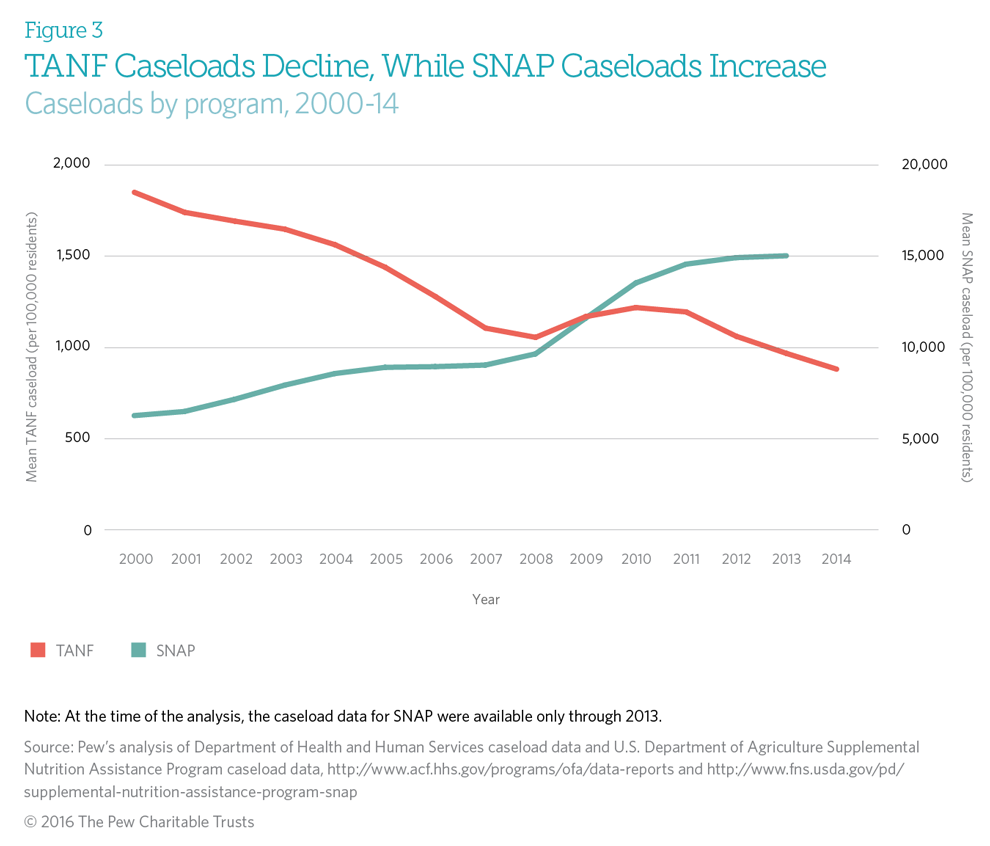
Figure 3 shows the average monthly caseloads for SNAP and TANF between 2000 and 2014. As noted above, the number of people receiving TANF has significantly declined since 2000, but participation in SNAP has steadily increased in that period. This seems to suggest that removing SNAP asset limits played a significant role in the program’s rising caseloads. After controlling for factors such as unemployment and the Great Recession, however, this analysis found that the effect was economically insignificant: States without a SNAP asset threshold had an average of 407 more recipients per 100,000 residents compared with states that did have an asset limit.15 In comparison, a 1 percentage point increase in unemployment resulted in an average of 2,325 additional recipients per 100,000 residents.16
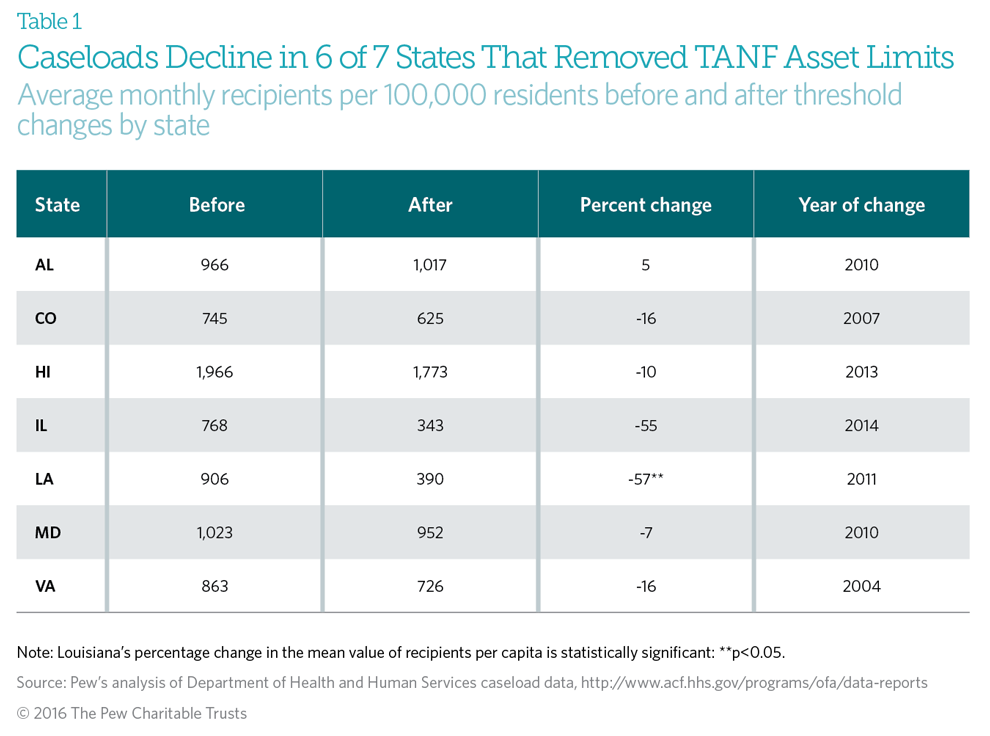
Although TANF caseloads have been declining nationwide, this analysis sought to determine whether states that raised their asset thresholds experienced the same trend as states that did not. The seven states that removed their asset limits between 2000 and 2014 experienced no statistically significant increases in the number of benefit recipients per 100,000 residents during this period. In fact, Louisiana saw the per capita number of recipients plummet by 57 percent. (See Table 1.) Ohio, which eliminated its asset limit before 2000, also experienced a 50 percent decline in caseloads in the same period. Changes in state thresholds have not affected the overall nationwide trend in caseloads.
Asset limit rules vary significantly across states, yet comparing per capita monthly caseloads across these various regimes reveals only small differences in average caseloads. Pew developed a statistical model to test whether a relationship exists between caseloads and applicant and recipient asset limits, after controlling for each state’s relevant economic factors.17 The analysis suggests that changing from a low-asset threshold ($2,500 and under) to a moderate one (between $3,000 and $9,000) would, on average, result in an increase of 98 monthly recipients.18 For a change from a moderate limit to no limit, the model identified no statistically significant impact on caseloads.
If removing asset limits were related to increasing the number of program recipients, it would be reasonable to assume that after removing an asset limit, a state would also see an increase in both the number of applications submitted and the rate of acceptances. However, this analysis found that states that raised or removed their thresholds saw neither a change in the number of applications received nor any statistically significant difference in acceptance rates. A rise in unemployment, however, was positively correlated with an increase in the average number of applications, suggesting that the decision to seek assistance is more closely linked to household financial conditions than to the characteristics of an assistance program.
Importantly, this analysis does not imply causality, and it would be incorrect to assume that changing from one asset limit regime to another is causing the increase. Rather, the findings show a strong relationship between moderate asset limits and caseloads and no relationship between eliminating asset thresholds and the number of applications or rate of acceptance.
The role of vehicles in asset limits
When counting assets to verify program eligibility, some states take into account the value of an applicant’s or recipient’s vehicle. States typically adopt one of three policy options, exempting all vehicles, one vehicle per household or licensed driver, or a portion of the vehicle’s value or equity from the asset limit.
The interaction between asset limits and vehicle exemption affects caseloads. This analysis indicates that, holding all other factors constant, states that eliminate the applicant asset limit, including vehicle tests, would have, on average, 172 fewer TANF recipients per 100,000 residents compared with states that do not.19 Likewise, states that eliminate recipient asset limits, including vehicles, would also decrease their monthly caseloads by 167 recipients on average compared with states that did not.
By removing or raising asset limits, states make TANF accessible to a broader population of families, so they reasonably might expect to see a commensurate increase in caseloads. But in fact, the growth in caseloads identified in this analysis was de minimis when compared with other factors, particularly unemployment, and in no case did eliminating the asset limit reverse the overall decline in caseloads. This effectively means that by adopting more liberal limits and vehicle exemptions, states can offer TANF benefits to more people without experiencing meaningful caseload increases.
States that change their asset limits from low ($2,500 or less) to moderate ($3,000-$9,000) or eliminate them see a decrease in their administrative costs
Caseworkers must devote a portion of their time to screen applicants and certify that their assets are below the state’s threshold, which necessarily results in administrative costs to state governments. Similarly, the asset recertification process, which occurs periodically to ensure that participants remain eligible for TANF, requires states to expend resources to repeatedly verify recipients’ assets.
Therefore, eliminating asset limits could reduce administrative burdens and costs. To determine what effect changes to asset limits may have on costs, this analysis measured the impact of various thresholds and vehicle exemptions on five categories of TANF expenditures: noncash assistance, cash assistance, administrative costs, systems costs, and total spending. (See the methodology for definitions of these expenditure types.)
The analysis found that neither the absence of an applicant or recipient asset limit nor the exemption of at least one vehicle had a statistically significant effect on total TANF expenditures.20 By contrast, factors such as unemployment, prior-year caseloads and expenditures, and the maximum TANF benefit for a family of three were all significant contributors to total TANF expenditures. Further, in the context of TANF cash assistance programs, the analysis found no statistically significant relationship between asset limits and expenditures and showed that states that exempted at least one vehicle had the same level of expenditures as those that exempted only a portion of the vehicle’s value.
When it comes to administrative costs, applicant limits, recipient limits, and vehicle exemptions each contribute differently—but because states implement their overall asset limit regimes holistically, this analysis interpreted only the combined effect of the components employed by each state. Administrative expenditures were about 2 percent lower in states that adopted moderate asset limits and exempted at least one vehicle than in those that did not exempt a vehicle.
Conclusion
Federal policymakers introduced asset limits into public assistance programs with the intent of supporting family self-sufficiency and preserving safety net resources for the most financially vulnerable. But in the decades since welfare reform was enacted, many have questioned the merits of this strategy. This analysis seeks to inform this important policy question by examining the effects on program caseloads and administrative costs of raising or eliminating asset limits.
The findings clearly show that increasing or removing asset thresholds for state TANF programs has little effect on the number of applications for assistance, application acceptance rates, or overall caseloads. States that raised or eliminated their asset limits saw little difference in any of these metrics compared with states that kept their thresholds low. By comparison, each state’s characteristics and economic landscape had a significant impact on caseloads. Further, the data reveal that altering asset limits did meaningfully reduce administrative costs.
In summary, maintaining an asset limit in TANF returned no advantage to states in terms of either caseload burdens or costs, leaving open the question of whether the thresholds harm families by making them less likely to save or by forcing them to spend down resources in order to qualify for benefits. Upcoming Pew research will examine that question, looking at the effect of asset limits on recipient savings and overall financial security.
Endnotes
- See, for example, Corporation for Enterprise Development, “Lifting Asset Limits Helps Families Save,” accessed May 3, 2016, http://cfed.org/assets/pdfs/Policy_Brief_Asset_Limits.pdf; and Maine.gov, “Maine DHHS Announces Asset Test for Food Stamps,” accessed May 3, 2016, http://www.maine.gov/tools/whatsnew/index.php?topic=Portal+News&id=657252&v=article-2015.
- Differences for six states were not statistically distinguishable from zero.
- Louisiana was the only state that had a change that was statistically different from zero. This change is unlikely to have been caused by or related to the removal of the asset threshold.
- The term “other characteristics” refers to a set of independent variables intended to control for the influence of: the size of the eligible population (percentage of foreign-born residents); macroeconomic factors (unemployment, Great Recession, percentage of population below 125 percent of the federal poverty line); the influence of party platforms on policy choices (legislative control); the size of the TANF subsidy for a family of three (maximum monthly TANF benefit for family of three); and prior-year policy (lagged TANF caseloads, lagged TANF expenditures).
- Alan Weil and Kenneth Finegold, eds., Welfare Reform: The Next Act (Washington: The Urban Institute Press, 2002): 225–46.
- U.S. Government Accountability Office, “Temporary Assistance for Needy Families: State Maintenance of Effort Requirements and Trends,” accessed Feb. 29, 2016, http://www.gao.gov/products/P00600.
- Under the TANF block grant rules, states can receive additional federal funding if they are ranked as high-performing. States earn a highperformance ranking by reducing the number of out-of-wedlock births while maintaining a low abortion rate and by having recipients leave TANF for work. High-performing states are rewarded with a funding bonus equivalent to 5 percent of their MOE. For more information, see Rebecca M. Blank, “Evaluating Welfare Reform in the United States,” Journal of Economic Literature 40, no. 4 (2002): 1105–66, http://dx.doi.org/10.1257/002205102762203576.
- Rebecca Vallas and Joe Valenti, “Asset Limits Are a Barrier to Economic Security and Mobility: Counterproductive Policy Deters Hardworking Americans From Savings and Ownership,” Center for American Progress (Sept. 10, 2014), https://www.scribd.com/document/239294663/Asset-Limits-Are-a-Barrier-to-Economic-Security-and-Mobility-Counterproductive-Policy-Deters-Hardworking-Americans-from-Savings-and-Ownership.
- Andrew Goodman-Bacon and Leslie McGranahan, “How Do EITC Recipients Spend Their Refunds?” Federal Reserve Bank of Chicago, accessed May 23, 2016, https://www.chicagofed.org/publications/economic-perspectives/2008/2qtr2008-part2-goodman-etal.
- Urban Institute, “Welfare Rules Databook,” accessed Feb. 22, 2016, http://anfdata.urban.org/wrd/databook.cfm. As of 2014, Georgia, Indiana, Missouri, New Hampshire, Oklahoma, Pennsylvania, Rhode Island, Texas, and Washington had in place a $1,000 asset limit on applicants.
- For the purpose of this paper, states with asset limits of $10,000 or above are considered to not have thresholds. Delaware has a $10,000 limit, so it is considered in this analysis to not have a limit. Oregon has a $2,500 asset limit for applicants but a $10,000 asset limit for recipients and so, for the purpose of this analysis, is treated as having no asset test for recipients and a low test for applicants.
- Predicting changes in expenditures given a change in asset limit policy is complicated by the strong financial inducements that TANF offers states to reduce their caseloads, because lower caseloads would in turn reduce expenditures across the board. In other words, distinguishing the effects of asset limits from those of the incentives would require a depth of study that is beyond the scope of this paper. The findings discussed here provide key insights into the impact of asset limits on program expenditures, but more research is needed to better understand that relationship and to determine whether a causal relationship exists. For more about TANF funding and incentive structures, please see Liz Schott, Ladonna Pavetti, and Ife Floyd, “How States Use Federal and State Funds Under the TANF Block Grant,” Center on Budget and Policy Priorities, accessed May 10, 2016, http://www.cbpp.org/research/family-income-support/how-states-use-federal-and-state-funds-under-the-tanf-block-grant; and R. Kent Weaver, “The Structure of the TANF Block Grant,” The Brookings Institution (April 2002), http://www.brookings.edu/research/papers/2002/04/welfare-weaver.
- This figure is based on the number of TANF recipients per 100,000 residents. In some cases, the nominal number of cases may have increased in a state even though the per capita number has decreased. Extensive literature tracks the decline of TANF caseloads after welfare reform in 1996. For instance, see James P. Ziliak et al., “Accounting for the Decline in AFDC Caseloads: Welfare Reform or the Economy?” Journal of Human Resources 35, no. 3 (2000): 570–86, http://econpapers.repec.org/RePEc:uwp:jhriss:v:35:y:2000:i:3:p:570-586; and James P. Ziliak, “Social Policy and the Macro-Economy: What Drives Welfare Caseloads in the U.S.?” Social Policy and Society 2, no. 2 (2003): 133– 42, http://journals.cambridge.org/action/displayAbstract?fromPage=online&aid=151301.
- In contrast to its approach to TANF, the federal government promoted SNAP during the Great Recession, including providing increased funding through the American Recovery and Reinvestment Act and waiving a three-month limit for able-bodied adults. Several studies have documented the increase in SNAP caseloads after welfare reform and the recent recession. See James P. Ziliak, Craig Gundersen, and David N. Figlio, “Food Stamp Caseloads Over the Business Cycle,” Southern Economic Journal 69, no. 4 (2003): 903–19, https://ideas.repec.org/a/sej/ancoec/v694y2003p903-919.html; Constance Newman, Mark Prell, and Erik Scherpf, SNAP Eligibility and Participation Dynamics: The Roles of Policy and Economic Factors From 2004 to 2012, Agricultural and Applied Economics Association (2015); and Mark Edwards et al., “The Great Recession and SNAP Caseloads: A Tale of Two States,” Journal of Poverty 20, no. 3 (2016): 261–77, http://www.tandfonline.com/doi/full/10.1080/10875549.2015.1094770.
- The fixed-effect regression analysis was used to test whether SNAP applicant asset limits predicted a state’s caseload. The results of the regression indicate that the model explained 97 percent of the variance (R2=.979, F(9,50)=1826.32, p<.01). Dropping the SNAP asset limit resulted in a statistically significant increase in the expected caseload ( = 407.80, p<.001) when the other independent variables were held constant. We are 95 percent confident that the mean increase is between 205 and 610 cases per 100,000 residents. A 1 percent increase in a state’s unemployment resulted in a statistically significant increase in the expected caseload ( = 2324.98, p<.001) when the other independent variables were held constant. The researchers are 95 percent confident that the mean increase is between 2,002 and 2,647 cases per 100,000 residents.
- Ibid.
- To isolate the contributory effects of factors other than asset limits, Pew used a fixed-effect linear regression model. Outlier TANF caseload values were dropped from the regression analysis of asset limits and caseloads because single observations were having a disproportionate effect on the outcome of the models. See the methodology for more information.
- The fixed-effect regression analysis tested if either recipient or applicant asset limits significantly predicted a state’s caseload. The results of the regression indicate that the model explained 82 percent of the variance (R2=.818, F(12,49)=552.85, p<.01). Changing to a moderate applicant or recipient asset limit from a low asset limit resulted in a statistically significant increase in the expected caseload ( = 97.88, p<.001) when the other independent variables were held constant. The researchers are 95 percent confident that the mean increase is between 30.83 and 164.9 cases per 100,000 residents.
- The fixed-effect regression analysis tested whether the interaction of asset limits and vehicle exemption policies significantly predict a state’s caseload. The results indicate that the model explained 82 percent of the variance (R2=.819, F(14,49), p<.01). The interactive effect of eliminating the applicant asset limit and exempting at least one vehicle from asset testing resulted in a statistically significant decrease in a state’s average monthly caseload ( = -98.79, p<.001) when the other independent variables were held constant. The analysis finds with 95 percent confidence that the mean decrease is between -153.45 and -44.13 cases per 100,000 residents. The interactive effect of eliminating the recipient asset limit and exempting at least one vehicle from asset testing resulted in a statistically significant decrease in a state’s average monthly caseload ( = -172.02, p<.001) when the other independent variables were held constant. We are 95 percent confident that the mean decrease is between -269.94 and -74.10 cases per 100,000 residents.
- Although the regression coefficient is significant at a confidence level of .10, the confidence interval contains a value that in a practical sense is asymptotical to zero. Therefore, we are erring on the conservative side and holistically interpreting the coefficient as not significant.


ADDITIONAL RESOURCES

Fact Sheet

Podcast


