How Healthy Are Philadelphia Businesses Going Into Third Year of Pandemic?
Pew’s dashboard shows overall improved health, but also some trouble spots
Now in the third year of the pandemic, Philadelphia’s businesses overall are showing signs of improved financial health, increased hiring, and renewed entrepreneurial activity compared with the year and a half after the pandemic’s start, according to The Pew Charitable Trusts’ Philadelphia business and jobs dashboard. Since October 2021, the dashboard has provided monthly and quarterly snapshots of commercial credit, worksite openings, hiring, consumer spending, and other performance indicators broken down by business sector and ZIP code.
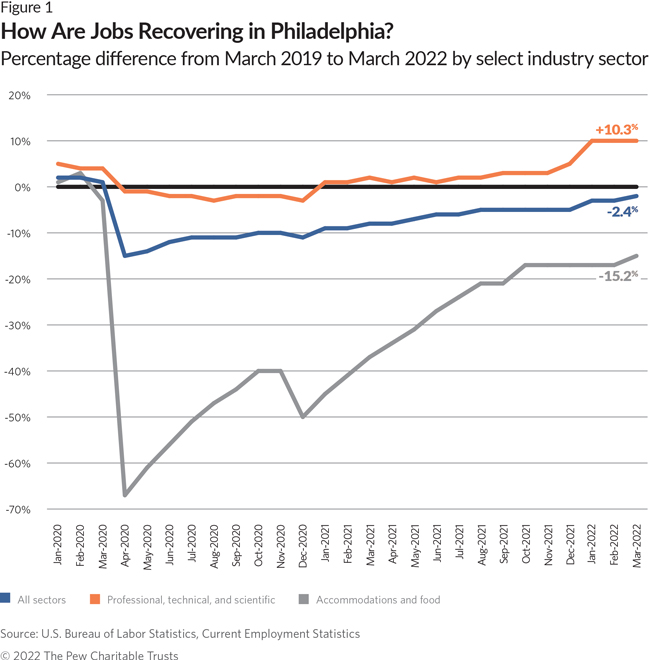
The number of filled jobs at private establishments had nearly returned to its pre-pandemic level in March, when the U.S. Bureau of Labor Statistics estimated a total of 717,400 jobs, just 2.4% short of March 2019. (Figure 1 shows the difference since the year before the pandemic caused widespread shutdowns in 2020.) The strongest job recovery, measured by percentage difference since the same month in 2019, came in the professional, technical, and scientific services sector, in which qualified people are in demand and much of the work can be done remotely. In that sector, the number of jobs had increased about 10% since the same month in 2019. On the opposite end, the restaurant and hotel sector remained furthest from recovery among all sectors, at 15.2% below its March 2019 employment.
Sales receipts recover
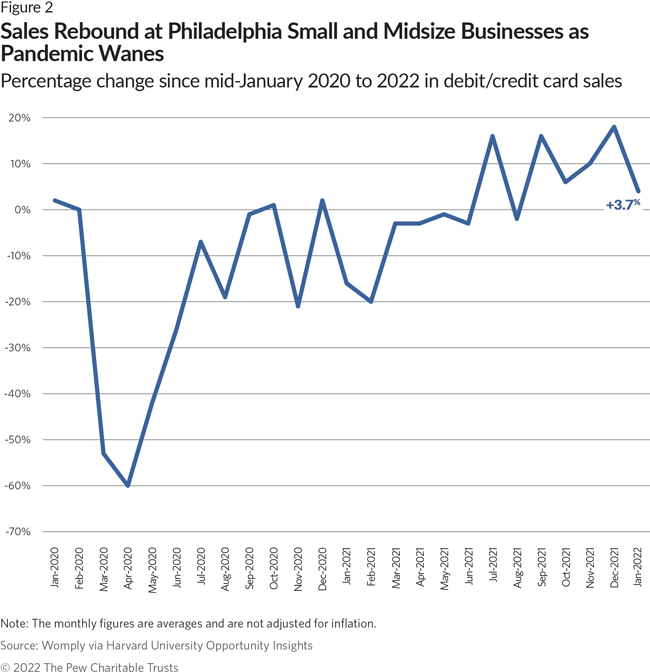
The first 15 months of the pandemic were tough times for many, though not all, of Philadelphia’s small and midsize businesses, whose overall average receipts were below 2019 levels. In July 2021, these businesses reached an important milestone and began exceeding their 2020 sales—as measured by debit, credit, and gift cards, excluding cash. Sales receipts by mid-January 2022, the latest available, exceeded mid-January 2020’s levels by 3.7%. (See Figure 2.)
Philadelphia consumers’ spending at small and midsize businesses online and in-person—both inside and outside the city—leapt early in the pandemic and has stayed mostly elevated since then (with some exceptions). According to Pew’s dashboard, consumer spending was nearly 33% higher last February than January 2020. Experts have attributed this demand to stimulus checks and savings accumulated during the pandemic as the expansion of e-commerce made it easier to shop anywhere.
Financial health near pre-pandemic levels
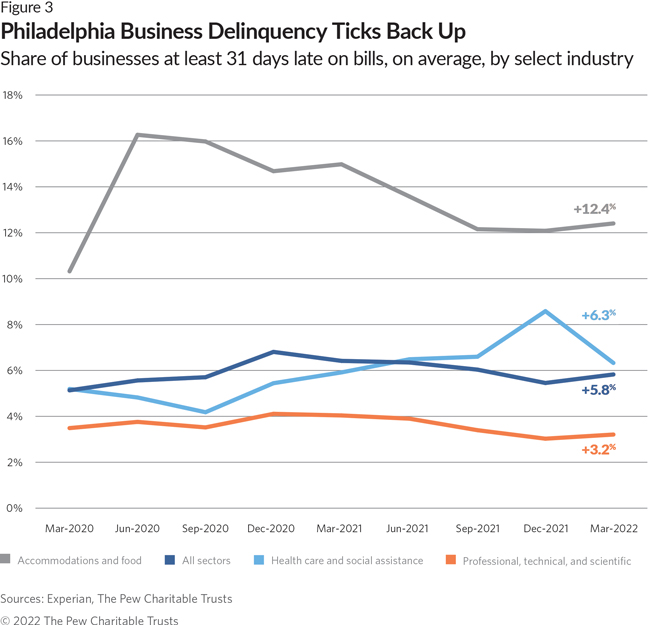
Financial health has improved for most, though not all, business sectors since early 2020, particularly in the past year. One key indication of that strength has been the declining share of businesses running seriously late on payments to creditors, which can be a warning sign of default. Over the past year, the share of businesses paying 31 days or more late had fallen nearly to pre-pandemic levels.
However, in March 2022, inflation was rising, supply chains were still clogged, and some sectors were facing labor issues, leading the share of businesses making late payments to tick back up. The delinquent share overall was still lower than it had been since late 2020, and the bump back up may prove to be an anomaly, although certain sectors—particularly food and accommodations—have been struggling all along, as shown in Figure 3.
The Pew analysis also shows an uptick in business delinquency from December to March in about half of Philadelphia’s ZIP codes, including eight areas where it reached pandemic-era high points. The latter areas, including 19111 (Lawndale), 19134 (Port Richmond), and 19144 (Germantown), are home to large minority populations and neighborhood commercial corridors.
Looking back on the past two years, James Johnson-Piett, founder of the business-development advisory firm Urbane, based in Philadelphia and New York City, likened COVID-19 to an earthquake and series of aftershocks. “At first, all businesses got hit and the weakest ones fell first. But it was the aftershocks that really hit people and changed things for a lot of businesses,” he said. “The hits were on capital, then labor, then supply chains, and now it’s inflation.”
Gain in number of workplaces
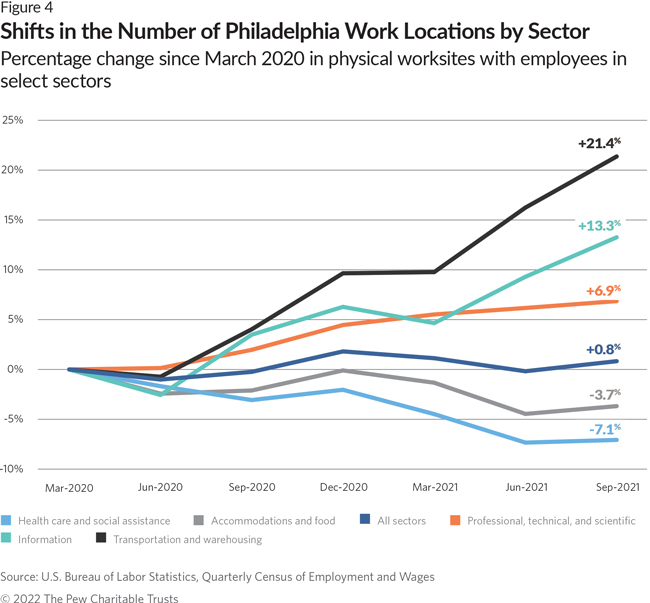
The COVID-19 outbreak brought an end, at least briefly, to several years of net increases in the number of small and midsize businesses, which had risen 5.3% from 2015 to 2018. Comprehensive pandemic-related rates of business shutdowns and startups aren’t known yet, but the dashboard’s worksite data does shed some light on the city’s entrepreneurial activity: From March 2020 to September 2021, the number of openings or expansions of physical places of work with employees outnumbered closings and contractions. That meant a 0.8% increase in establishments in that period.
Although lower than pre-pandemic levels, the slight growth during COVID-19’s harshest phase suggests how firms and entrepreneurs responded to shifting demand. The biggest increase in worksites was at IT firms within the professional-technical services sector and trucking services within the transportation sector. Meanwhile, the biggest net decline was in care facilities for children, the elderly, and the disabled, all within the health care and social assistance sector. (See Figure 4.)
Two years after the COVID-19 outbreak caused shutdowns nationwide, fewer Philadelphia businesses were running late on their bills in these most recent numbers. Sales receipts, employment, and worksite openings were rising, albeit slowly. Pew will continue to monitor business and job conditions with this publicly available dashboard tool as Philadelphia’s recovery continues. Readers can share their own observations by emailing us at: [email protected].
Elinor Haider is the director and Thomas Ginsberg is a senior officer with Pew’s Philadelphia research and policy initiative.
