Where States Get Their Money Will Shape Pandemic’s Fiscal Fallout
Latest data on revenue sources offers hints at challenges ahead for budgets

As the COVID-19 pandemic swept through the United States, economic shutdowns swiftly and unsparingly disrupted many of the ways that money flows into state budgets. States have lost revenue, for example, from income not withheld from furloughed workers’ paychecks, tolls not collected from traffic absent from state highways and bridges, and sales taxes not tacked on to bills for hotel rooms that have sat empty.
The full extent of the fiscal damage is not yet known, and aftershocks are likely to plague state budgets for years, even if no additional shutdowns become necessary. Individual states will feel different impacts depending on the specific mix of revenue they rely on to fund their budgets. The latest data from the U.S. Census Bureau on how states raise their tax dollars (fiscal year 2019) and where states get their money (fiscal 2018) offers clues about the characteristics of the challenges ahead.
Different mixes of tax dollars
Taxes make up about half the money that finances state governments and the services provided to residents; they are the largest revenue source in 44 states. States therefore will experience different degrees of budget stress depending on how COVID-19 affects their economies and mixes of tax sources.
For example, economies reliant on live entertainment and tourism were hit hard when businesses were shut down. Nevada lost about $2 million a day in gaming-related taxes while casinos were closed, and Hawaii blamed a steep drop in tourism tax dollars for a $250 million reduction in its revenue forecast for the fiscal year that ended June 30, according to news reports.
The pandemic dealt immediate blows to both of the largest sources of state tax revenue: levies on personal income, which account for 37.9% of total state tax revenue nationwide, and on general sales of goods and services, which generate 30.9%.
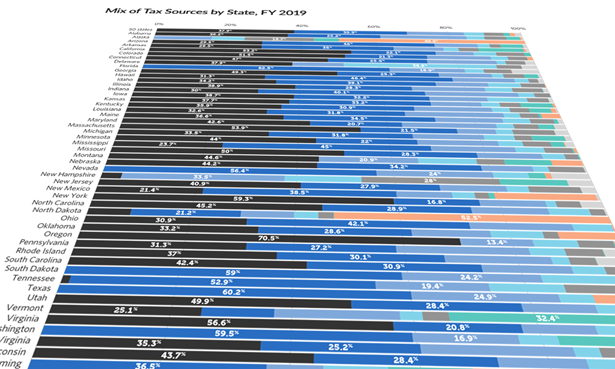
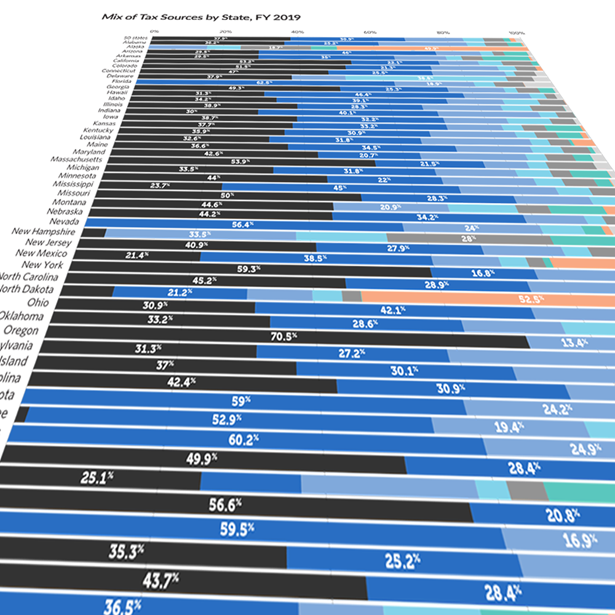
How States Raise Their Tax Dollars, FY 2019
Broad-based personal income taxes on wages and investment earnings were battered as unemployment zoomed higher this year than at any point during the 2007-09 recession and as the stock market plummeted; the latter has since nearly recovered. In 30 of the 41 states that impose them, personal income taxes generate more money than any other type of tax. The states most reliant on personal income taxes as a share of overall tax revenue are Oregon (70.5%), New York (59.3%), and Virginia (56.6%).
General sales tax revenue also was slammed when restaurants, bars, retail stores, and other businesses were shuttered and consumer spending fell sharply, starting in March. Typically, states can rely on sales taxes from day-to-day spending on goods such as food and clothing to be more stable than taxes tied to more volatile aspects of the economy. For example, levies on capital gains fluctuate with the stock market, and severance taxes shift with the price of oil. But the pandemic suddenly disrupted general sales tax receipts, the largest tax source in 15 of the 45 states that collect them. The states that rely most heavily on general sales taxes are Florida (62.5%), Texas (60.2%), and Washington (59.5%).
Few tax sources have been unscathed, however. For example, revenue from severance taxes on oil production and motor fuel taxes on gasoline have fallen because of a pullback in production, reduced demand from homebound consumers, and a significant decline in oil prices.
Other factors in states’ overall revenue
Besides taxes, which make up 48.8% of total state revenue, other major components are federal funds (32%), which tend to increase during a recession, and service charges (11.2%), which include sources such as public college tuition payments and highway tolls that have proved vulnerable in the pandemic. The distribution of—and reliance on—these revenue sources varies significantly by state.
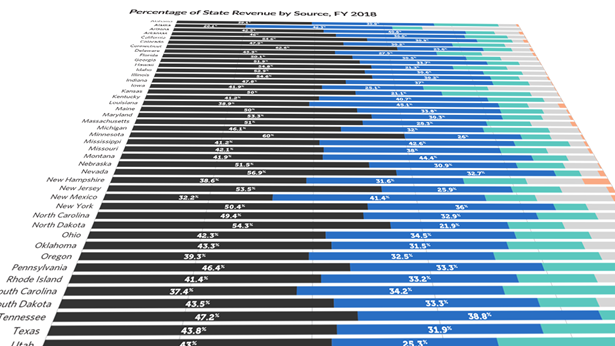
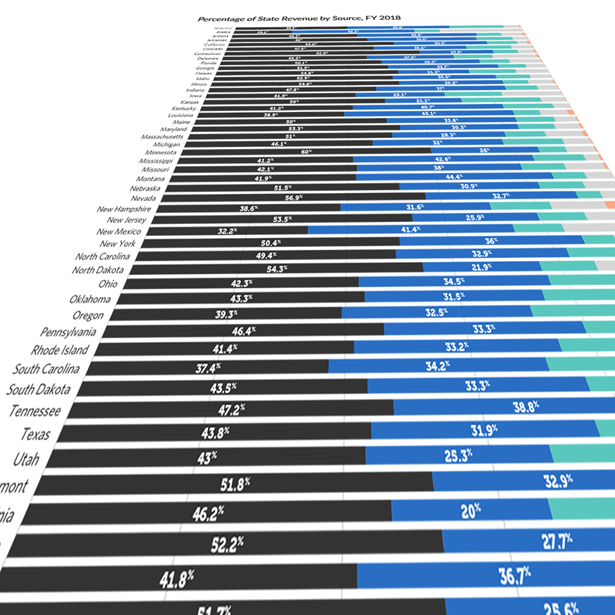
Where States Get Their Money, FY 2021
For 20 states, taxes make up at least half of their total revenue. Connecticut is most reliant on taxes, depending on them for 62.6% of total revenue, followed by Minnesota (60%) and Nevada (56.9%). Among these 20 states, seven receive at least half of their tax dollars from a single tax stream, and as a result, those specific taxes play an outsize role in each state’s fiscal picture. North Dakota, for example, derives 54.3% of its revenue from taxes, and 52.5% of that revenue comes from severance taxes, which fluctuate with the price and production of oil. Likewise, California, Massachusetts, and New York are particularly reliant on tax revenue in general and personal income taxes in particular; Florida, Nevada, and Washington similarly depend heavily on general sales taxes.
Pre-pandemic, federal funds were the greatest source of revenue in six states: Alaska (42.3%), Louisiana (45.1%), Mississippi (42.6%), Montana (44.4%), New Mexico (41.4%), and Wyoming (42.1%). The state governments least reliant on federal funds were Virginia (20%), Kansas (21.1%), and Hawaii (21.3%)
Since the current recession began in February, Congress has approved an extra $150 billion to help state and local governments fight the effects of the coronavirus, at least $50 billion in enhanced support for Medicaid, plus almost $80 billion for education, transportation, and other health programs. More aid for these governments is under consideration. In recent recessions, the federal share of state revenue rose as the federal government provided extra funding to help stabilize state budgets amid falling revenue.
States that receive a high share of revenue from the federal government are not insulated from budget shocks, however. They still are largely dependent on their own resources—primarily taxes—to finance their general fund budgets, which typically cover state costs for key services such as education, Medicaid, transportation, and public safety.
Barb Rosewicz is a project director, Melissa Maynard is a senior officer, and Joseph Fleming is a senior associate with The Pew Charitable Trusts’ state fiscal health initiative.


ADDITIONAL RESOURCES

Video

Fact Sheet