Wide Variation in Federal Defense Spending From State to State
Pentagon budget changes will affect each differently
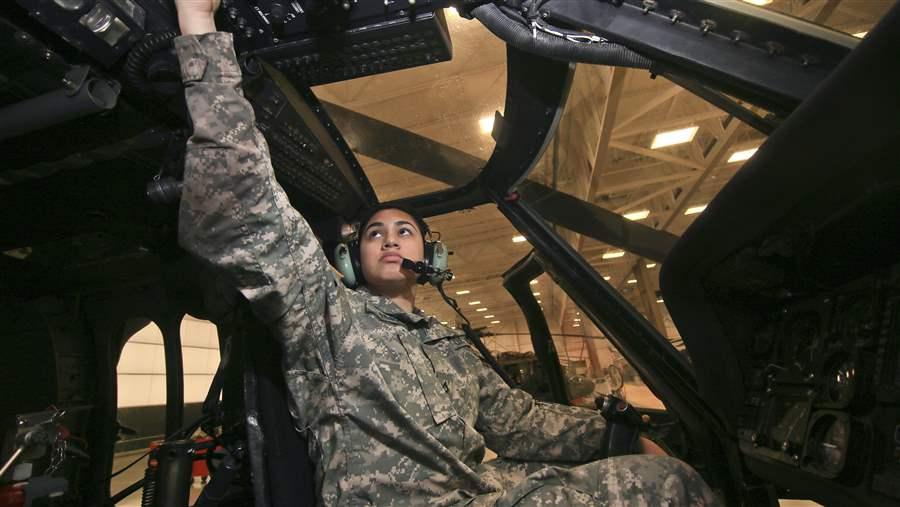
Army National Guard Pfc. Katherine Silva, on a UH-60L helicopter at Joint Base McGuire-Dix-Lakehurst, New Jersey.
Master Sgt. Matt Hecht/U.S. Air National Guard/DODThese data have been updated. For the latest research on this topic, please see Levels and Types of Federal Defense Spending Differ Across States.
The U.S. government spends defense dollars in every state through purchases of military equipment, wages for service members and civilians, pension payments, health care services, and grants to states. But the size and mix of those investments varies substantially across the states, so changes in defense spending will affect them differently, and the impacts will depend on which programs and operations are increased or cut. This analysis of defense spending in the states takes a comprehensive look beyond contracts and salaries to include retirement payments, nonretirement benefits, and grants.
In fiscal year 2015—the most recent year for which complete data are available—federal defense spending totaled $485 billion in the states and the District of Columbia, or $1,510 per person. Among the states, this ranged from $386 per capita in Michigan to $7,132 in Virginia. The District of Columbia received the highest amount of spending per capita at $10,413.
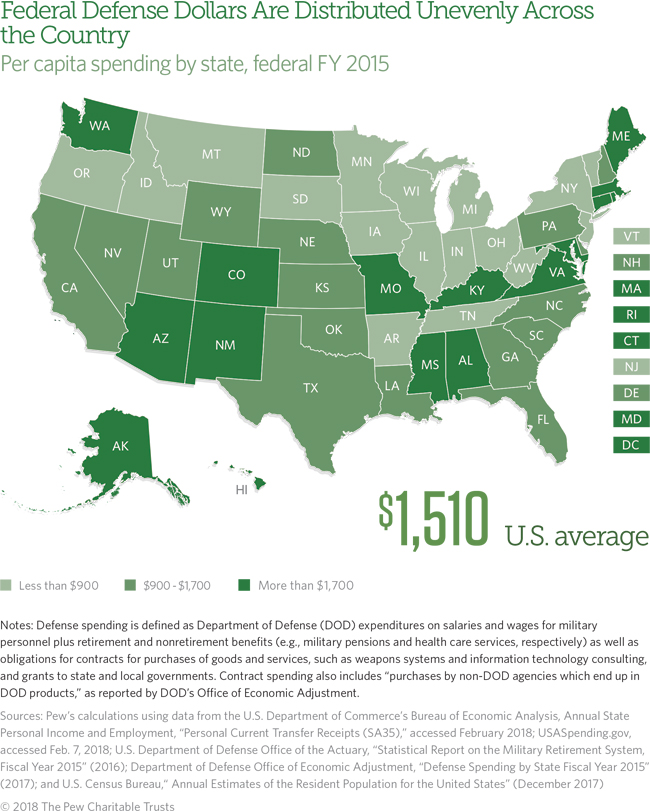
Defense spending falls into five major categories: contracts, salaries and wages, retirement benefits, nonretirement benefits, and grants (see below for more information on each). Because each state’s level and mix of defense spending is unique, the effect of a federal budget change will vary by state.
Notes: Defense spending is defined as Department of Defense (DOD) expenditures on salaries and wages for military personnel as well as retirement and nonretirement benefits (e.g., military pensions and healthcare services, respectively) and obligations for contracts for purchases of goods and services, such as weapons systems and information technology consulting, and grants to state and local governments. Contracts spending also includes “purchases by non-DOD agencies which end up in DOD products,” as reported by DOD’s Office of Economic Adjustment.
Sources: Pew’s calculations using data from the U.S. Department of Commerce’s Bureau of Economic Analysis, Annual State Personal Income and Employment, “Personal Current Transfer Receipts (SA35),” accessed February 2018; USASpending.gov, accessed Feb. 7, 2018; U.S. Department of Defense Office of the Actuary, “Statistical Report on the Military Retirement System, Fiscal Year 2015” (2016); Department of Defense Office of Economic Adjustment, “Defense Spending by State, FY 2015”(2017); and U.S. Census Bureau, “Annual Estimates of the Resident Population for the United States” (December 2017)
Categories of defense spending:
- Contracts for purchases of goods and services, such as military equipment, information technology, and operations and maintenance programs, accounted for 56 percent of all spending in the states. This was the largest category in 35 states and the District of Columbia, and for five—Connecticut, Massachusetts, Minnesota, Missouri, and Pennsylvania—it made up 70 percent or more of their federal defense dollars.
- Salaries and wages for active-duty military, civilian, reserve, and National Guard personnel accounted for 28 percent of total spending. Virginia, California, and Texas received nearly one-third of these funds, reflecting high levels of federal defense employees in these states. For 13 states, this category was the largest.
- Retirement benefits, which are payments to individuals for military pensions, accounted for 12 percent of spending in the states. More than one-third of the total went to Texas, Florida, Virginia, and California.
- Nonretirement benefits, which are payments for health care provided through the military’s Tricare Management Program, accounted for 3 percent of spending. More than one-fifth of these funds went to Florida and Texas.
- Grants, which include funding to state and local governments for programs such as National Guard activities, medical research and development, and basic and applied scientific research, accounted for 1 percent of spending. More than one-fifth of these funds went to Maryland and California.
Anne Stauffer is a project director, Justin Theal is a senior associate, and Laura Pontari is an associate with The Pew Charitable Trusts’ fiscal federalism initiative.
ADDITIONAL RESOURCES

Video

Fact Sheet