The Prescription Drug Landscape, Explored
A look at retail pharmaceutical spending from 2012 to 2016
Overview
Americans spend more on prescription medications each year than the citizens of any other country. Measuring drug spending remains a challenge, however, because of limited public data on how much the various payers and supply chain intermediaries pay for prescription drugs.
Several public and private organizations have recently published U.S. drug spending estimates using different methodologies. These estimates differ, but an analysis from The Pew Charitable Trusts indicates that spending on prescription drugs has increased in recent years. The federal Centers for Medicare & Medicaid Services (CMS) estimates that total retail prescription drug spending rose 26.8 percent between 2012 and 2016—a faster rate of growth than all other categories of personal health care expenditures. This rapid growth was largely attributable to the introduction of new specialty drugs, such as those to treat hepatitis C and various forms of cancer, according to an IQVIA report. Although the pace of rising spending slowed in 2016 and 2017, CMS projects that retail prescription spending will continue to outpace growth in other types of health care spending through 2026.
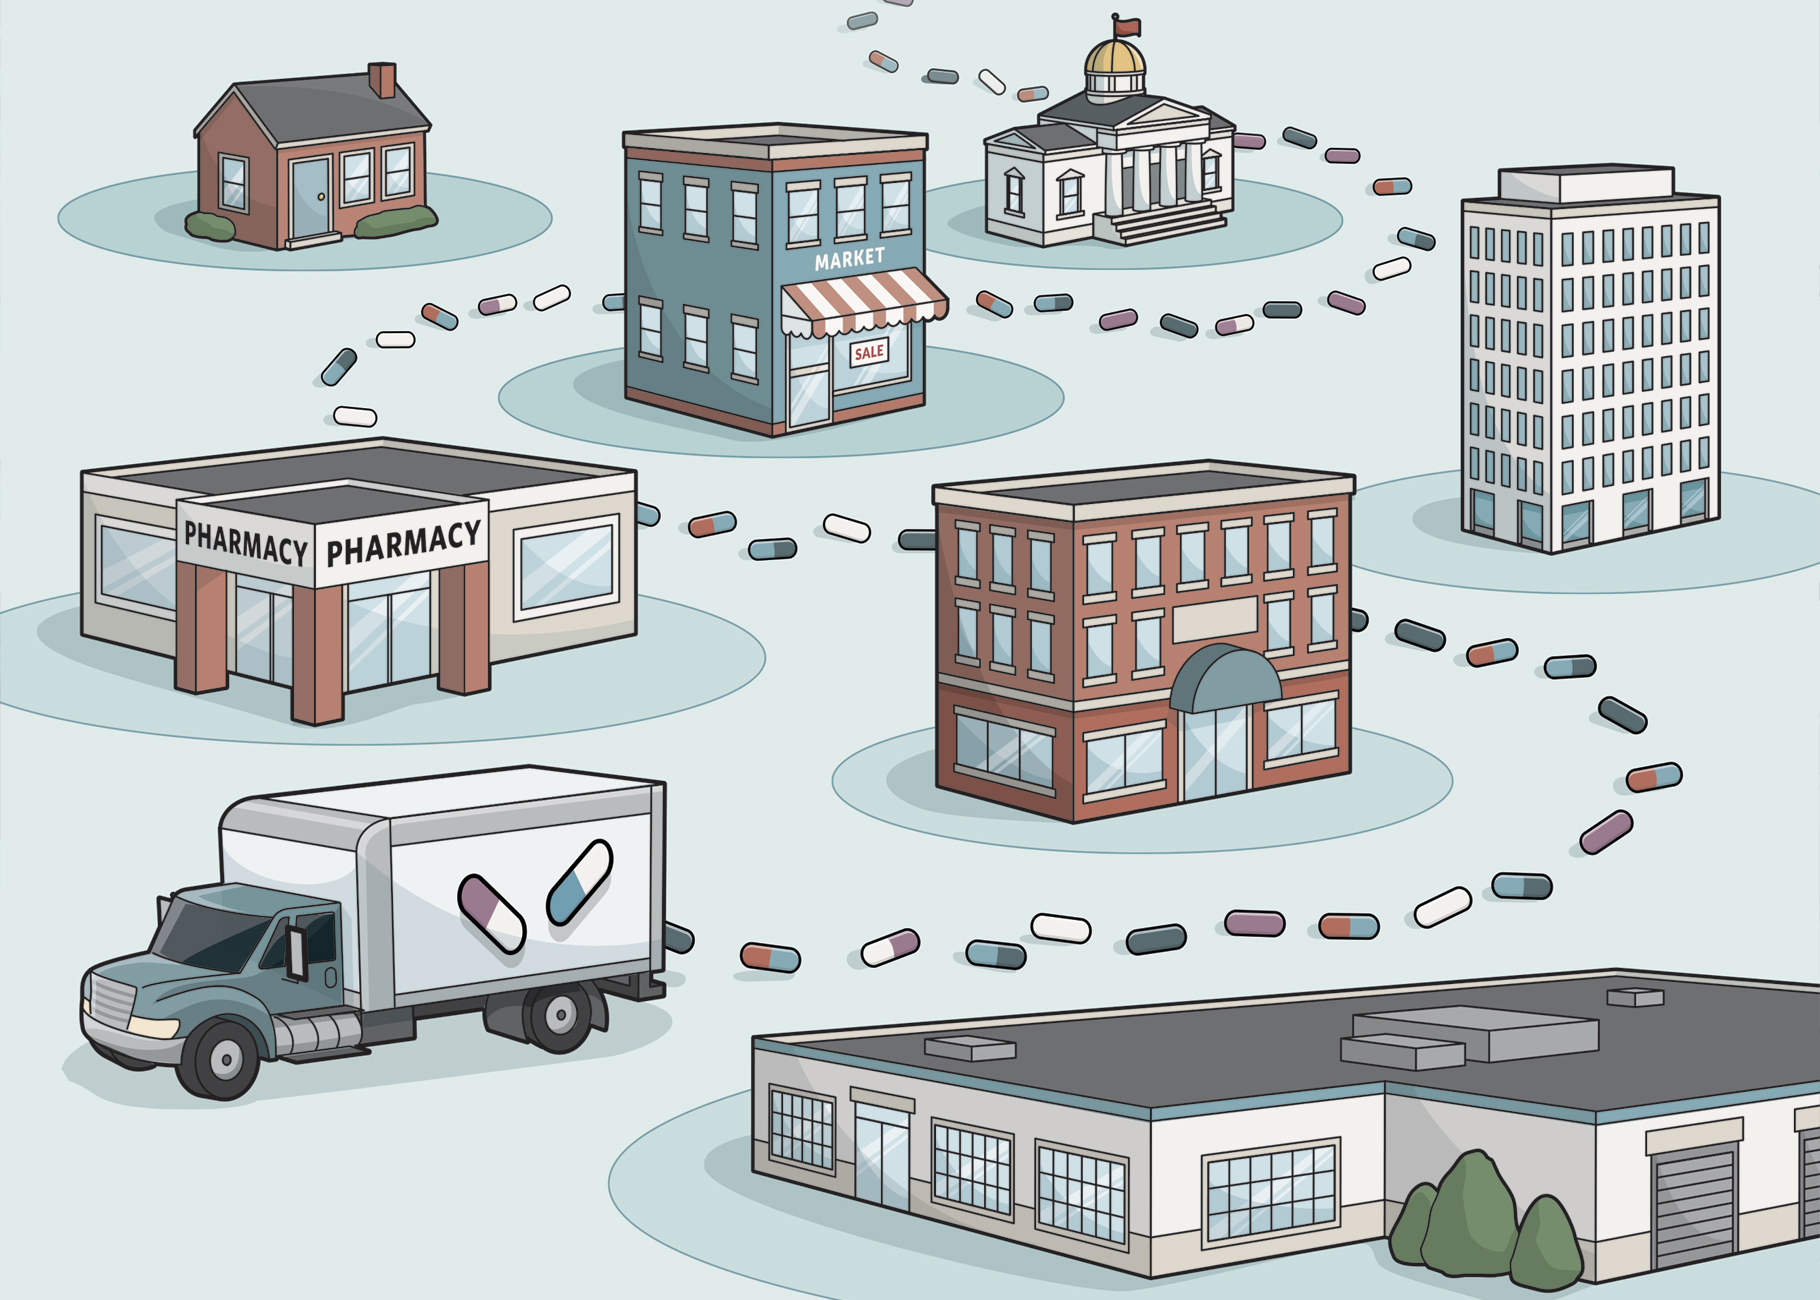
The complex drug supply and payment chain involves transactions among drug manufacturers, wholesalers, pharmacies, pharmacy benefit managers (PBMs), and health plans. To date, several reports have examined the role these various stakeholders play. This analysis, using primary research and a combination of third-party and government reports and data, quantifies the share of overall spending on retail prescription drugs retained by health plans and others in the supply and payment chain. The study differs from some prior analyses because it considers premium payments for retail prescription drug coverage. Including health insurers allows for a holistic view of spending on retail prescription drugs by patients and health plan sponsors, and incorporates both out-of-pocket expenditures and premium payments. This study builds on prior research and offers new perspectives on how the pharmaceutical supply and payment chain for retail drugs evolved from 2012 to 2016.
This study includes a survey of health plan and PBM personnel to estimate trends in the share of overall health insurance premiums attributable to the pharmacy benefit, and in the volume of rebates and other payments paid by pharmaceutical manufacturers to PBMs. It estimates the share of rebates and price concessions paid after the purchase of a drug that the PBMs passed through to health plans, and how that share has changed over time. By estimating the overall volume of manufacturer rebates and the percentage passed through to health plans, the study provides insights into the revenue that manufacturer rebates add to PBMs.
Key Findings
Important findings on retail prescription drug spending and the various stakeholders include:
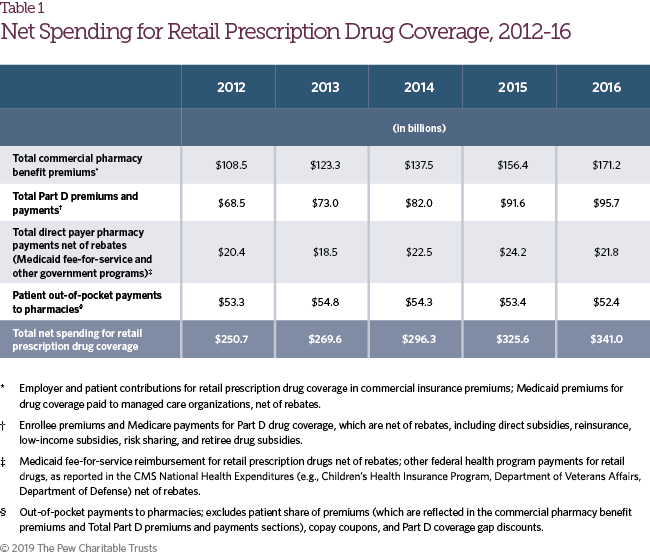
- Net spending increased each year of the study period, from $250.7 billion in 2012 to $341.0 billion in 2016.
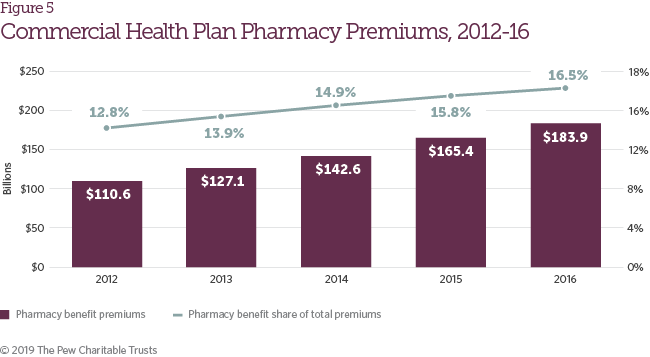
- Total health insurance premiums allocated to the pharmacy benefit of health plans increased from 12.8 percent in 2012 to 16.5 percent in 2016.
- Policies with capped out-of-pocket expenses and cost-sharing assistance from manufacturers helped shelter patients from rising drug costs throughout the study period.
- Net revenue for pharmacies on retail prescription drugs increased from $30.8 billion in 2012 to $76.9 billion in 2016.
- Manufacturer rebates grew from $39.7 billion in 2012 to $89.5 billion in 2016 and played a growing role in partially offsetting increases on list prices, which have risen more quickly than overall retail prescription drug spending.
- A survey of health plan and PBM personnel found that PBMs passed through 78 percent of manufacturer rebates to health plans in 2012 and 91 percent in 2016.
Methodology
The pharmaceutical supply and payment chain involves various stakeholders that manufacture, distribute, dispense, negotiate pricing, and pay for pharmaceuticals. As a drug makes its way to a patient, transactions occur among these stakeholders at numerous points, with no single source of information available to study the entire process. Consequently, this study relied on a compilation of third-party data sets, government and industry reports, and survey findings related to the various transactions occurring among stakeholders. The study addresses prescription drugs reimbursed through the pharmacy benefit and generally dispensed through retail, specialty, mail-order, or long-term care pharmacies. It does not consider drugs administered by a health care professional in a physician’s office or hospital setting, or over-the-counter drugs purchased without a prescription.
Each data source was incorporated into an overarching model that considered the different funding streams for retail prescription drugs—health insurance premiums allocated to the pharmacy benefit, patient cost-sharing, manufacturer direct assistance, and direct pharmacy reimbursement by federal payers (e.g., Medicaid, Department of Veterans Affairs, Department of Defense)—as well as the various stakeholders that make up the pharmaceutical supply and payment chain. This research uses a combination of data analysis, third-party studies, and survey findings to allocate funds across the stakeholders. The amount retained by each stakeholder generally reflects revenue received for the sale of a drug less the direct cost of that drug, and does not consider other operational or financing costs such as rent, sales expenses, general overhead, or taxes. For example, the amount of retail prescription drug spending retained by a pharmacy represents the total reimbursement for the drug less the cost of acquiring the drug after accounting for various price concessions.
The study prioritized government data and publications, and relied on third-party reports where no public or government data were available. Despite the range of accessible information on the pharmaceutical supply and payment chain, gaps persist. In these instances, primary research through telephone and web-based surveys was used to generate the required information. Appendix A contains more detailed information on the model design, study methodology, data sources, and assumptions for each stakeholder in the pharmaceutical supply and payment chain.
Results
This section presents three sets of results: net spending on retail prescription drug coverage and the amount retained by each stakeholder; total reimbursement to pharmacies for prescription drugs; and expenditures and revenues by stakeholder group.
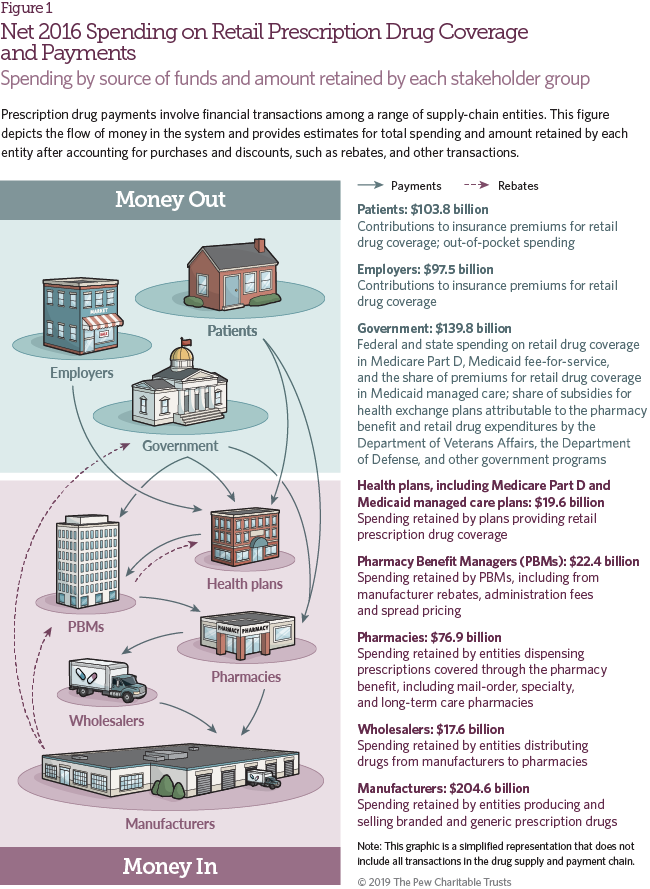
Figure 1 shows 2016 net spending on retail prescription drug coverage, the source of funds, and the amount retained by each stakeholder in the supply and payment chain. Net spending for retail prescription drug coverage includes the share of commercial insurance premiums allocated for the retail drug benefit; Medicare Part D spending on drug coverage, including government and enrollee premiums, reinsurance, and low-income and retiree subsidies; Medicaid fee-for-service and managed care spending on prescription drug coverage net of rebates; other federal health insurance program spending net of rebates; and patient out-of-pocket costs. These estimates may differ from others published, and also from results elsewhere in this study where rebate payments are netted against gross spending. Net spending information for 2012-16 is included in Table 1.
Retail Prescription Drug Reimbursement
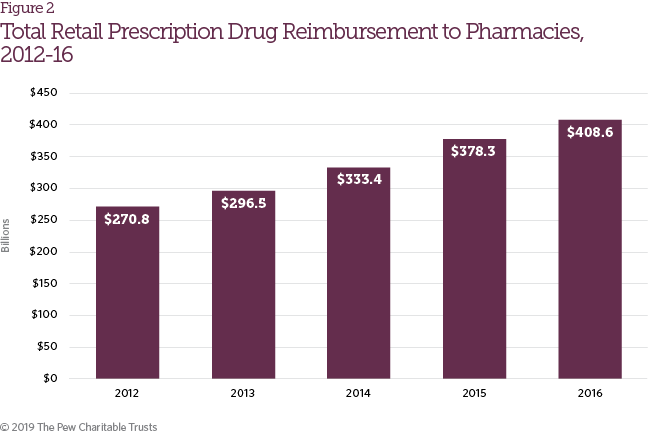
The study defined retail prescription drug reimbursement as payments received by retail pharmacies for prescription drugs, which is distinct from net spending for retail prescription drug coverage because it does not take insurance premiums or rebates into account. It includes direct reimbursements to pharmacies by PBMs, health plans, patients (including manufacturer assistance programs) and certain government payers (e.g., Medicaid, Department of Defense). Retail prescription drug reimbursement increased from $270.8 billion in 2012 to $408.6 billion in 2016 (Figure 2), growth that may be attributable to a variety of factors, including the availability of new drug therapies, increases in drug list prices, and expanded access to insurance coverage.
Results by Stakeholder Group
This section presents results by stakeholder group—patients, commercial health insurers, Medicare Part D plans, Medicaid and other government payers, PBMs, pharmacies, and pharmaceutical manufacturers—with a focus on emerging trends and insights not reported in previous studies. Consolidation and vertical integration in the health care industry have resulted in some companies having subsidiaries that operate in multiple stakeholder groups. For example, companies may have several business units that span the functions of PBM, Part D plan sponsor and mail-order pharmacy. For purposes of this study, any vertically integrated entity is represented in each of the stakeholder groups in which it operates, with the study methodology ensuring that dollars are not counted twice across groups. Detailed tables of the study results are provided in Appendix B, and survey results are reported in Appendix C.
Patients
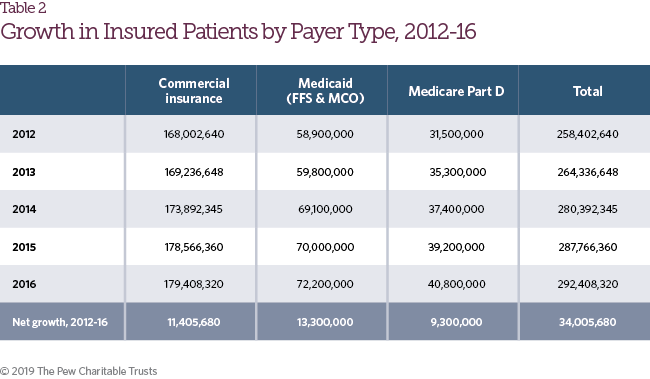
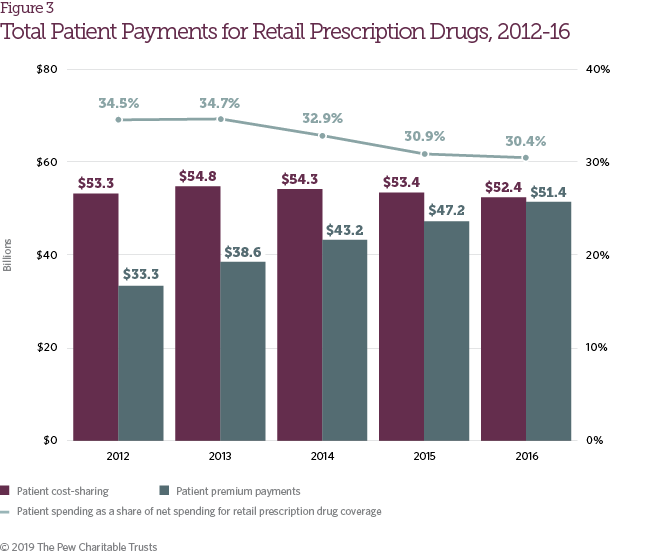
The number of patients with health insurance coverage increased by 13.2 percent from 2012 to 2016 (Table 2),1 driven by greater access to individual health coverage under the Affordable Care Act, increases in Medicare Part D enrollment, and Medicaid expansion. As access to prescription drug coverage expanded, aggregate patient payments also increased for retail pharmaceuticals. From 2012 to 2016, patient payments, including both cost-sharing and premium payments, grew from $86.6 billion to $103.8 billion (Figure 3). As a share of net spending on retail prescription drug coverage, however, patient payments declined during the same time frame from 34.5 percent of total spending to 30.4 percent.
Changes in health benefit design during the study period resulted in a significant increase in average annual patient spending on deductibles and coinsurance among people with coverage provided by large employers, but a decline in average spending on copayments; deductibles are also a growing share of all patient cost-sharing, representing more than 50 percent of such payments in health plans in 2016.2 During the study period, brand drug list prices, which are typically the basis for patient coinsurance and spending in the deductible phase of the benefit, rose sharply.3
Patient responsibility for retail prescription drug costs increased from $59.5 billion in 2012 to $65.8 billion in 2016, despite the offsetting effects of increases in generic utilization rates and the introduction of patient out of- pocket maximums in the Affordable Care Act.4 Many patients have largely been shielded from this increase, however, through the expanded use of copay coupon programs and the closing of the Medicare Part D coverage gap (Figure 4).5 Together, copay coupons and Part D coverage gap discounts represented more than 20 percent of patient responsibility for retail prescription drug costs in 2016. With the other factors noted above, these contributed to a slight decline in actual patient cost-sharing payments from 2014 to 2016, following an increase in 2013. However, individual patient experiences with cost-sharing vary widely.
Commercial Health Insurers
During the study period, both the total value of commercial insurance premiums attributed to the pharmacy benefit and the share of insurance premiums attributed to the retail pharmacy benefit increased (Figure 5). These trends track the growth in total reimbursement for retail prescription drugs summarized in Figure 2.
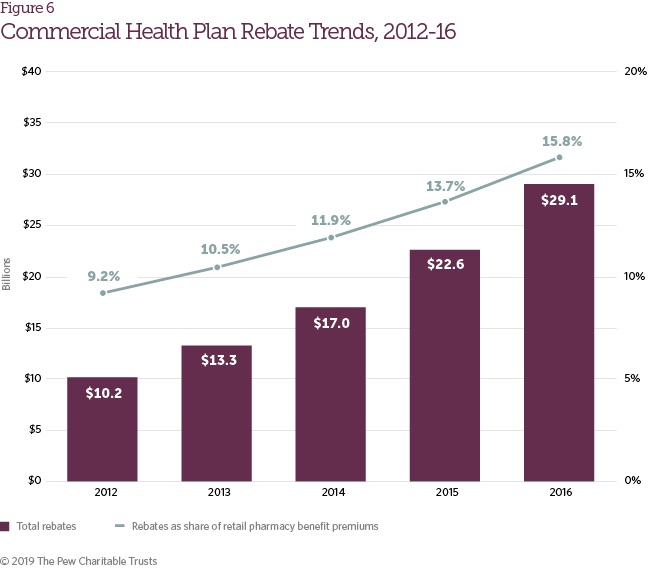
During the study period, the rise in brand drug list prices was partially offset by growth in pharmaceutical manufacturer rebates. Rebates accounted for 15.8 percent of retail pharmacy benefit premiums in commercial plans in 2016, up from 9.2 percent in 2012 (Figure 6). Rebate growth reflects an increasingly competitive pharmaceutical marketplace and the negotiating power that PBMs and health plans are able to exert in certain therapeutic categories (e.g., diabetes, hepatitis C, cardiology, etc.).6 The continued growth in both list prices and rebate volume has contributed to a larger spread between the list and net prices of brand pharmaceuticals.7 Although manufacturer rebates do not typically reduce patient out-of-pocket costs directly, survey respondents reported that higher rebate volume helps limit growth in member premiums.
Medicare Part D Plans
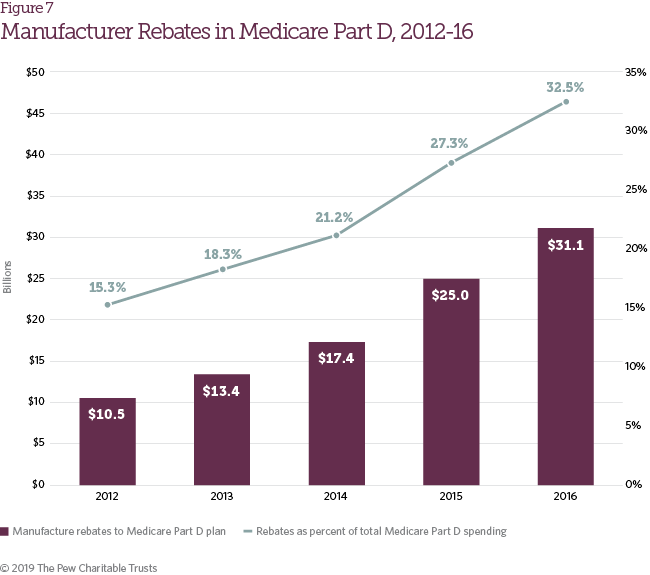
Many of the trends observed in commercial health plans were also identified in Medicare Part D plans. Growth in list prices for pharmaceutical drugs has largely been offset by growth in manufacturer rebates to Medicare Part D plans, which nearly tripled from 2012 to 2016 (Figure 7). This rebate growth has helped restrain total Medicare Part D spending increases and limited Part D enrollee premium growth. Lower premiums have also contributed to slow growth in overall Medicare Part D spending per beneficiary from 2012 to 2016, which increased just 2 percent per year on average.8
Medicaid and Other Government Payers
Medicaid and other government payers (e.g., Department of Veterans Affairs, Department of Defense), excluding Medicare, provide coverage for retail prescription drugs. These payments are subsequently offset by statutory rebates that pharmaceutical manufacturers pay to Medicaid and Tricare (the health care program for uniformed service members, retirees, and their families). Net spending on retail prescription drugs in this category has gone up, driven by a combination of Medicaid expansion (which increased Medicaid enrollment by 22.6 percent from 2012 to 2016)9 and growth in per-beneficiary drug spend from 2014 to 2016, after declining slightly in 2013. From 2012 to 2016, the annual Medicaid per-beneficiary spend in this category, including patients covered under Medicaid managed care plans, increased from $337 to $402 (Table 3).
Spending growth for Medicaid and other government payers would have been higher without offsetting factors. The Affordable Care Act increased the base Medicaid rebate for both brand and generic drugs and required that rebates be paid for drugs covered by Medicaid managed care plans. These actions, combined with the Medicaid inflation penalty (which requires additional rebates when a drug’s Average Manufacturer Price increases faster than the consumer price index), contributed to a surge in the volume of Medicaid rebates for retail drugs from $13.3 billion in 2012 to $23.5 billion in 2016.10 These factors limited the impact of list price growth and likely hastened the shift of Medicaid drug coverage to managed care plans, entities that contract with Medicaid agencies to provide health services to their beneficiaries.11 Figure 8 shows total net spend for Medicaid and other government payers on retail prescription drugs (including managed Medicaid care plan premium payments for retail drug coverage).12
Pharmacy Benefit Managers
Positioned at the nexus of health plans, manufacturers, and pharmacies, PBMs play a critical role in the pharmaceutical payment chain. Limited data are available on PBM financial relationships with other supply and payment chain entities because the terms of these contracts are almost always confidential.13 However, through a survey of PBM and health plan staff, this study sheds additional light on the volume of rebates paid by manufacturers and the extent to which they are “passed through” to their commercial and Medicare Part D plan clients.
Survey results found that PBMs passed through a higher share of manufacturer rebates in 2016 (91 percent) than in 2012 (78 percent). Figure 9 shows total retained revenue attributable to traditional PBM operations (i.e., managing the pharmacy benefit on behalf of health plans), including the share generated by rebate volume and other revenue streams, such as administrative fees, service fees, and spread pricing (a business practice in which the PBM charges a client more for a drug than it reimburses the pharmacy).
Despite the higher rates of rebate pass-through, PBMs retained roughly the same volume of rebates (in dollar terms) in 2016 as in 2012 because of overall growth in rebate volume. Growth in alternate PBM revenue streams, such as spread pricing and administrative fees, offset a $2.2 billion reduction in retained rebate volume between 2014 and 2016, and increased the overall share of retail prescription drug spending retained by PBMs.
Pharmacies
Drugs reimbursed through the pharmacy benefit are primarily dispensed through retail, specialty, mail-order, long-term care and outpatient pharmacies. As more patients obtained prescription drug coverage and brand drug list prices climbed in recent years, total reimbursement to pharmacies for retail prescription drugs also increased, from $270.8 billion in 2012 to $408.6 billion in 2016 (Figure 10).17 Similarly, total pharmacy gross margins (the difference between drug reimbursement and drug cost) also increased during this time frame. In 2012, gross margin as a percentage of drug reimbursements to pharmacies was 11 percent, and it grew to 19 percent in 2016.
As noted in the methodology section, total drug reimbursement was estimated separately from drug costs. As a result, the margin in Figure 10 is derived from drug reimbursement and cost. Margin percentages in this report might be slightly lower than those appearing in other sources. The difference might reflect lower revenue or higher costs calculated in this study than what is realized by pharmacies. For example, the IQVIA invoice spend data relied upon in this study does not include off-invoice discounts from pharmaceutical companies to pharmacies on drug purchases. The volume of these off-invoice discounts is unknown, but their exclusion might overstate total pharmacy costs and therefore understate total pharmacy margins.
Pharmaceutical Manufacturers
The widening gap between a drug’s list and net price has been receiving increased attention from media and policymakers.14 This trend has implications for patients taking prescription drugs because patient cost-sharing (coinsurance and patient payments in the deductible phase of the benefit) is typically a function of a drug’s list price.15 From 2012 to 2016, rebates and discounts, including copay coupons and the Part D coverage gap discount, made up a growing share of gross sales, increasing from 21.8 percent to 35.8 percent (Figure 11). After accounting for all types of price concessions, including negotiated rebates, discounts mandated by law, and patient assistance, pharmaceutical manufacturers’ net revenue on retail prescription drugs grew an average of 3.6 percent annually during the study period, but decreased from $214.7 billion in 2015 to $204.6 billion in 2016, due in part to the discounting of hepatitis C drugs.16
Growth in manufacturer price concessions has been observed in both statutory discounts for government programs and voluntary rebates (Figure 12). Both Medicaid expansion and the trend of higher list prices, which can trigger the Medicaid inflation penalty,18 have contributed to growth in statutory discounts.19 The shift toward requiring patients to pay coinsurance on high-cost specialty drugs in insurance plans has made it more difficult for some patients to afford these therapies. This shift has caused manufacturers to offer additional patient assistance, such as copay coupons, to offset the increase in patient responsibility for drug costs.20 In addition, consolidation of PBMs and, in some cases, mergers with health insurers have increased the negotiating power of large PBMs, which may have contributed to growth in commercial and Medicare Part D rebates. Increased competition from new product entrants in key therapeutic categories, such as diabetes, hepatitis C, and immunology, has also contributed to a higher commercial rebate volume.21
Conclusion
Net spending on retail prescription drug coverage increased each year of the study period, growing from $250.7 billion in 2012 to $341.0 billion in 2016. During the same time frame, the share of commercial insurance premiums for retail prescription drug coverage rose from 12.8 percent to 16.5 percent. While the total cost of this coverage has increased, patient out-of-pocket spending has remained stable in recent years, due in part to increased insurance coverage and manufacturer assistance, such as the Part D coverage gap discount and copay coupons. Rebates and other discounts have played an increasingly important role in partially offsetting the continued growth of list prices for brand name drugs. Although PBMs have passed along a growing share of manufacturer rebates to plan sponsors, these entities have slightly increased their share of the total spend through other types of revenue.
Endnotes
- Kaiser Family Foundation, “Health Insurance Coverage of the Total Population” (2017), https://www.kff.org/other/state-indicator/total-population/?currentTimeframe=0&sortModel=%7B%22colId%22:%22Location%22,%22sort%22:%22asc%22%7D; U.S. Census Bureau, “Health Insurance Coverage Status and Type of Coverage by Selected Characteristics” (2017), https://www.census.gov/data/tables/time-series/demo/income-poverty/cps-hi/hi-01.2016.html; Kaiser Family Foundation, “Medicare Part D in 2016 and Trends over Time” (2016), http://files.kff.org/attachment/Report-Medicare-Part-D-in-2016-and-Trends-over-Time; Statista, “Total Medicaid Enrollment From 1966 to 2018 (in Millions)” (2018), https://www.statista.com/statistics/245347/total-medicaid-enrollment-since-1966/.
- Gary Claxton et al., “Increases in Cost-Sharing Payments Continue to Outpace Wage Growth” (2018), https://www.healthsystemtracker. org/brief/increases-in-cost-sharing-payments-have-far-outpaced-wage-growth/#item-start.
- Carl E. Schmid II, “New Accumulator Adjustment Programs Threaten Chronically Ill Patients,” Health Affairs Blog, Aug. 31, 2018, https://www.healthaffairs.org/do/10.1377/hblog20180824.55133/full/; Peterson-Kaiser Health System Tracker, “What Are the Recent and Forecasted Trends in Prescription Drug Spending?” accessed Oct. 17, 2018, https://www.healthsystemtracker.org/chart-collection/recent-forecasted-trends-prescription-drug-spending/#item-start.
- IQVIA Institute for Human Data Science, “Medicine Use and Spending in the U.S.: A Review of 2017 and Outlook to 2022” (2018), https://www.iqvia.com/institute/reports/medicine-use-and-spending-in-the-us-review-of-2017-outlook-to-2022; Patient Protection and Affordable Care Act, 42 U.S.C. § 18001, Sec. 1302 (2010).
- Catherine I. Starner et al., “Specialty Drug Coupons Lower Out-Of-Pocket Costs and May Improve Adherence At The Risk Of Increasing Premiums,” Health Affairs 33, no. 10 (2014), https://healthaffairs.org/doi/pdf/10.1377/hlthaff.2014.0497; Centers for Medicare & Medicaid Services, “Closing the Coverage Gap—Medicare Prescription Drugs are Becoming More Affordable” (2017), https://www.medicare.gov/pubs/pdf/11493.pdf.
- IQVIA Institute for Human Data Science, “Medicines Use and Spending in the U.S.: A Review of 2016 and Outlook to 2021” (2017), https://www.iqvia.com/-/media/iqvia/pdfs/institute-reports/medicines-use-and-spending-in-the-us.pdf.
- Ibid.
- Kaiser Family Foundation, “Medicare Part D in 2016.” The Boards of Trustees, Federal Hospital Insurance and Federal Supplementary Medical Insurance Trust Funds, “2016 Annual Report of the Boards of Trustees of the Federal Hospital Insurance and Federal Supplementary Medical Insurance Trust Funds” (2016), https://www.cms.gov/Research-Statistics-Data-and-Systems/Statistics-Trends-and-Reports/ReportsTrustFunds/Downloads/TR2016.pdf; MedPAC, “Status Report on the Medicare Prescription Drug Program (Part D)” (2017), http://www.medpac.gov/docs/default-source/reports/mar17_medpac_ch14.pdf.
- Statista, “Total Medicaid Enrollment.”
- Patient Protection and Affordable Care Act, 42 U.S.C. § 18001, Sec. 2001, Sec. 2501; 42 U.S.C. § 1396r–8(c). Managed Medicaid rebate volume only considers statutory and state supplemental rebates and does not include any additional rebates that may be negotiated directly with a managed Medicaid plan.
- Shellie L. Keast, Grant Skrepnek, and Nancy Nesser, “State Medicaid Programs Bring Managed Care Tenets to Fee for Service,” Journal of Managed Care and Specialty Pharmacy 22, no. 2 (2016), https://jmcp.org/doi/full/10.18553/jmcp.2016.15050.
- Managed Medicaid premiums are also included in the Commercial Health Insurers section but are not counted twice in the overarching model or in how retail prescription drug spending is allocated across stakeholders.
- Stephen Barlas, “Employers and Drugstores Press for PBM Transparency: A Labor Department Advisory Committee Has Recommended Changes,” Pharmacy and Therapeutics 40, no. 3 (2015), https://ncbi.nlm.nih.gov/pmc/articles/PMC4357353/.
- Andrew W. Mulcahy, Christine Eibner, and Kenneth Finegold, “Gaining Coverage Through Medicaid Or Private Insurance Increased Prescription Use And Lowered Out-Of-Pocket Spending,” Health Affairs 35, no. 9 (2016), https://ncbi.nlm.nih.gov/pubmed/27534776; IQVIA, “Medicines Use and Spending.”
- Bruce Booth, “Innovators Vs. Exploiters: Drug Pricing and the Future of Pharma” (2016), https://www.forbes.com/sites/ brucebooth/2016/08/29/innovators-vs-exploiters-drug-pricing-and-the-future-of-pharma/#2f73f7c364fc; Alex M. Azar II, “Remarks to 340B Coalition Summer Meeting” (2018), https://www.hhs.gov/about/leadership/secretary/speeches/2018-speeches/remarks-to- 340b-coalition-summer-meeting.html.
- Schmid, “New Accumulator Adjustment Programs.”
- IQVIA, “Medicine Use and Spending.”
- 2 U.S.C. § 1396r–8(c). Under the Medicaid inflation rebate, the manufacturer must discount the difference between the current average price of the drug and the inflation-adjusted list price of the drug.
- Aaron Vandervelde and Eleanor Blalock, “The Oncology Drug Marketplace: Trends in Discounting and Site of Care” (2017), Berkeley Research Group LLC, https://communityoncology.org/wp-content/uploads/2017/12/BRG_COA-340B-Study_NOT_EMBARGOED.pdf .
- AIS Health, “Coinsurance Was Main Pharmacy Benefit Specialty Cost-Share Tool,” accessed July 6, 2018, https://aishealth.com/ drug-benefits/coinsurance-was-main-pharmacy-benefit-specialty-cost-share-tool/; Congressional Research Service, “Prescription Drug Discount Coupons and Patient Assistance Programs (PAPs)” (2017), https://www.everycrsreport.com/files/20170615_ R44264_1620b32a24a5e7e0bd6150be54c139fc134c4ab2.pdf.
- Fiona Scott Morton and Lysle T. Boller, “Enabling Competition in Pharmaceutical Markets” (2017), Brookings, https://www.brookings.edu/wp-content/uploads/2017/05/wp30_scottmorton_competitioninpharma1.pdf; IQVIA, “Medicines Use and Spending.”
- Cole Werble, “Prescription Drug Pricing: Pharmacy Benefit Managers,” Health Affairs Health Policy Brief Series (2017), https://www.healthaffairs.org/do/10.1377/hpb20171409.000178/full/ .
