Are Today’s Young Workers Better Able to Save for Retirement?
Some—but not all—have seen improvements in retirement plan access and participation in past 14 years
The last three decades have seen a dramatic shift in the retirement savings landscape. Many employers have shifted from offering traditional defined benefit pension plans to offering defined contribution plans such as 401(k)s. Millennials are the first generation to rely on defined contribution plans as their main means of saving for retirement. However, it is unclear to what extent this shift may have affected young workers’ ability to save. Defined contribution plans may have allowed young workers greater flexibility to save, increasing their savings. But workers also bear all the responsibility for their retirement security in defined contribution plans.
Workers are responsible for deciding whether and how much to save, making their own investment selections in a defined contribution plan, and determining how to use their savings in retirement. If a worker chooses investments that perform poorly, for example, he or she may have limited resources when reaching retirement.
A defined benefit plan provides a guaranteed source of lifetime income, meaning there is much less risk that a worker with a defined benefit plan will outlive his or her savings, and employers are generally responsible for most decisions in a defined benefit plan. Of course, an employer could mismanage a defined benefit plan, putting the pension at risk. However, workers in defined contribution plans are left with many more financial decisions that expose them to greater financial risk.
Using data from the 1996 and 2008 panels of the U.S. Census Bureau Survey of Income and Program Participation (SIPP), The Pew Charitable Trusts examined how workers ages 18-31 differ across time in terms of their access to, takeup of, and participation in workplace retirement plans, including both defined benefit and defined contribution plans. Access represents the percentage of workers who reported that their employer offered a retirement plan. Takeup measures the percentage of workers who reported saving in a workplace retirement plan that was available, while participation captures the percentage of all workers participating in a workplace plan regardless of whether they have access to a plan through their employer (see “Understanding Access, Takeup, and Participation” for an example). We also assess how retirement plan balances changed over time for young workers.
We distinguish between young workers divided into two age groups, 18-24 and 25-31, because younger workers are more likely to be finishing school or may still be gaining work experience. This allows us to better examine the role that these factors may play in the retirement outcomes examined.
Understanding Access, Takeup, and Participation
This scenario helps explain the differences in terms used in the chartbook.
For example: Out of 100 workers, 50 are offered a retirement plan; this would translate to an access rate of 50 percent. Say 25 of those workers who had access chose to participate in that plan. The takeup rate would be 50 percent (25 who participated in the plan out of the 50 who had access), while the participation rate would be 25 percent (the 25 workers who participated out of the 100 workers overall).
Among the key findings:
- Young workers have higher overall plan balances in defined contribution accounts than the previous generation.
- Gains in access to defined contribution plans were offset by lower rates of access to defined benefit plans for workers both ages 18-24 and 25-31. The result is that overall rates of access for young workers remained unchanged between 1998 and 2012.
- Although access overall remained constant, takeup increased in both defined contribution and defined benefit plans for workers ages 25-31.
- Participation increased for workers ages 25-31, largely driven by increases in defined contribution plan participation.
- Men and women had similar rates of access, takeup, and participation.
- Men ages 25-31 saw increases in access and participation while women ages 25-31 saw increases in access and takeup.
- Hispanics lagged substantially behind both blacks and whites of the same age in 2012. However, Hispanics ages 25-31 saw the greatest increases in access of any racial or ethnic group.
- Hispanics ages 25-31 increased their access to retirement plans from 44 percent to 51 percent from 1998 to 2012. Still, two-thirds of blacks and nearly three-fourths (72 percent) of whites had access to plans in 2012.
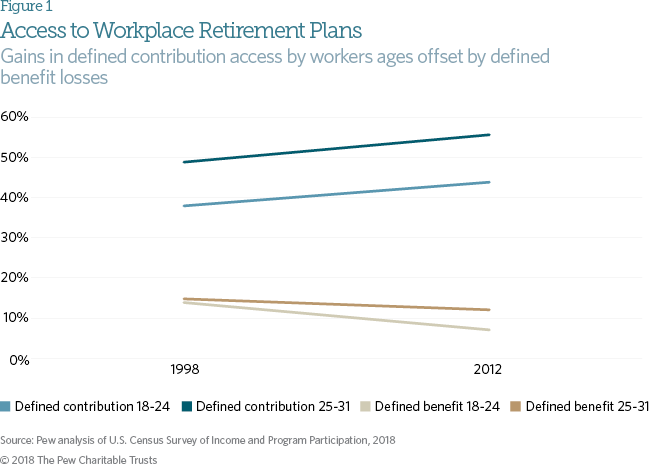
Workers ages 18-24 and 25-31 both saw similar increases in their rates of access to defined contribution plans, increasing from 38 percent to 44 percent and from 49 percent to 56 percent respectively.1 These gains in access to defined contribution plans were largely offset for workers ages 18-24 by declines in their rates of access to defined benefit plans. The proportion of workers overall who had access to a workplace retirement plan remained relatively unchanged even as a larger share gained access to defined contribution plans and defined benefit plans continued to represent a smaller share of plans. These workers saw their access to those plans fall from 14 percent to 7 percent. While access to defined benefit plans declined for workers ages 25-31, the decline was less substantial, falling from 15 percent to 12 percent. The result is that overall access for workers ages 18-24 remained relatively unchanged while access increased for workers ages 25-31.2
Access in 1986
As a result of changes to the SIPP questionnaire, participation in plans from previous panels is not comparable to those in 1998 and in 2012. Still, rates of access to workplace retirement plans are helpful in understanding how the experience of young workers has changed over time.
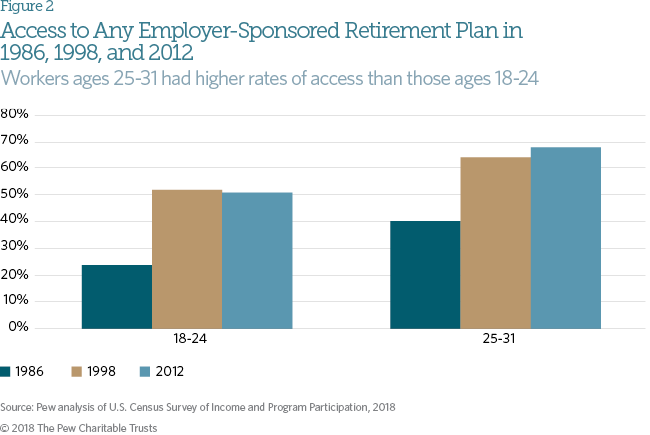
Young workers in 1986 had relatively low rates of access to any type of employer-sponsored retirement plan. Nearly a quarter of workers ages 18-24 in 1986 had access to a workplace retirement plan while this number rose to 2 in 5 workers for those ages 25-31. In later years, access to either a defined contribution or defined benefit plan was higher. However, it is impossible to attribute these differences to improvements over time because the changes to the SIPP questionnaire were likely—at least in part—to lead respondents to report higher rates of access to and participation in workplace plans. Additionally, over this period, there has been a shift from defined benefit plans to defined contribution plans that could also have led to increased access.3
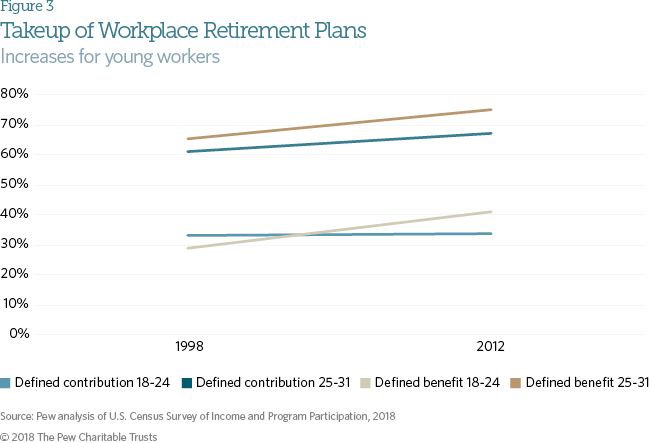
Retirement plan takeup measures participation among those with access to a plan. Takeup rates for workers ages 25-31 increased for both defined contribution and defined benefit plans. Among this age group, takeup of defined contribution plans increased from 61 percent to 67 percent, while takeup of defined benefit plans increased from 65 percent to 75 percent. Workers ages 18-24, who take up plans at much lower rates than their older counterparts, saw fewer gains. Takeup of defined contribution plans for these workers remained steady, at 34 percent between 1998 and 2012.4 One factor likely contributing to increased takeup of retirement plans in recent years is the ability to automatically enroll workers into defined contribution plans, the use of which was greatly expanded with the Pension Protection Act of 2006.5 Automatically enrolling workers has been found to substantially increase participation in retirement plans.6
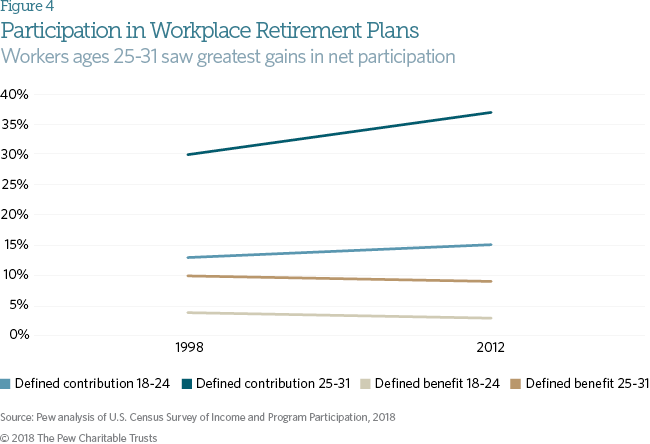
Participation in a retirement plan measures the rate at which workers participate overall as opposed to just among those who had access to a plan. Participation rates for workers ages 25-31 increased overall, driven by increased access and participation in defined contribution plans. Workers ages 25-31 increased their participation in defined contribution plans from 30 percent to 37 percent while participation in defined benefit plans for this group remained relatively unchanged at 9 percent in 2012. While a greater proportion of those with defined benefit plans participated when offered in 2012, lower rates of access to such a plan meant that overall participation rates in defined benefit plans held constant. There was little change in the participation rates for workers ages 18-24 in both defined contribution and defined benefit plans.7
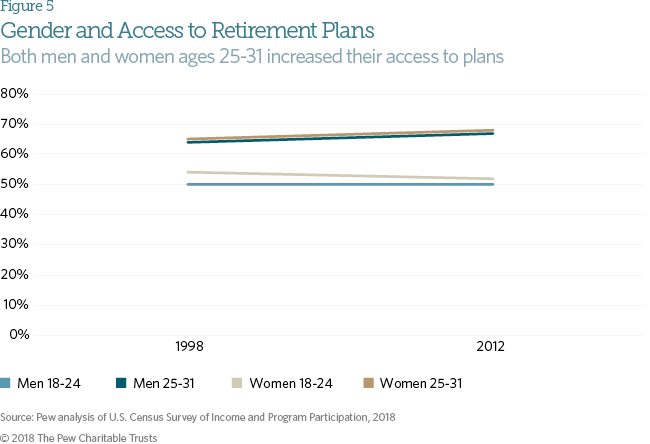
Access increased for both men and women ages 25-31; for men this improvement was significant, increasing access from 64 percent to 67 percent. Although access for women ages 18-24 dropped slightly, overall rates for ages 18-24 remained relatively stable.8 Labor force participation rates for men ages 20-24 fell by nearly 10 percentage points from 1998 to 2016, while women ages 20-24 saw declines of just over 3 percentage points during the same period.9 At least some of the decline in retirement plan access may be attributed to the decline in the demand for unskilled labor.10
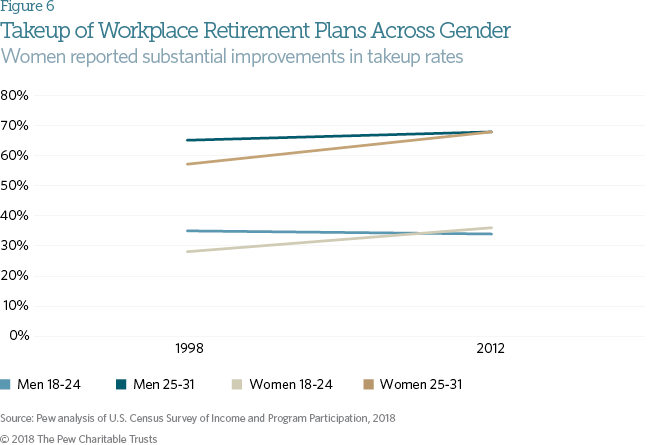
In 1998, women ages 18-24 took up available plans at lower rates than their male counterparts. By 2012, women ages 18-24 had slightly higher takeup rates than men of the same age. Similar to trends in access for men ages 18-24, takeup rates for men ages 18-24 were flat across time. Meanwhile, women ages 25-31 pulled even with men, with both taking up retirement plans 68 percent of the time. In 1998, men and women ages 25-31 took up plans at a rate of 65 percent and 57 percent, respectively. However, only women’s increase in takeup was statistically significant.11
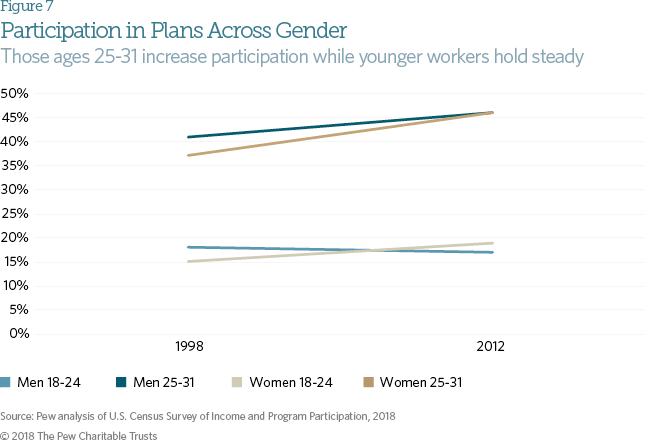
Both men and women ages 25-31 increased their net participation rates. Men increased their participation from 41 percent in 1998 to 46 percent in 2012, while women closed the participation gap with men, rising from 37 percent to 46 percent. Reflecting the fact that younger workers ages 18-24 saw limited improvement in their rates of access and takeup, men ages 18-24 remained relatively unchanged, with just 17 percent of men participating in 2012, down just 1 percentage point from 1998. Women ages 18-24 increased slightly.12
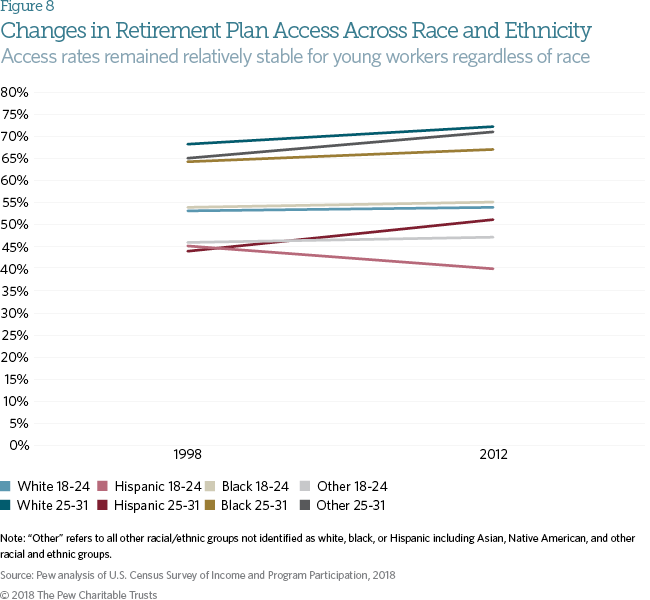
Workers ages 25-31 of all races saw at least modest improvements in their rates of access to workplace retirement plans. However, only white workers improved substantially. Although access rates for Hispanics ages 25-31 increased from 44 percent to 51 percent, they still lagged well behind other racial and ethnic groups. Across racial and ethnic groups, older workers’ access rates increased from 1998 to 2012. However, access rates for most workers ages 18-24 remained unchanged or decreased. Slightly more than half of both whites and blacks continued to have access to retirement plans. However just 2 in 5 Hispanics ages 18-24 had access in 2012, down from 45 percent in 1998. Hispanics ages 25-31 had similar rates of access as Hispanics ages 18-24 in 1998, 44 percent and 45 percent respectively. By 2012, however, the gap between these two groups had grown to more than 10 percentage points, with 51 percent of Hispanics ages 25-31 having access compared to just 4 in 10 of those ages 18-24.13
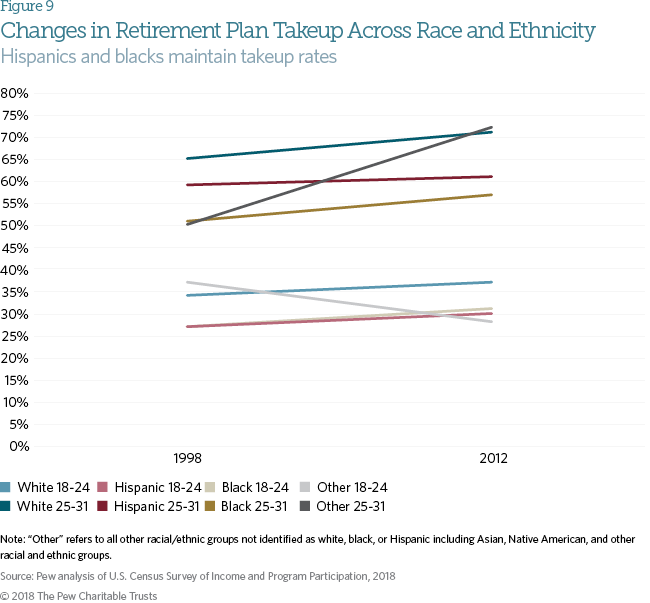
Regardless of race, workers ages 25-31 took up plans when offered at higher rates than their younger counterparts. Asians and other racial/ ethnic groups in this segment saw the largest increases in takeup rates, going from half of workers taking up plans to nearly three quarters, while their younger counterparts experienced a steep decline. Though more modest, whites and blacks also increased their takeup rates. Takeup rates for Hispanics ages 25-31 remained unchanged, though they were higher than takeup rates among blacks. Workers ages 18-24 of all races saw little improvement, while Asians and other racial/ethnic groups declined from 37 percent in 1998 to 28 percent in 2012.14
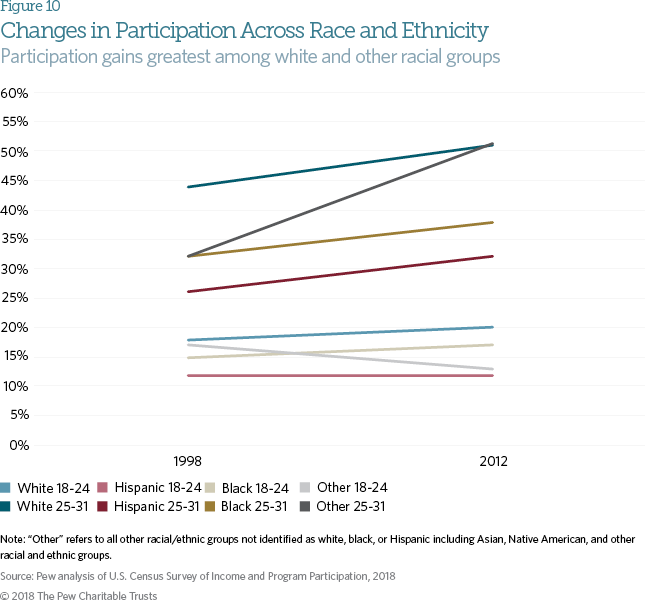
Probably driven in large part by changes in takeup rates, whites and other racial/ethnic groups ages 25-31 reported increases in their participation rates, both just exceeding half of all workers participating. While blacks and Hispanics ages 25-31 both saw increases in their participation rates from 1998 to 2012 of 6 percentage points, they still lag behind whites, with Hispanics faring poorest. While Hispanics had higher rates of takeup than blacks, their overall participation rates remain lower in large part because they have such low rates of access to retirement plans through their employers.15
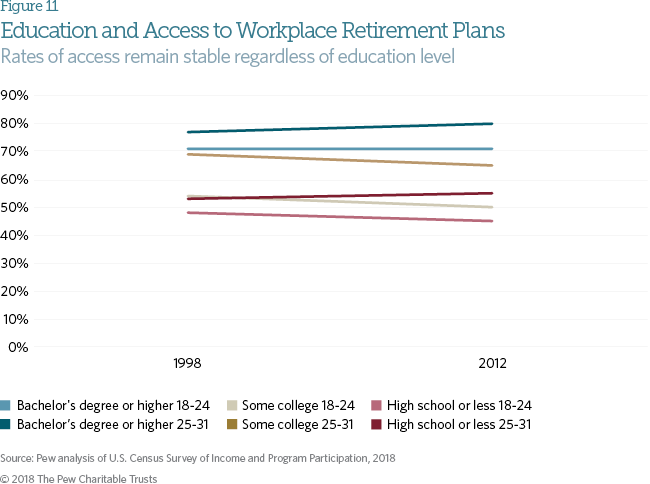
Previous research shows an association between educational attainment and access to workplace retirement plans.16 Differences in access to workplace retirement plans across education level are consistent with previous findings that show higher educational attainment associated with greater access to retirement plans. Access rates for all education and age groups remained unchanged from 1998 to 2012.17
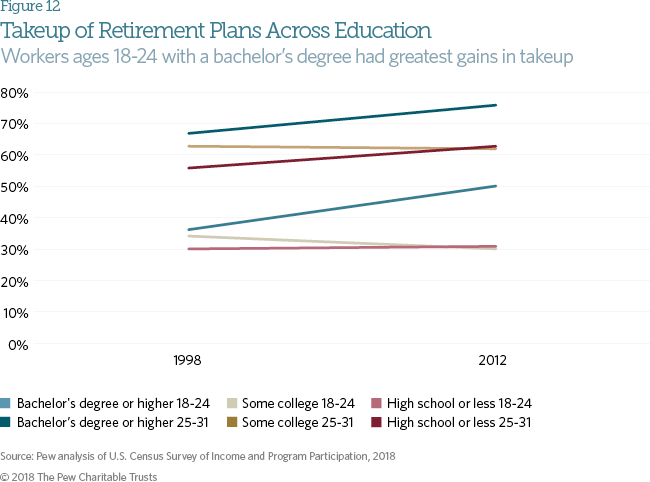
Workers ages 25-31 took up retirement plans when offered at their workplaces at higher rates than their younger counterparts regardless of education. In 2012, 63 percent of workers ages 25-31 with no more than a high school degree took up a retirement plan when offered one at work, higher than the 50 percent of workers ages 18-24 with a bachelor’s degree. Those with a bachelor’s degree regardless of age and those ages 25-31 with a high school degree or less had higher rates of takeup in 2012 than in 1998. Workers ages 18-24 with a bachelor’s degree had the greatest gains, increasing their takeup of available plans by 14 percentage points. Those ages 25-31 with a bachelor’s degree similarly had higher takeup rates in 2012, with 76 percent taking up a plan that year compared to 67 percent in 1998.18
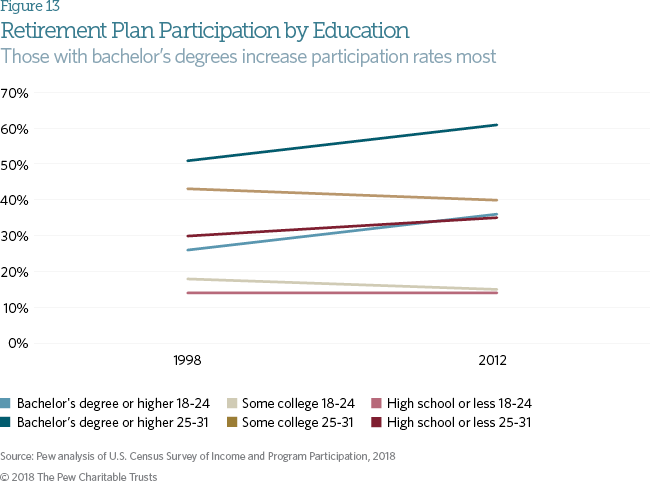
Participation varies widely by age and education level. Younger workers and those with lower educational attainment participated at lower rates than older workers and those with more education. Participation for those with some college fell slightly. Those with a bachelor’s degree increased their participation rates by 10 percentage points from 1998 to 2012. Additionally, those ages 25-31 with just a high school diploma or less increased net participation to 35 percent from 30 percent.19
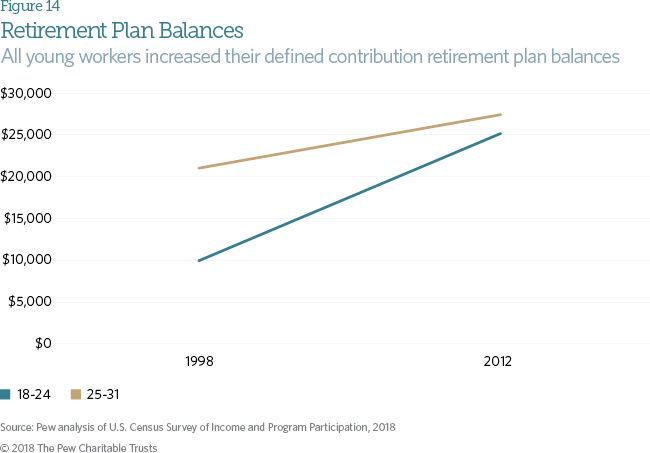
Defined contribution plan balances have increased for both older and younger workers. While a large gap of more than $10,000 existed in mean plan balances between older and younger workers in 1998 early in their careers, younger workers today have closed much of this gap. While those ages 25-31 in 2012 had substantial increases over similar workers in 1998, rising from roughly $21,000 in 1998 to $27,000 in 2012, younger workers in 2012 reported having saved nearly as much in their retirement plans as older workers, increasing plan balances from just under $10,000 in 1998 to more than $25,000 in 2012.20
Conclusion
Overall young workers saw some gains in their rates of access to, takeup of, and participation in workplace retirement plans. These gains have generally been among older and more educated workers. However, younger workers ages 18-24 did have substantial gains in their plan balances, nearly equaling the average plan balance of older workers.
Unsurprisingly, younger workers had lower rates of access, takeup, and participation in workplace retirement plans. Many of these workers may still be in school or developing workplace experience and skills that will lead to increased access and participation later in life. At the same time, younger workers had limited improvement in their savings’ benchmarks from 1998 to 2012. However, the older group had marked increases in all three measures of savings. This last finding is encouraging given that, as noted above, workers bear the burden of retirement security with the demise of defined benefit pensions.
The adoption and rise of automatic enrollment is likely a factor contributing to increases in takeup and participation over time. Younger workers may see retirement as far off and a low financial priority compared to saving for a house or paying off student loans. Being automatically enrolled may overcome the inertia many young workers face in beginning to save for retirement, increasing their participation in plans and improving their long-term financial security.
Methodology
This chartbook uses the most recent available retirement-related data from the U.S. Census Bureau Survey of Income and Program Participation (SIPP), a multiple cross-sectional and longitudinal study of various economic topics. Specifically, it relies on data from the Wave 11 topical module focused on retirement savings plans conducted in 2012, using participants from the 2008 panel. These data are compared to similar data from the 1996 panel using Wave 7 conducted in 1998. Data from the 1984 panel are also included.21 However, the data aren’t directly comparable to later panels due to changes in the survey questionnaire. The sample includes 18- to 31-year-old private sector full-time employees who were not self-employed, agricultural workers, or in the armed forces at the time of the survey (n = 3,613 for the 1984 panel, n = 5,807 for the 1996 panel, and n = 6,619 for the 2008 panel).22 We identify two main types of employer-sponsored retirement plans: defined benefit (in which the employer primarily contributes to the fund) and defined contribution plans (in which the employee primarily contributes to the fund). Because respondents did not explicitly state whether their employer offered either of these categories, we construct these categories based on various characteristics.23
Data were weighted using person-level weights developed by SIPP. Tests of significance were used appropriate for variable type; for example, categorical data were analyzed using chi-square tests.
Endnotes
- Broadly, access measures whether a respondent reported working for an employer that sponsored a retirement plan for any of its employees. See the methodology for a breakdown of how SIPP determined access to defined contribution and defined benefit plans. While the data in this chartbook are drawn solely from SIPP, previous work linking SIPP data to administrative records has shown that survey respondents may underreport their access to and participation in workplace retirement plans. See Irena Dushi, Howard M. Iams, and Jules Lichtenstein, “Assessment of Retirement Plan Coverage by Firm Size, Using W-2 Tax Records,” Social Security Bulletin 71, no. 2 (2011), https://www.ssa.gov/policy/docs/ssb/v71n2/v71n2p53.html.
- Chi-square tests show significant differences in access to defined contribution plans for workers ages 18-24 at p < 0.05 and for workers ages 25-31 at p < 0.001. There are also significant differences in access to defined benefit plans for workers ages 18-24 and ages 25-31 at p < 0.001.
- Employee Benefit Research Institute, “FAQs About Benefits—Retirement Issues: What Are the Trends in U.S. Retirement Plans?,” accessed March 15, 2018, https://www.ebri.org/publications/benfaq/index.cfm?fa=retfaq14.
- Chi-square tests show significant differences in takeup of defined contribution plans among workers ages 25-31 and for defined benefit plans for workers ages 18-24 and 25-31 at p < 0.05. There were no significant differences in takeup of defined contribution plans for workers ages 18-24.
- Pension Rights Center, “Automatic Enrollment in 401(k)s,” accessed Jan. 30, 2018, http://www.pensionrights.org/issues/legislation/automatic-enrollment-401ks.
- Brigitte C. Madrian and Dennis F. Shea, “The Power of Suggestion: Inertia in 401(k) Participation and Savings Behavior,” The Quarterly Journal of Economics 116, no 4 (2001): 1149–87, https:// academic.oup.com/qje/article-abstract/116/4/1149/1903159.
- Chi-square tests show significant differences for participation in defined contribution plans for workers ages 25-31 at p < 0.001. There were no significant differences for the other groups.
- Chi-square tests show significant differences in access to retirement plans for men ages 25-31 at p < 0.05. There were no significant differences for the other groups.
- Bureau of Labor Statistics, “Employment Projections: Civilian Labor Force Participation Rate, by Age, Sex, Race, and Ethnicity,” last modified Oct. 24, 2017, https://www.bls.gov/emp/ep_ table_303.htm.
- Eleanor Krause and Isabel V. Sawhill, “What We Know—and Don’t Know—About the Declining Labor Force Participation Rate,” Brookings Institution, Social Mobility Memos, Feb. 3, 2017, https://www.brookings.edu/blog/social-mobility-memos/2017/02/03/what-we-know-and-dont-know-about-the-declining-labor-force-participation-rate.
- Chi-square tests show significant differences in takeup of available retirement plans for women ages 25-31 at p < 0.001. There were no significant differences for the other groups.
- Chi-square tests show significant differences for participation in retirement plans for men and women ages 25-31 at p < 0.05 and p < 0.001, respectively. There were no significant differences for the other groups.
- Chi-square tests show significant differences for access to retirement plans for white workers ages 25-31 at p < 0.05. There were no significant differences for the other groups.
- Chi-square tests show significant differences for takeup of retirement plans for white workers and those workers classified as “other” race/ethnicity ages 25-31 at p < 0.05. There were no significant differences for the other groups.
- Chi-square tests show significant differences for participation in retirement plans for white workers and those workers classified as “other” race/ethnicity ages 25-31 at p < 0.001 and p < 0.05, respectively. There were no significant differences for the other groups.
- The Pew Charitable Trusts, “Who’s In, Who’s Out: A Look at Access to Employer-Based Retirement Plans and Participation in the States” (2016), 8, http://www.pewtrusts.org/~/media/assets/2016/01/ retirement_savings_report_jan16.pdf.
- Chi-square tests show no significant differences by age and education groups.
- Chi-square tests show significant differences for takeup of retirement plans for workers with at least a bachelor’s degree ages 18-24 and workers with a high school degree or less ages 25-31 at p < 0.05, and workers ages 25-31 with at least a bachelor’s degree at p < 0.001. There were no significant differences for the other groups.
- Chi-square tests show significant differences for participation in retirement plans for workers ages 25-31 with a high school diploma or less and for those with at least a bachelor’s degree at p < 0.05 and p < 0.001, respectively. There were no significant differences for the other groups.
- Plan balance values were adjusted for inflation to represent 2012 dollars.
- These data were chosen for comparison for workers ages 18-31. They are intended to illustrate how today’s young workers compare to previous generations at similar ages. The Employee Benefit Research Institute presents data from multiple waves of SIPP from 1979 to 2012 that provide additional information about the changes over time in retirement plan access and participation. See Craig Copeland, “Retirement Plan Participation: Survey of Income and Program Participation (SIPP) Data,” Employee Benefit Research Institute, Notes 34, no. 8 (2013): 2–7, https://www.ebri.org/pdf/notespdf/EBRI_Notes_08_Aug-13_RetPart-CEHCS1.pdf.
- Respondents who said they worked 35 hours or more a week during the reference period were considered full-time workers. Those who used their business as a reference point for the topical module instead of using their job were considered to be self-employed.
- Defined benefit and defined contribution categories were determined by Pew based on a number of characteristics surrounding respondents’ primary pension plan. As part of the survey, respondents were asked about plan type (“plan based on earnings and years on the job” and “cash balance plan” were initially coded as defined benefit plans, and “individual account plan” was coded as defined contribution plans). Plan type was coded as a defined benefit plan if it was reported that participation in Social Security would affect the plan benefit. We then coded plan type as a defined contribution plan if the primary plan allowed tax-deferred contributions as well as one of the following: employers’ contributions depended on participants’ own contributions, participants had the ability to choose how money was invested, or they had taken or had the ability to take a loan from their plan. We additionally coded a plan type as a defined contribution plan if respondents answered that the plan was like a 401(k). Finally, respondents were additionally asked clarifying questions to determine that they did not actually have access to employer- sponsored plans. We used their responses to these questions of whether the sponsored plan is tax-deferred, like a 401(k), to code plan types to defined contribution plans. Because of these two lines of questions, takeup was determined based on whether respondents said they participated in the primary plan and whether they answered the applicable follow-up questions. If answers to the primary and follow-up questions were inconsistent, we used answers to the primary questions. Participation is based on takeup. The Stata code is available upon request.


ADDITIONAL RESOURCES

Fact Sheet

Podcast