How Income Volatility Interacts With American Families’ Financial Security
An examination of gains, losses, and household economic experiences

Overview
The balance sheets of American households are showing modest improvement, as are people’s attitudes about their financial health. The Census Bureau found that the median household income increased by 5.2 percent from 2014 to 2015, with gains across all income levels.1 Further, more Americans report feeling financially secure, and fewer say they are unprepared for the unexpected.2
However, problems persist: Less than half (46 percent) of respondents to The Pew Charitable Trusts’ 2015 Survey of American Family Finances reported making more than they spend, and only 47 percent said they had consistent and predictable household bills and income month to month.3 In addition, recent work by the U.S. Financial Diaries and JPMorgan Chase Institute has highlighted the high levels of monthly income swings that families face.
Previous research by Pew that studied longer-term, two-year income shifts showed that many families face significant changes in income: As of 2011, 43 percent of families endured swings of more than 25 percent.4 Such fluctuations, also called income volatility, make it difficult for families to plan, pay regular expenses, save, or pay down debt.5 But little research has investigated and compared the impact of changes in year-to-year income on American families, including those of different incomes, races, education levels, and ages. Moreover, data dividing volatility into gains and losses are scarce, making it difficult to examine how families adapt to these different experiences; the research that does exist has focused largely on income loss because it is so detrimental to family financial health.
This analysis aims to fill that gap by exploring what, if any, differences exist between families that experienced income volatility and those that did not, as well as between those that had income gains and those that had losses, and by examining the relationship between income volatility and overall family financial security.
Key Terms
This brief uses a variety of measures to discuss income change:
- Income volatility: A year-over-year change in annual income of 25 percent or more.
- Income gain: An increase of 25 percent or more in annual income from 2014 to 2015.
- Income loss: A decrease of 25 percent or more in annual income from 2014 to 2015.
- Stable income: Income shifts of less than 25 percent year over year.
Generations are defined as follows:
- Silent generation: Born between 1928 and 1945.
- Baby boomers: Born between 1946 and 1964.
- Generation Xers: Born between 1965 and 1980.
- Millennials: Born between 1981 and 1997.*
* Age cohorts are defined using thresholds from the Pew Research Center. At the time of the 2014 survey, millennials were ages 18 to 33, Gen Xers were 34 to 49, baby boomers were 50 to 68, and members of the silent generation were 69 to 86.
This analysis found that:
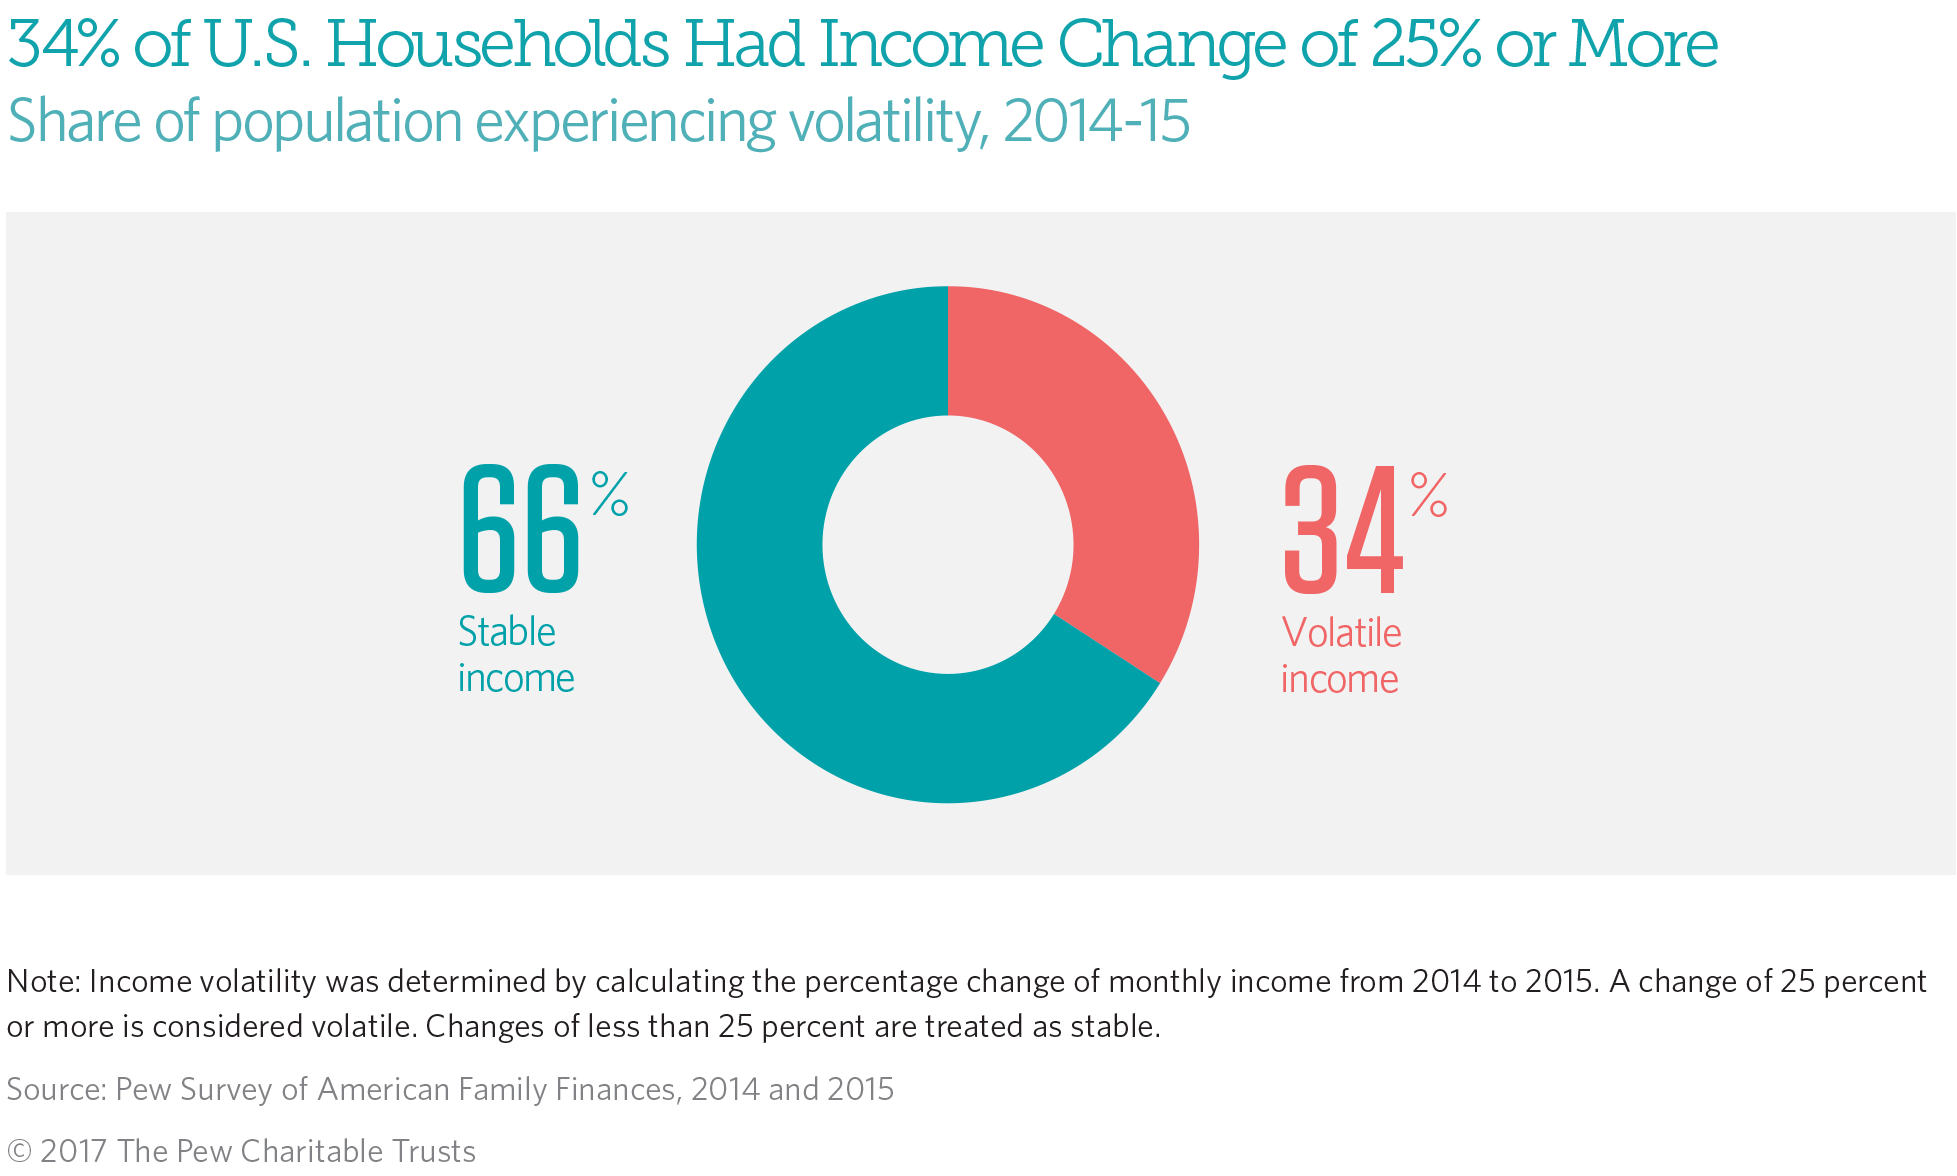
- Year-over-year income volatility is common among American households. More than a third (34 percent) of households experienced large changes from 2014 to 2015.
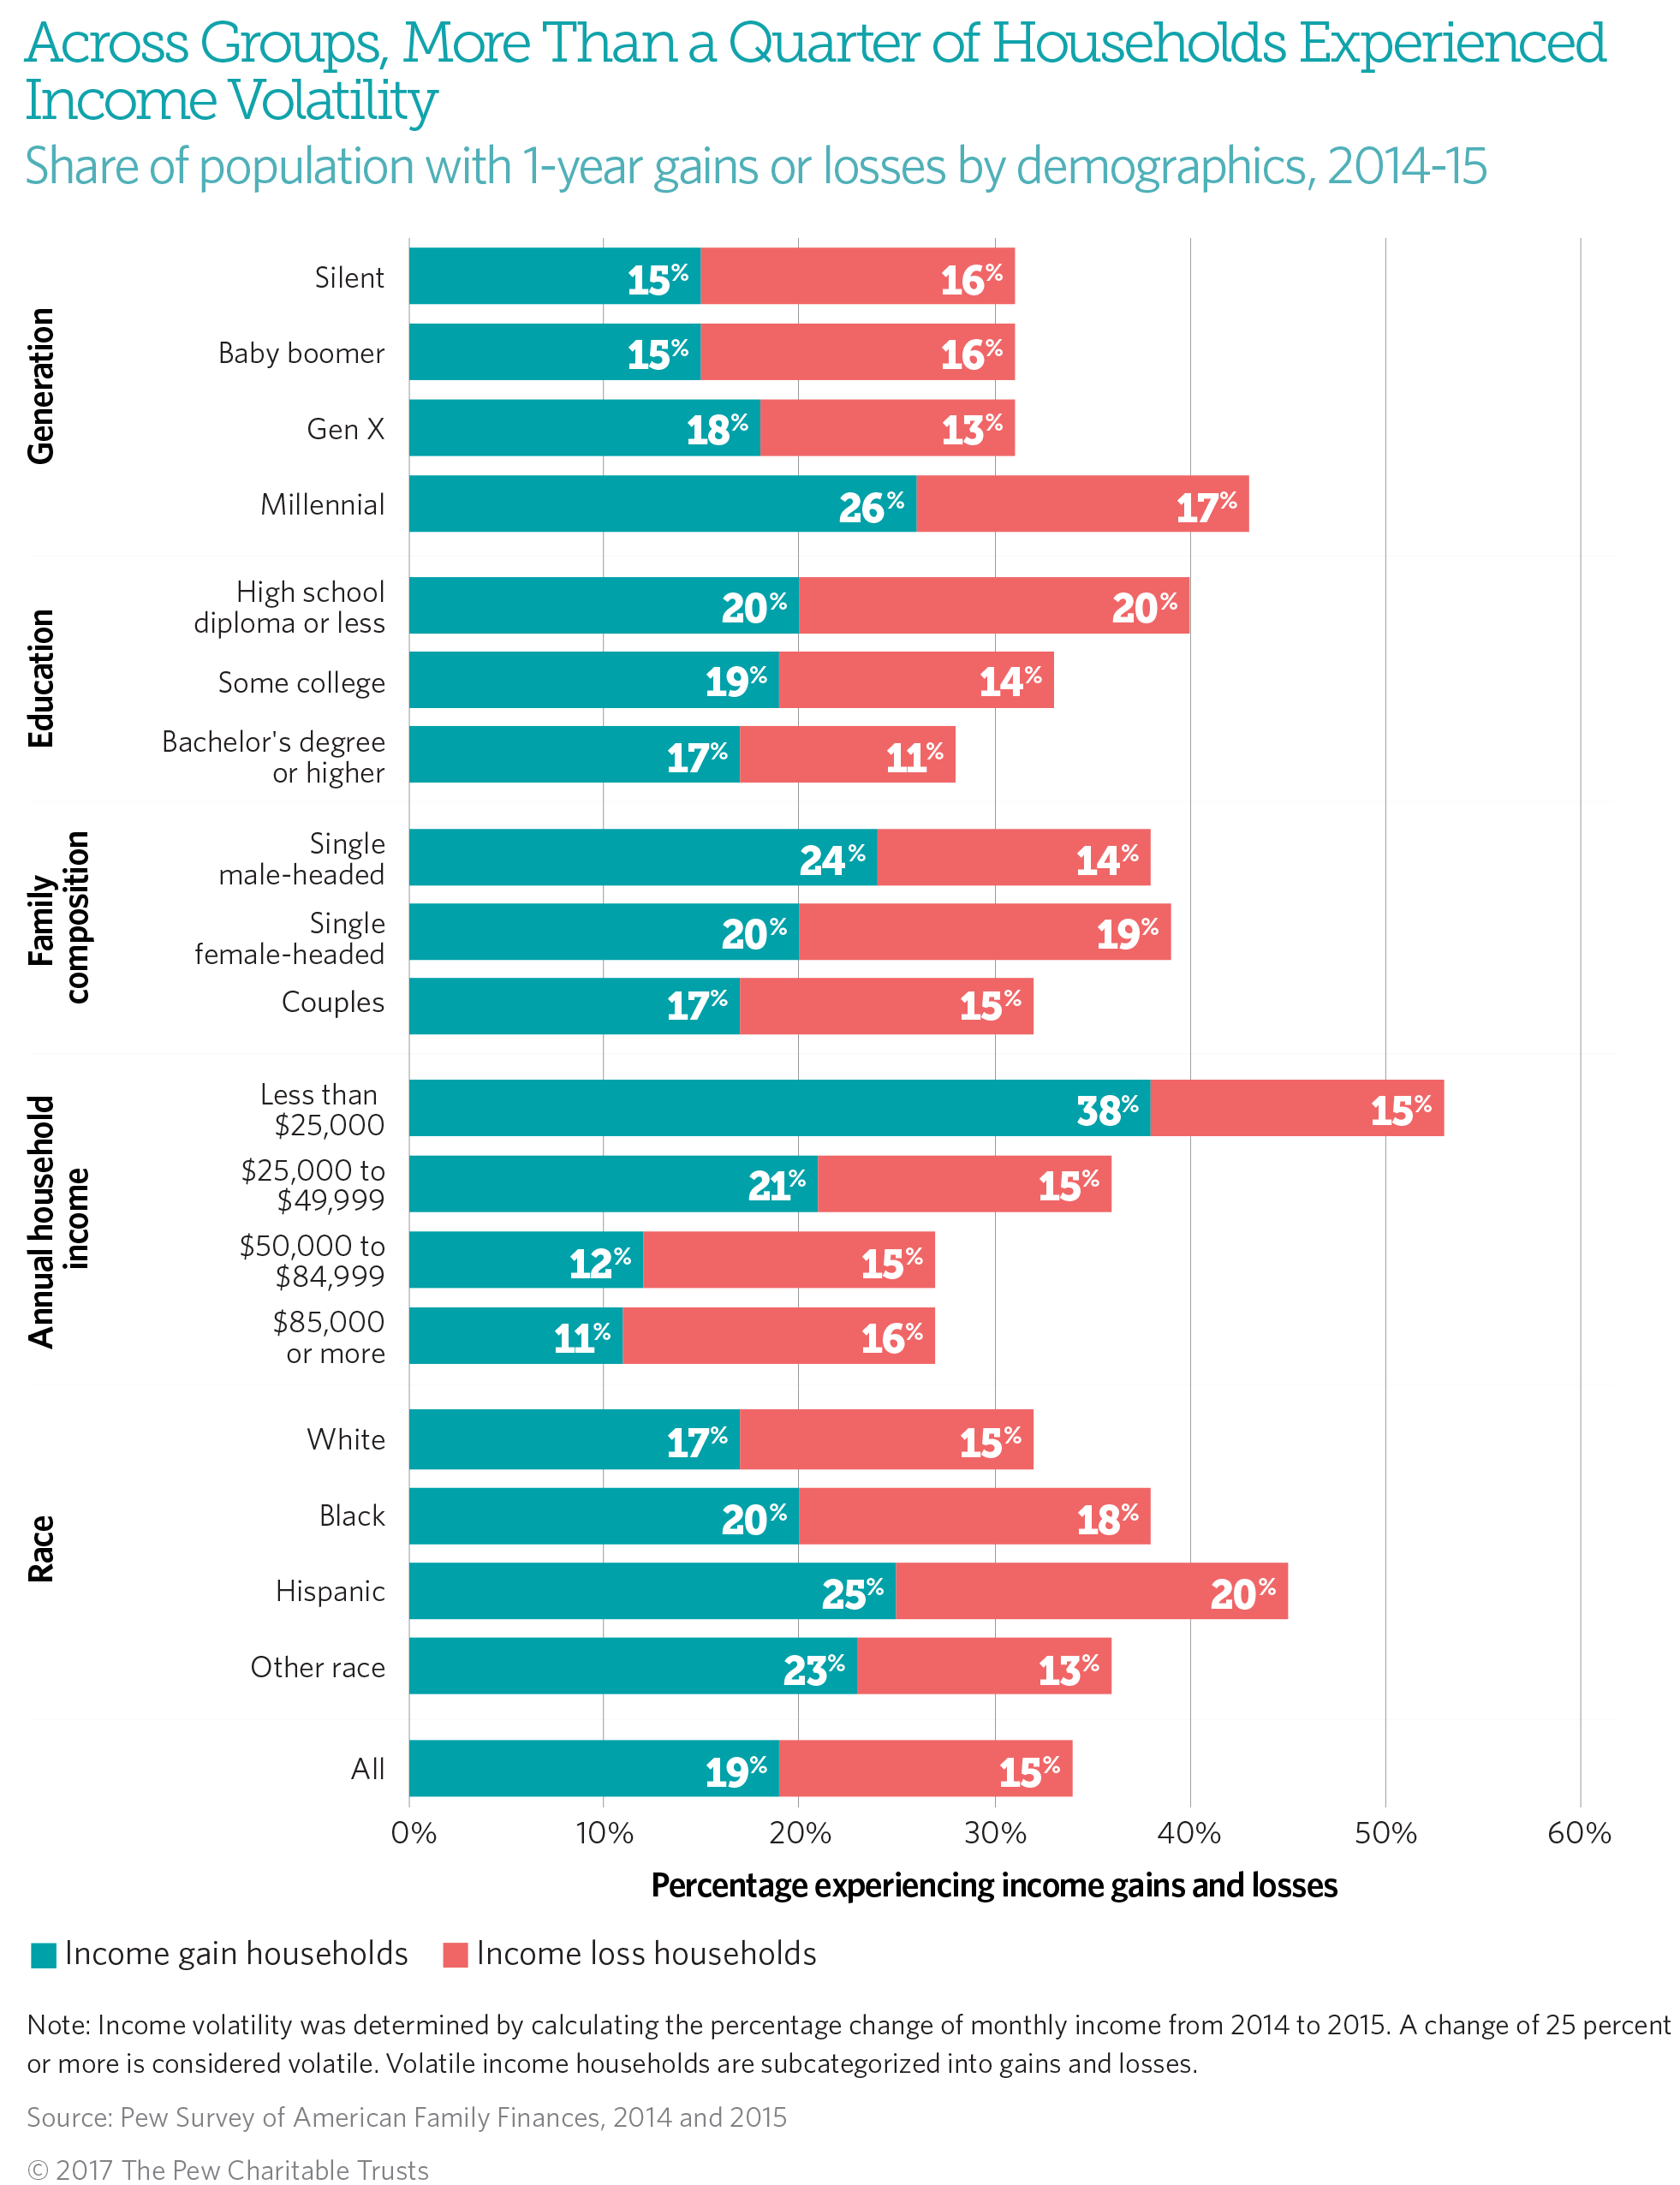
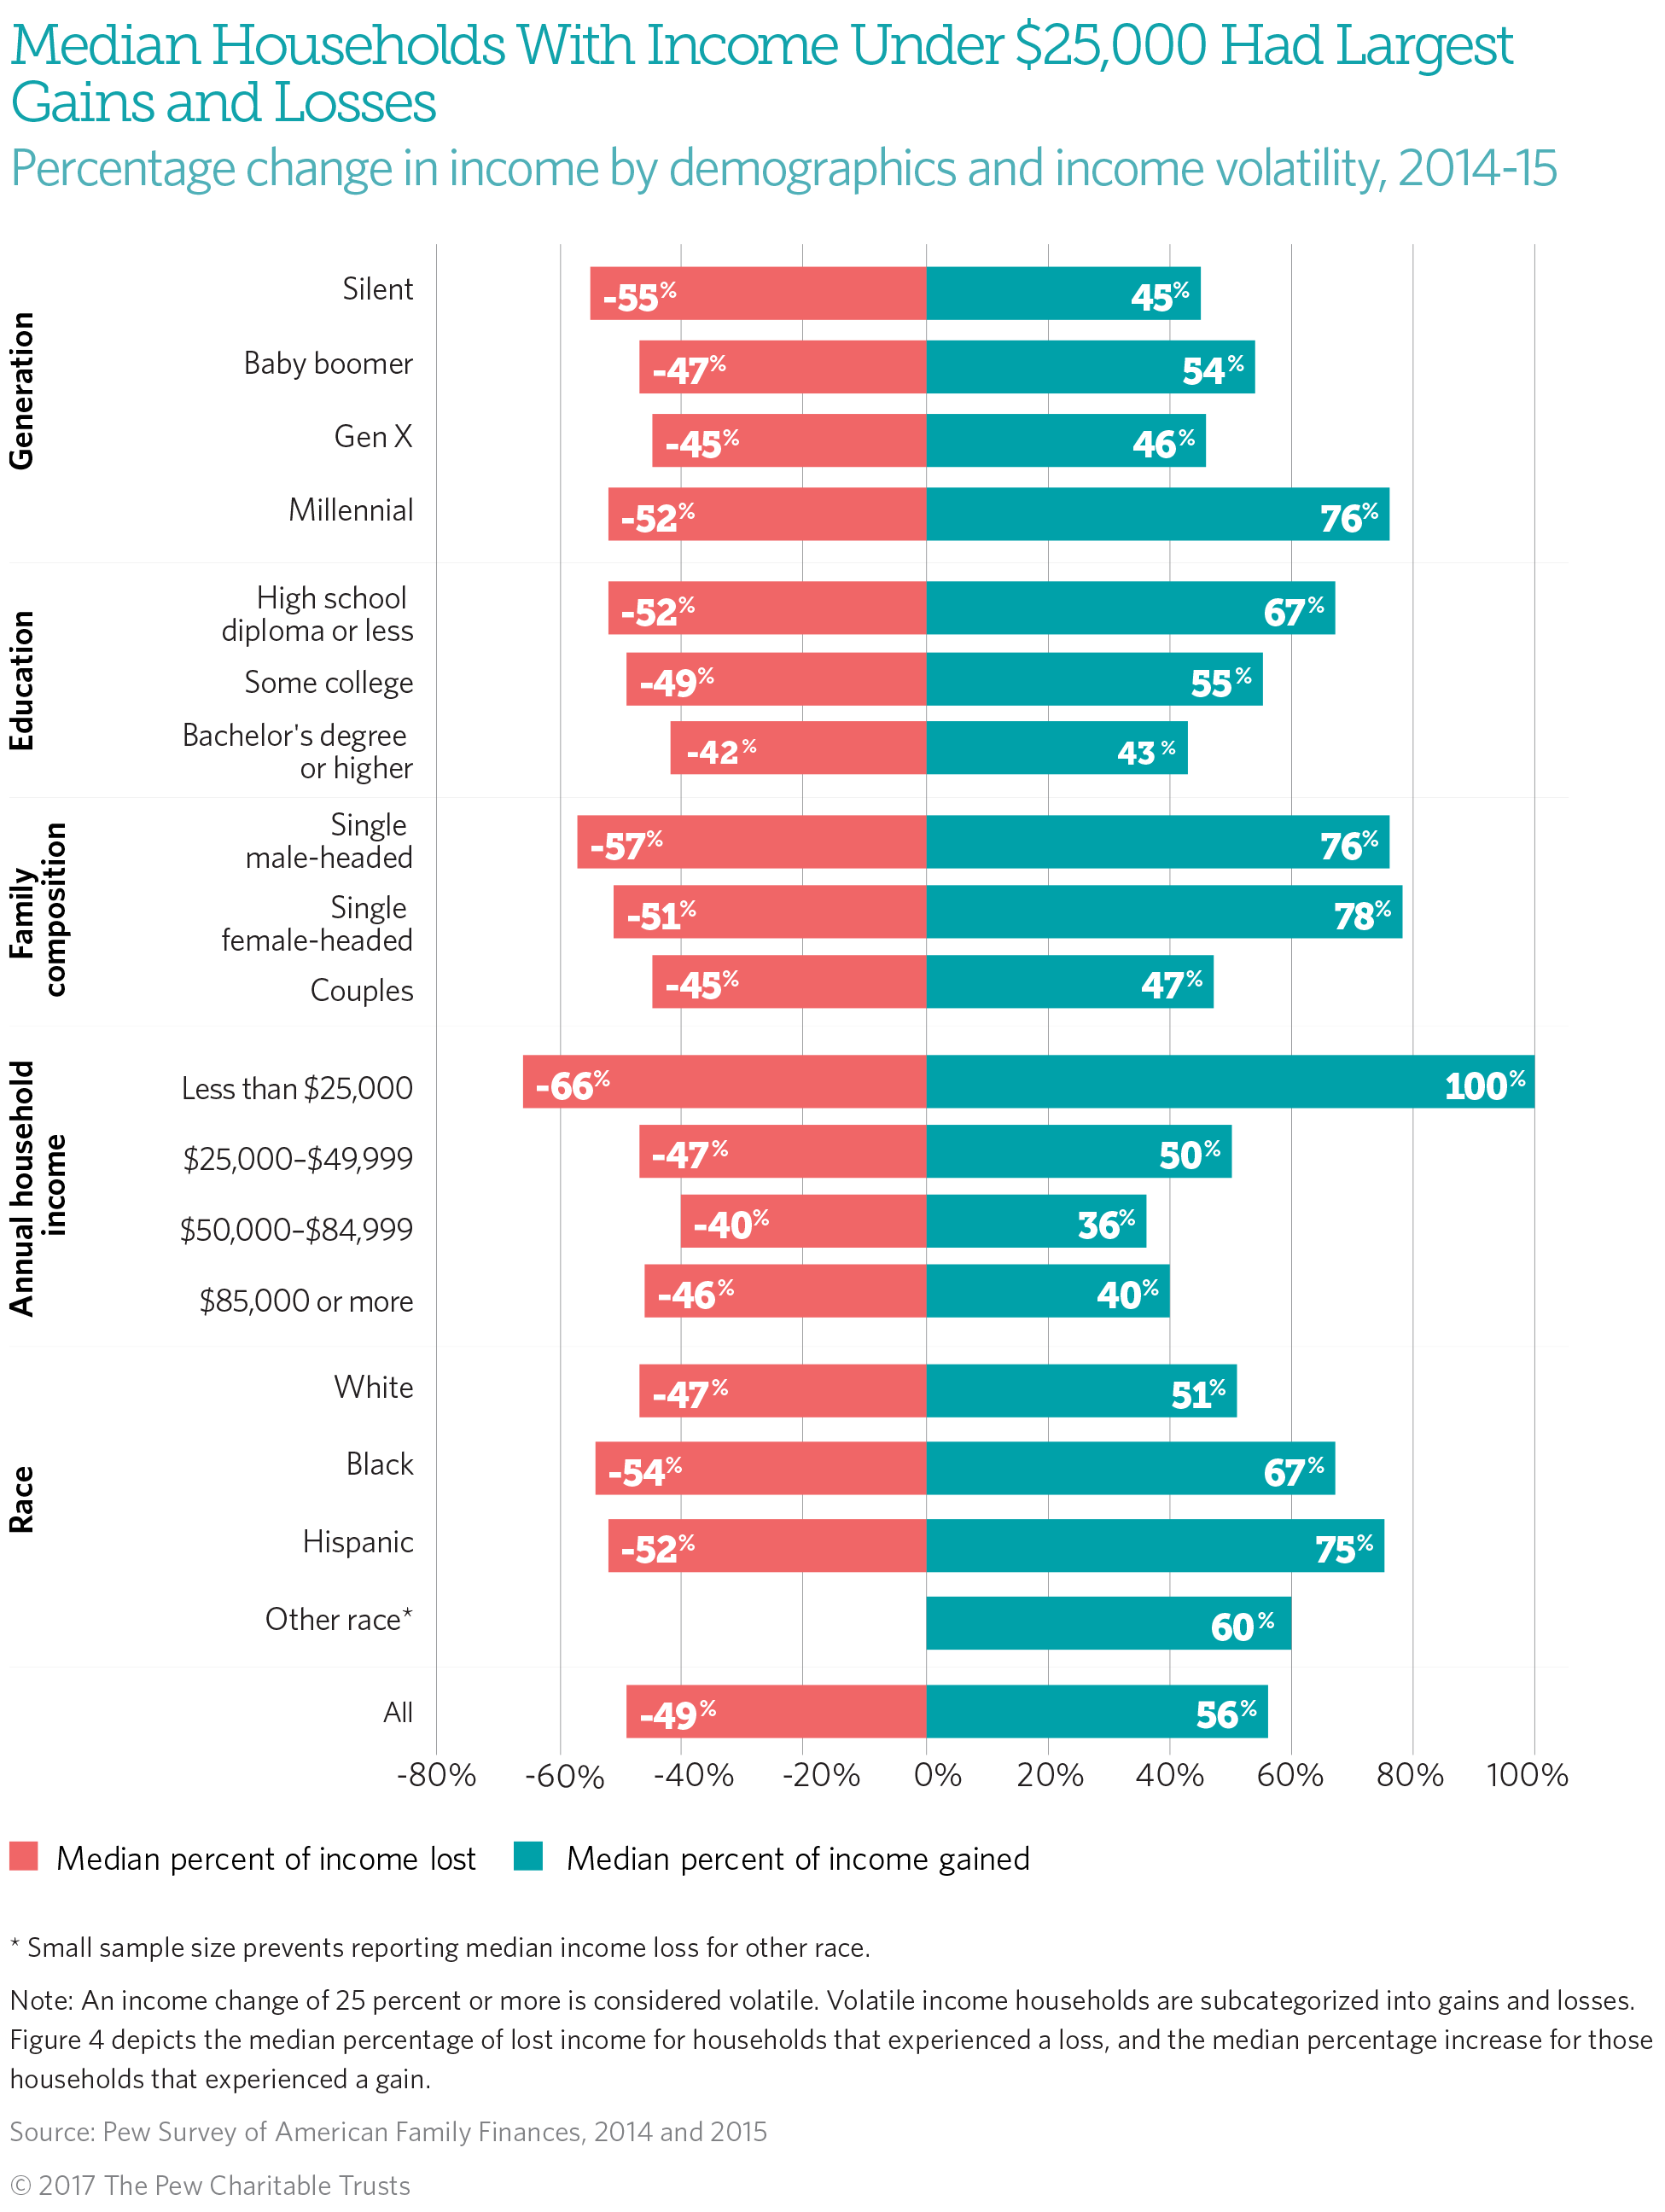
- Income volatility exists across demographic groups but is particularly acute for certain populations. At least 1 in 4 households across all income, educational attainment, race, and other groups experienced substantive income shifts. But 38 percent of families with incomes below $25,000 experienced a gain, while 20 percent of Hispanic households and those with a high school diploma or less experienced an income loss.
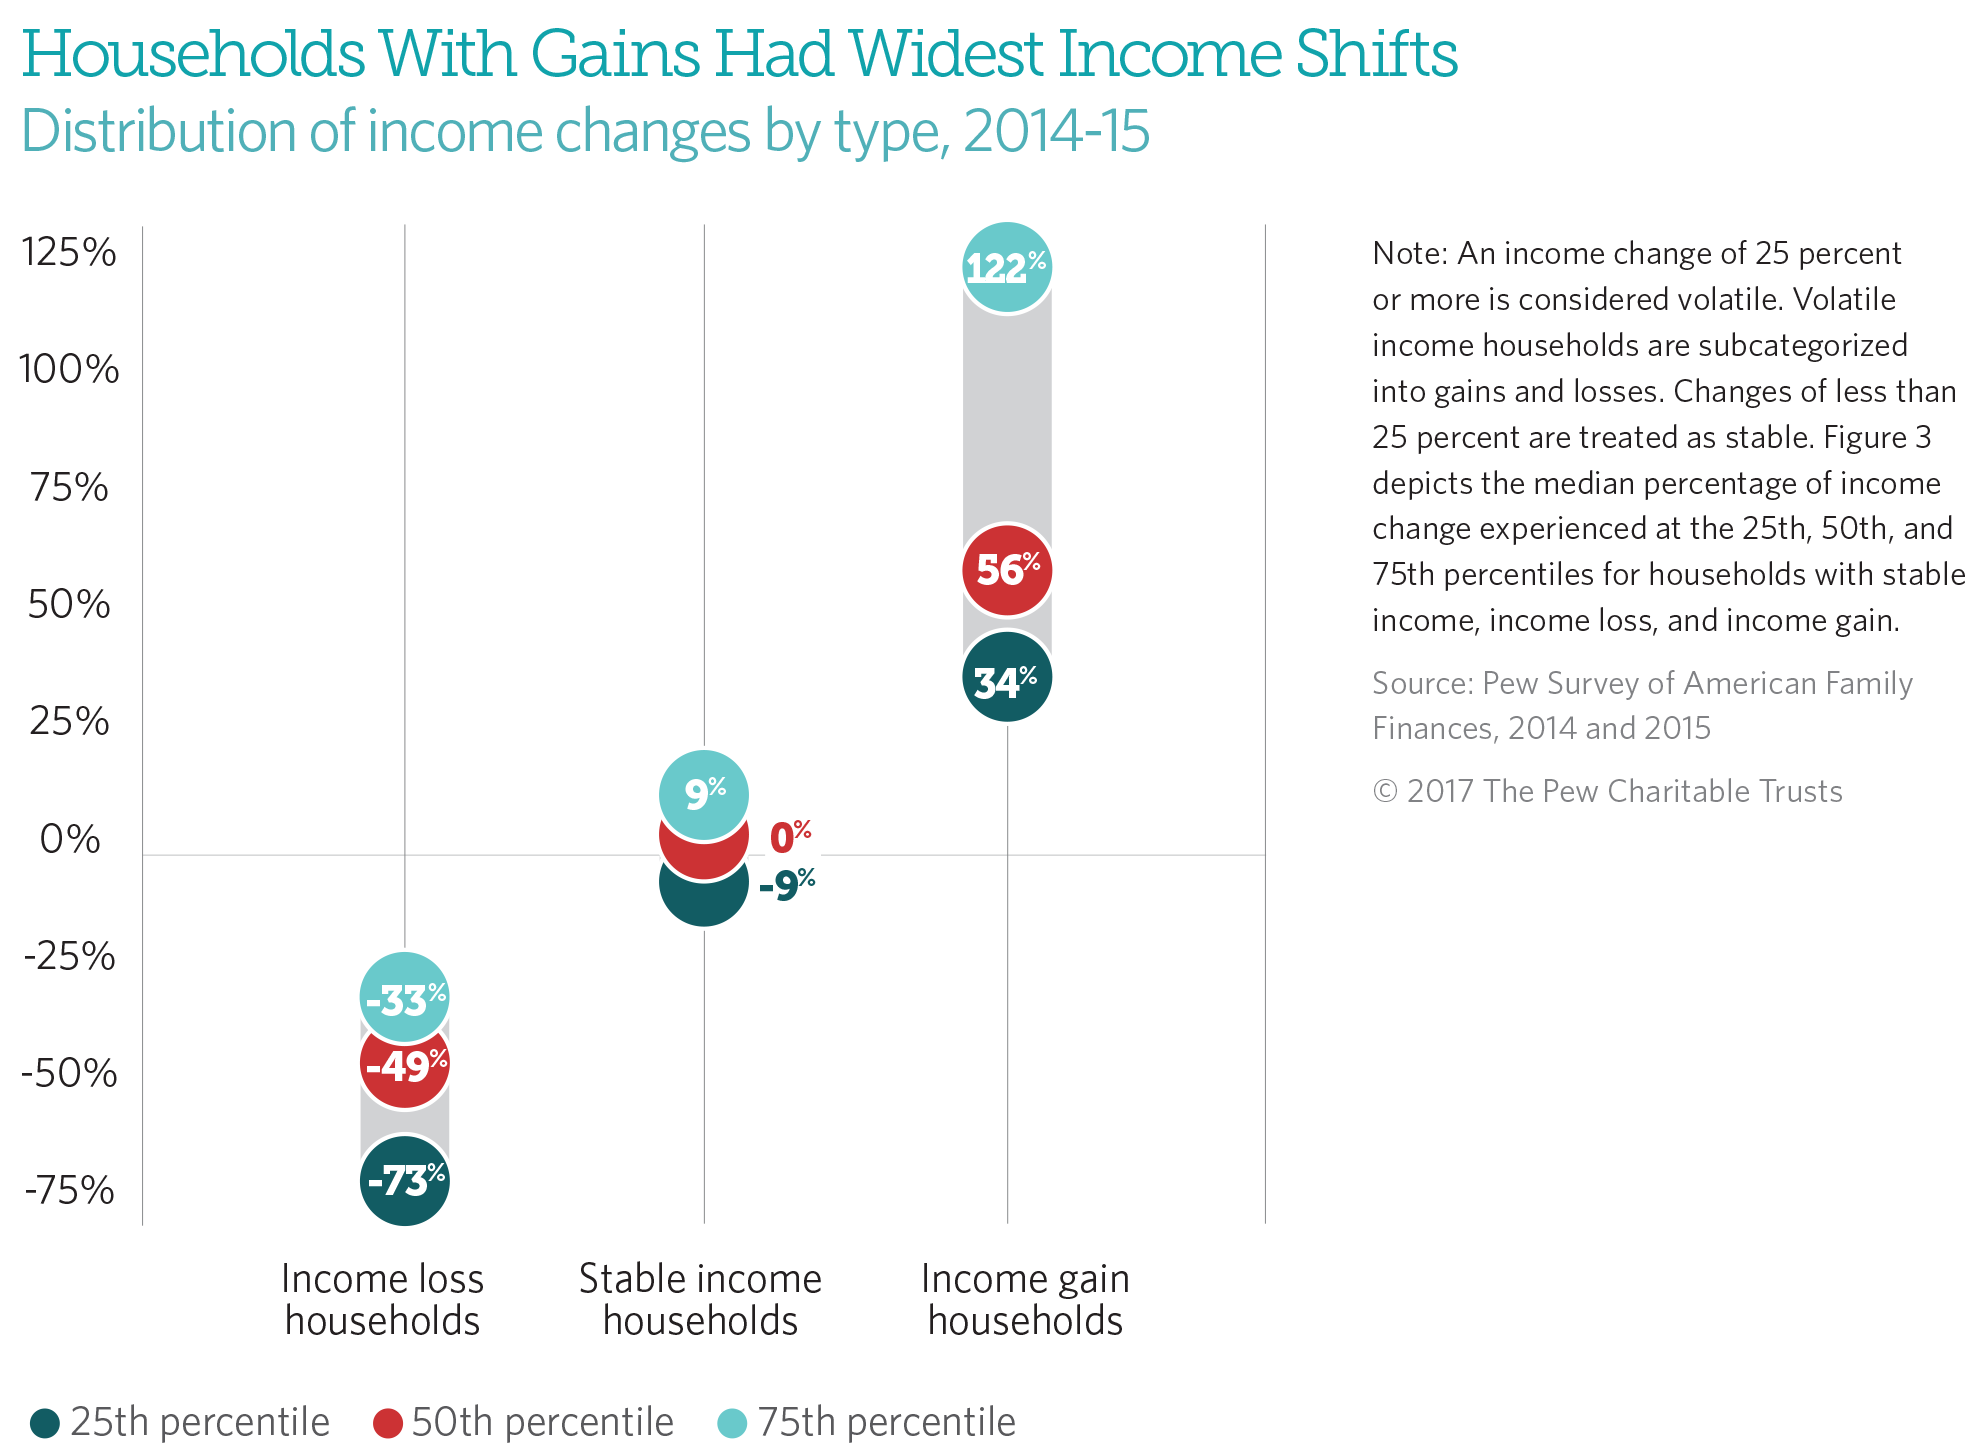
- Volatility is dramatic: At the median, the incomes of households with losses declined by 49 percent, while families with gains boosted their incomes by 56 percent. The median household income gain was $20,500 and the median income loss was $25,000.
- Families that experience income volatility—whether a gain or loss—report lower financial well-being and less savings than those with stable income. Respondents from families with stable income are more likely than those with gains or losses to report that their household probably or certainly could come up with $2,000 for an unexpected need and to say they had no financial shortfalls in the two years studied.
Although income volatility is more prevalent among certain households, these findings show that changes in annual income can affect all types and that despite improving macroeconomic indicators, many Americans still feel financially precarious. Understanding the factors that have an impact on family balance sheets can help policymakers develop better programs and policies to improve short-term economic stability and, in turn, improve household financial security.
About the data
The analysis presented here uses data from Pew’s Survey of American Family Finances, first conducted in 2014 with a follow-up with the same respondents a year later. This is the first in a series of papers to draw on both sets of survey data.
Year-over-year income volatility is common
For many families, household income is not steady.6 Fluctuations typically occur during changes in household composition, such as marriage or childbirth, or transitions such as retirement, and these changes can be anticipated and planned for. However, some income shifts are not entirely expected. For example, a breadwinner may face diminished work hours or become ill. Alternately, a family member may receive a promotion or a bonus.7 In addition, the size of these income dips and spikes or whether they will be one-time, repeated, or ongoing occurrences may not be known in advance. Among many factors that inhibit household financial stability, large income swings may make it challenging to plan and budget and may leave families feeling less financially stable.
From 2014 to 2015, although the median U.S. household had stable income, more than a third (34 percent) experienced income volatility, which is consistent with other research findings.8
© AP Photo/Lynne Sladky
Income volatility is particularly acute for certain demographic groups
Income volatility was not confined to households at any single rung of the income ladder or education level or to those in a specific racial or ethnic group. At least 1 in 4 households across demographic groups experienced income volatility. However, it was most common among certain populations: In the years studied, at least 4 in 10 respondents who identified as Hispanic, millennial, having a high school diploma or less, or having incomes below $25,000 experienced income volatility. Households with these demographic characteristics tend to be overrepresented in lower-income groups generally.9 Further, because volatility is measured as percentage change, they also had the lowest threshold to experience income volatility in terms of real dollars. For example, a family making $80,000 would need an income change of $20,000 to qualify as volatile, but one making $10,000 would need a change of just $2,500.10 However, because that lower-income household also tends to have few assets and little to no savings, it often has no financial cushion, making income volatility especially acute.
Overall, households across demographic groups were more likely to experience gains than losses.11 However, like volatility generally, certain groups experienced these specific changes at different rates: 20 percent of Hispanic households and those with a high school diploma or less experienced an income loss, while 38 percent of families with incomes of less than $25,000 experienced a gain.
Volatility is dramatic
The magnitude of income swings is an important consideration for family financial security. The 25 percent baseline for volatility in this study is already high, but the typical household that experienced volatility endured even more pronounced changes.12 Specifically, the median household with a loss saw its income decrease by 49 percent year over year, and the median household with a gain had an increase of 56 percent. At the median, families with gains added $20,500 and those with drops lost $25,000.
However, the data demonstrate that, across demographic groups, the size and scale of income changes varied sharply. The median single (male- or female-headed) and millennial households and those with incomes under
$25,000 had gains exceeding 75 percent. At the median, black households, those making less than $25,000, and single male-headed households had some of the largest losses of the groups studied and were also among the most likely to experience income volatility in general.
These difficulties are exacerbated by families’ financial realities. In 2014, 57 percent of survey respondents said that their households were not financially prepared for the unexpected, and 55 percent reported spending as much as they made or more each month.13 Moreover, households across the income distribution had less slack in their budgets in 2014 than a decade earlier, and those in the lower third had fallen into the red, with expenditures outpacing income.14 With households already struggling to make ends meet, income volatility places yet another burden on families’ attempts to create a financial buffer.

© iStockPhoto
Families that experienced income volatility—whether a gain or loss—report lower financial well-being and less savings than those with stable income
Research exploring the implications of income volatility on household balance sheets and people’s perceptions of their financial well-being is limited. Pew’s survey asked respondents about the economic realities they face throughout the year, including financial shortfalls, such as missing a bill or housing payment, forgoing medical care or prescriptions, and tapping a retirement account to compensate for insufficient funds. Seventy-two percent of respondents from households with stable income said they did not experience any shortfalls in 2015, compared with 64 percent of those from households with income gains and 63 percent from those with losses. Similarly, families with stable income in 2015 were more likely than those with volatile income to report that they had savings and that their household probably or certainly could come up with $2,000 for an unexpected need.15
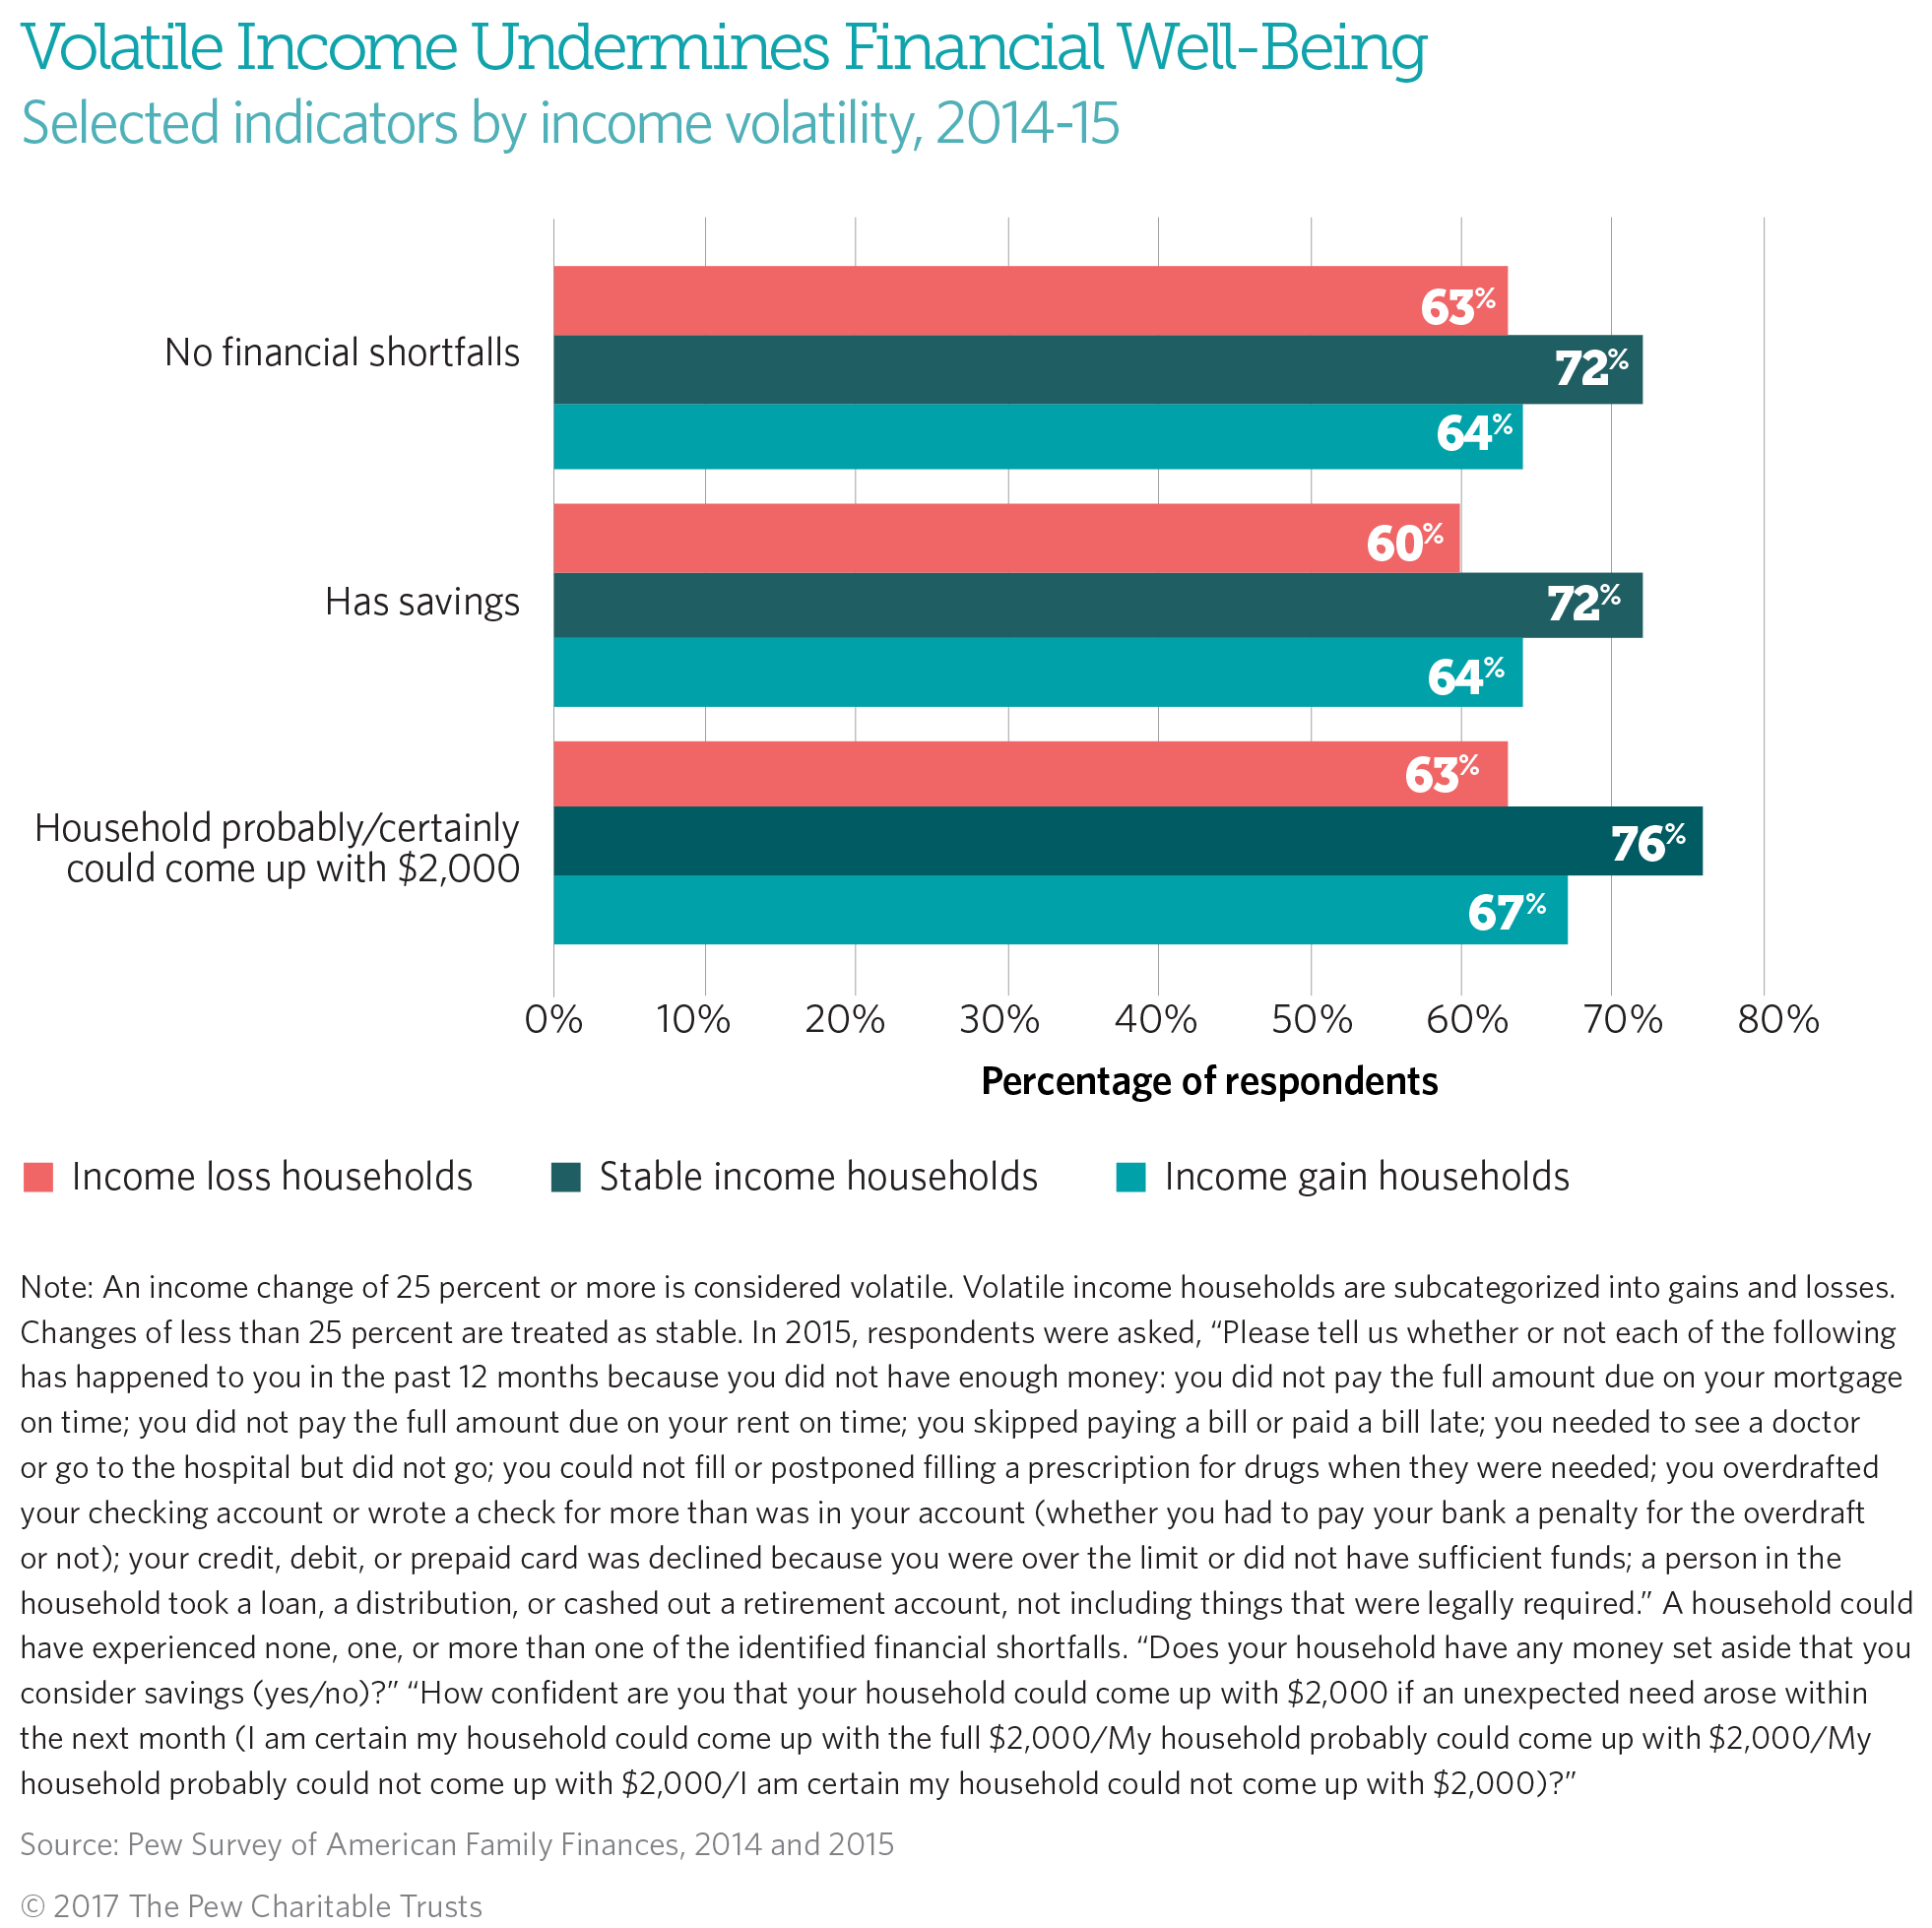
Seventy-two percent of respondents from households with stable income said they did not experience any shortfalls in 2015, compared with 64 percent of those from households with income gains and 63 percent from those with losses. Similarly, families with stable income in 2015 were more likely than those with volatile income to report that they had savings and that their household probably or certainly could come up with $2,000 for an unexpected need.
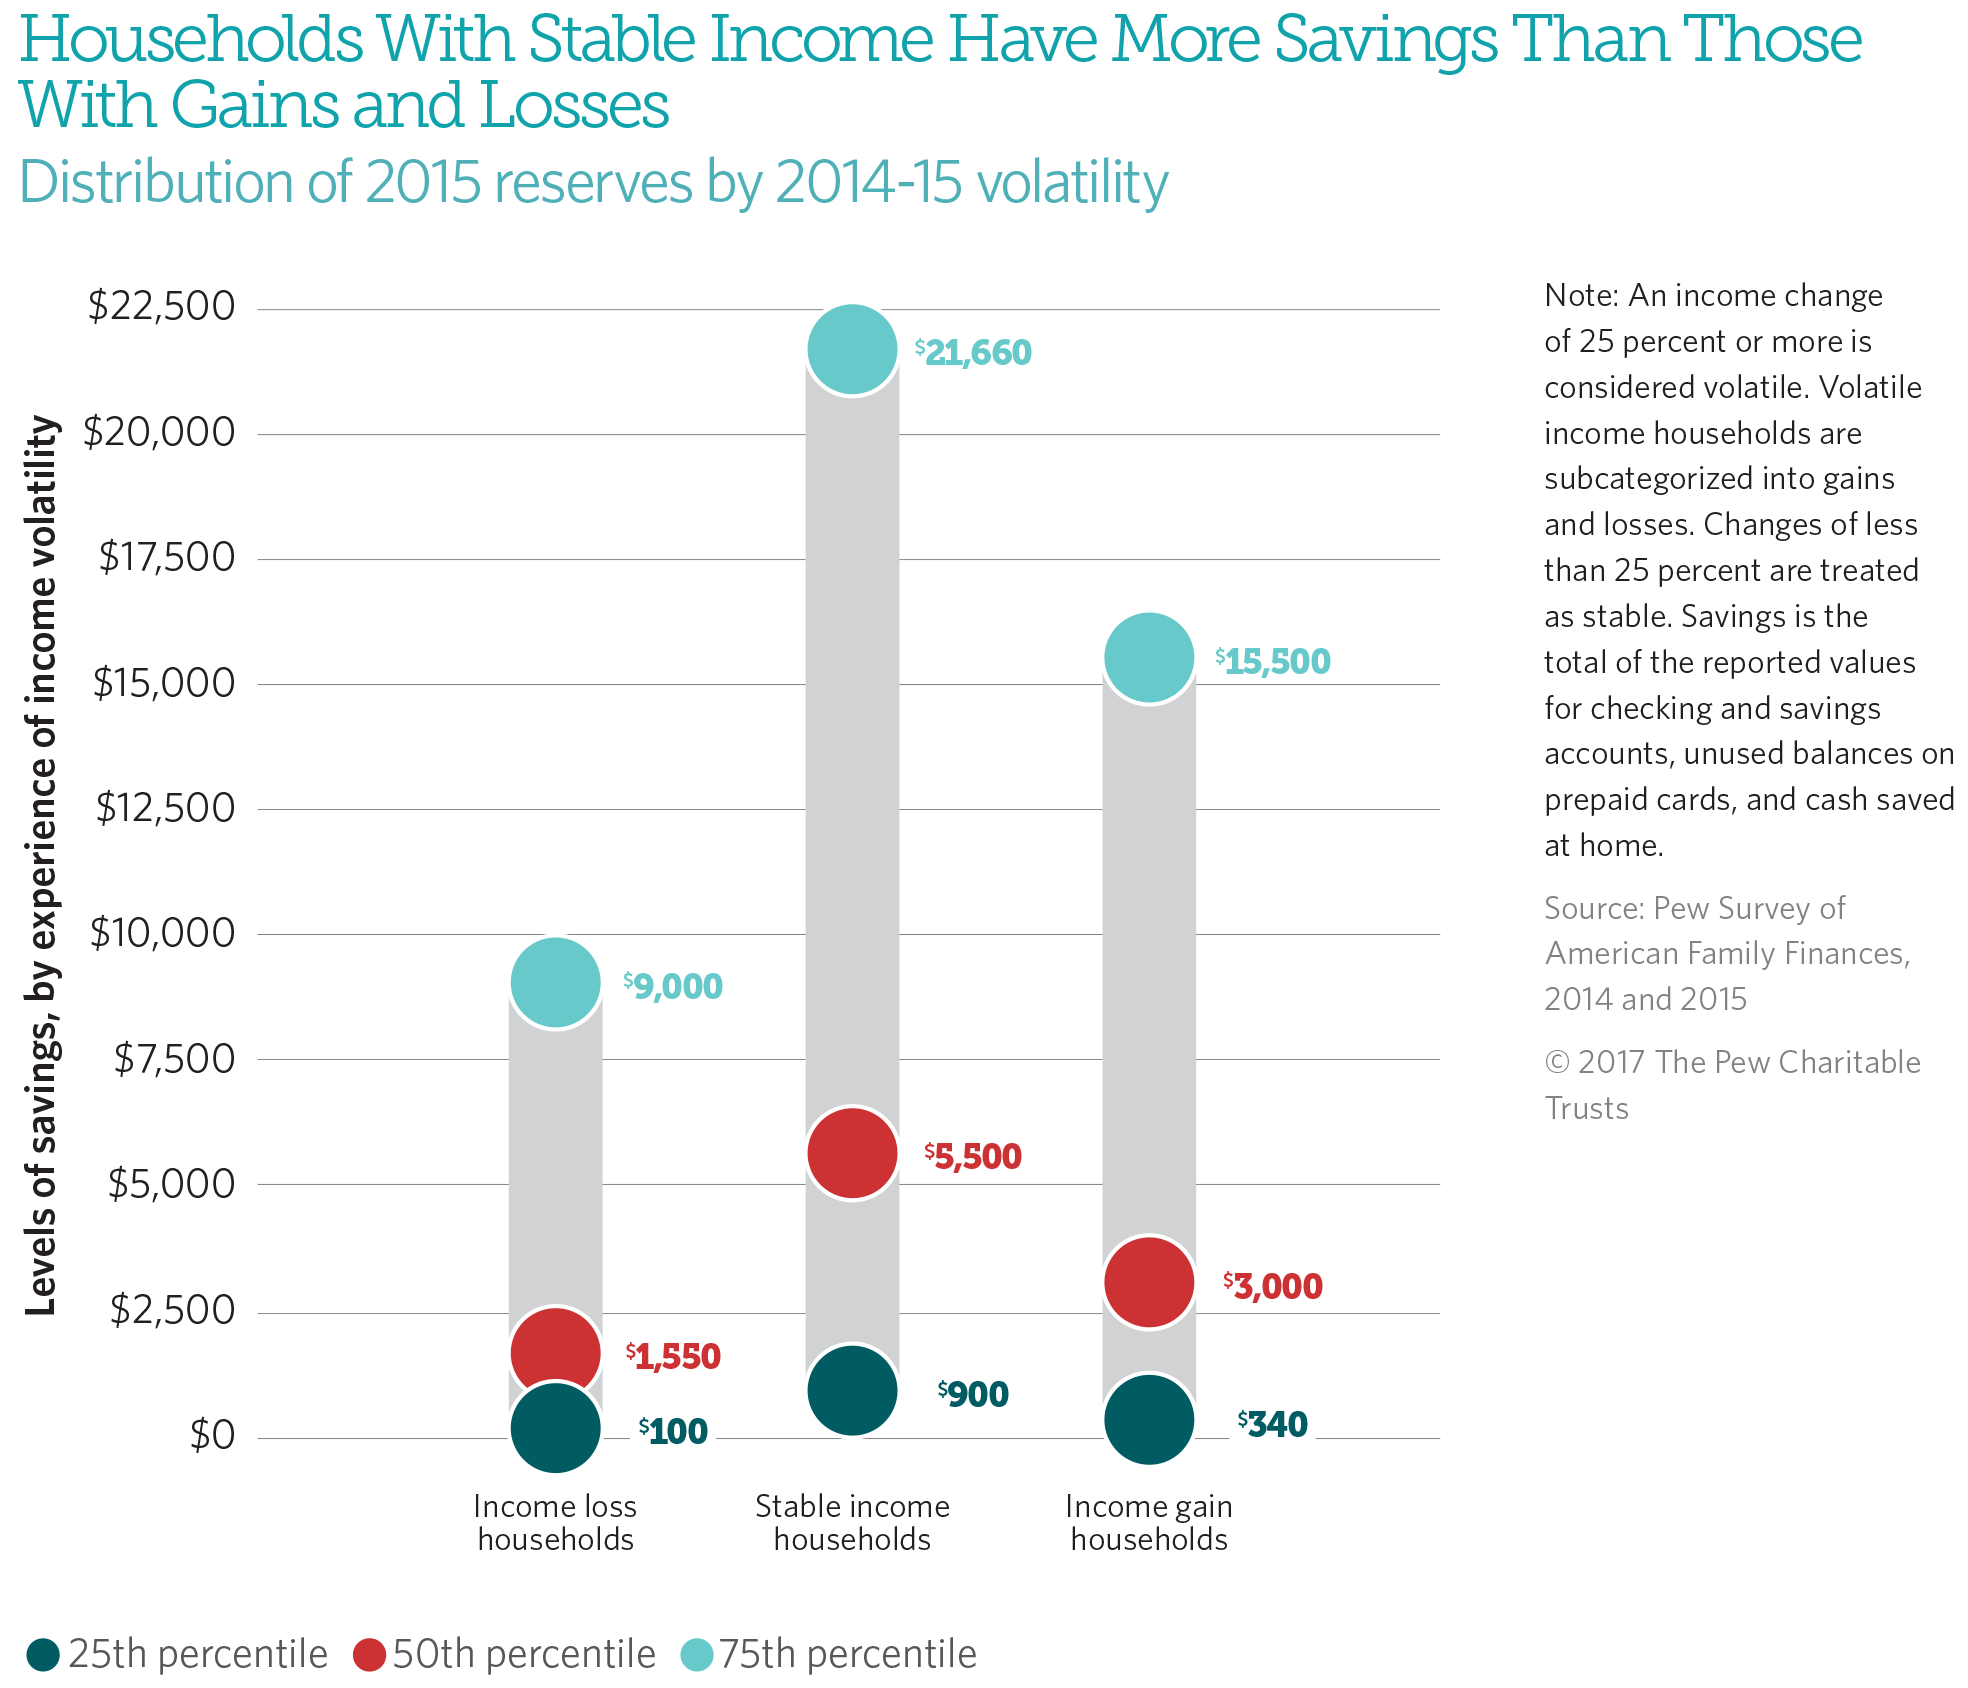
However, families with volatile income not only indicated more negative feelings about their financial situations than did those with stable income; they in fact had less money saved. In 2015, the typical household with an income loss had $1,550 in savings, and the typical household with a gain had $3,000. By comparison, the typical family with stable income had $5,500 saved. Previous Pew research indicated that the cost of the typical family’s most expensive shock—an unanticipated expense such as car or house repairs, illness, or a pay cut—is $2,000, meaning that, at the median, just one such event could wipe out most or all of the savings of a household with volatile income.16
With households already struggling to make ends meet, income volatility places yet another burden on families’ attempts to create a financial buffer.
These findings suggest that negative perceptions of financial security and lower savings levels are not reserved for households that suffer income losses, but rather are features of households with any income volatility, whether losses or gains. However, the data cannot establish volatility as the cause of the differences in household savings and feelings of financial well-being between respondents who experienced volatility and those with stable income. A host of factors not addressed by the survey could contribute to or explain families’ perceptions and savings habits.
Helping families cope with income volatility
As more data documenting the prevalence and severity of income volatility across diverse U.S. households become available, policy advocates, researchers, and organizations are exploring solutions to help families cope with unstable income.
Previous Pew work has addressed the importance of helping families with related problems, including how to understand the ebbs and flows of income and expenses and how to automate savings.17 To that end, financial technology (fintech) companies are developing applications that can make short-term saving easier. For example, one product helps individuals with inconsistent income create a more reliable income stream by automatically setting aside money from above-average paychecks to be used to boost resources when paychecks dip below average. Other products include a tool to help families identify small amounts of money that can be moved into savings to build a financial buffer against future volatility.18
But fintech is not the only option to mitigate the strains that income volatility places on families; experts have argued that employers can also be a part of the solution. The Federal Reserve Board’s Survey of Household Economics and Decisionmaking found that respondents’ most commonly cited reason for income volatility was an irregular work schedule.19 Panelists at a recent Pew event noted that employers could help improve income certainty by providing employees with advance notice of their hours and setting minimum hours so that workers can count on a base paycheck amount. In addition, employers could pay employees more frequently than the customary every two weeks, which would give workers more cash on hand and help reduce their reliance on payday loans or similar high-cost products for short-term fixes.20
Government also has a unique opportunity to make broad changes to address income volatility. For instance, advocates have suggested that the federal government could allow the creation of new savings products that households could access without penalty in times of need, such as the proposed retirement accounts with an attached “rainy day” fund that would allow families to draw upon savings without incurring early withdrawal fees.21 Further, Pew research has shown that adjustments to safety-net program eligibility requirements could help protect families from losing benefits after short-term upswings in income. This would, in turn, reduce the number of families moving in and out of programs such as the Supplemental Nutrition Assistance Program. Such churn is burdensome and costly to recipients and administrators.22
Some state and local governments have passed or are considering legislation to help employees address unpredictable hours. The issue has become more common in recent years with the advent of “just-in-time” scheduling software, which allows employers (typically in the retail and service industries) to determine the appropriate number of workers to match demand but leaves employees with little control over their hours worked.23 State and municipal efforts to help these workers include protections against retaliation for those requesting flexible or more predictable hours. Other strategies include guaranteed pay for those who show up but are sent home and guaranteed benefits.24 At the same time, to reduce employee turnover and increase workers’ financial security, a number of major retailers are ending on-call scheduling.25
Conclusion
Income volatility is widespread, with more than a third of American households facing annual income spikes and dips. Although the incidence and magnitude of the swings vary, income volatility is prevalent across demographic groups. Perhaps most surprising is that families that experience year-to-year income gains as well as losses express lower financial well-being and have less savings than households with stable income.
Further, income volatility can not only disrupt a household’s financial reality in the short term, but can also create lasting strain. Households that experience volatility have no assurance that their income will become less erratic or that they will recover from the large swings on their balance sheet. Research shows that among families that lost income year over year, half regained it within four years, but a third (34 percent) were still grappling with their losses a decade later.26
These findings clearly show that income volatility of any kind—not only losses—may have a profound effect on families’ sense of financial security. Policymakers, employers, researchers, practitioners, and advocates should consider steps to support greater income stability and household financial well-being.
In 2015, the typical household with an income loss had $1,550 in savings, and the typical household with a gain had $3,000. By comparison, the typical family with stable income had $5,500 saved.
Methodology
This analysis draws from the Survey of American Family Finances, commissioned by Pew. The first iteration of the survey was administered to a nationally representative panel between Nov. 6 and Dec. 3, 2014. The second iteration was administered to the same panel between Oct. 27 and Dec. 1, 2015. Including only respondents who answered both years and oversamples of black and Hispanic respondents, the total sample size was 5,661. Survey firm GfK collected the data on behalf of Pew and administered the computer-based questionnaire in English and Spanish. All reported data were weighted. For clarity of analysis, respondents who chose not to answer a question were excluded from the statistics generated for that item. As is frequently the case for computer-based surveys, missing data were most common when respondents failed to answer something they felt did not apply to them, such as “other” in a list of questions. Overall, item nonresponse was 2.2 percent for the 2014 survey and 1.5 percent for the one in 2015. Additional details about the survey and its methodology are available at www.pewtrusts.org/Survey-of-American-Family-Finances-Methodology.
The statistics presented in this brief include frequencies, cross tabulations, and medians. Income volatility was calculated using the percentage change in income from 2014 to 2015. To avoid dividing by zero, researchers set a monthly income floor of $250. Any income change of 25 percent or more is considered volatile. Volatile income households are subcategorized into gains and losses. Changes of less than 25 percent are treated as stable.
External reviewers
This brief benefited from the insights and expertise of Mathieu Despard, assistant professor, University of Michigan School of Social Work, and Joanna Smith-Ramani, director of Expanding Prosperity Impact Collaborative (EPIC), Aspen Institute. Both commented on earlier drafts. Neither they nor their organizations necessarily endorse the study’s conclusions.
Acknowledgments
The project team of Sheida Elmi, Erin Currier, and Clinton Key thanks several Pew colleagues: Mark Wolff and David Merchant for providing valuable feedback, and Dan Benderly, Kristin Centrella, Jennifer V. Doctors, Carol Hutchinson, Molly Mathews, Bernard Ohanian, and Liz Visser for their editorial suggestions and design and production assistance. Many thanks also to other current and former colleagues who made this work possible. This research is funded in part by Pew, with additional support from the W.K. Kellogg Foundation.
Endnotes
- Bernadette D. Proctor, Jessica L. Semega, and Melissa A. Kollar, “Income and Poverty in the United States: 2015,” U.S. Census Bureau (September 2016), https://www.census.gov/content/dam/Census/library/publications/2016/ demo/p60-256.pdf; The Pew Charitable Trusts, “Household Incomes Rose in 2015, but Economic Security Remains Elusive,” accessed Dec. 20, 2016, http://www.pewtrusts.org/en/research-and-analysis/analysis/2016/09/23/ household-incomes-rose-in-2015-but-economic-security-remains-elusive.
- In both 2014 and 2015, respondents to the Survey of American Family Finances were asked, “Thinking about your household’s finances today, do you feel your household is: (financially secure/not financially secure)?” “Thinking about your household’s finances today, do you feel your household is: (financially prepared for the unexpected/not financially prepared for the unexpected)?” For responses to the 2014 survey, see The Pew Charitable Trusts, “Americans’ Financial Security: Perception and Reality” (March 2015), http://www.pewtrusts. org/~/media/Assets/2015/02/FSM-Poll-Results-Issue-Brief_ARTFINAL_v3.pdf.
- In 2015, respondents were asked, “Which of the following comes closest to your household’s situation most months lately? Do you: (spend a lot more than you make/spend a little more than you make/spend about as much as you make/make a little more than you spend/make a lot more than you spend)?” “Which best describes the bills and expenses your household pays each month: (Expenses are about the same each month/expenses vary somewhat from month to month/expenses vary a lot from month to month)?” “Which best describes your household’s income each month: (Income is about the same each month/income varies somewhat from month to month/ income varies a lot from month to month)?”
- The Pew Charitable Trusts, “The Precarious State of Family Balance Sheets” (January 2015), http://www.pewtrusts.org/~/media/ assets/2015/01/ fsm_balance_sheet_report.pdf; and Stephen J. Rose and Scott Winship, “Ups and Downs: Does the American Economy Still Promote Upward Mobility?” The Pew Charitable Trusts (June 2009), http://www.pewtrusts.org/~/media/legacy/uploadedfiles/ wwwpewtrustsorg/reports/economic_mobility/ emp20ups20and20downs20full20reportpdf.pdf.
- The Pew Charitable Trusts, “Americans’ Financial Security”; and The Aspen Institute, “Income Volatility: A Primer” (May 2016), https://static1.squarespace.com/static/56ba3fc540261d9363ecd2d1/t/ 57be0a80414fb54bce1ee80b/1472072324346/ Income+Volatility+-+A+Primer+(May).pdf.
- See JPMorgan Chase Institute, “Weathering Volatility: Big Data on the Financial Ups and Downs of U.S. Individuals” (May 2015), https://www.jpmorganchase.com/corporate/institute/report-weathering-volatility.htm; Karen Dynan, Douglas Elmendorf, and Daniel Sichel, “The Evolution of Household Income Volatility,” The B.E. Journal of Economic Analysis & Policy 12, no. 2 (2012), https://doi.org/10.1515/1935-1682.3347; Board of Governors of the Federal Reserve System, “Report on the Economic Well-Being of U.S. Households in 2015” (May 2016), http://www.federalreserve.gov/2015-report-economic-well-being-us-households-201605.pdf; The Pew Charitable Trusts, “The Precarious State of Family Balance Sheets”; and Rose and Winship, “Ups and Downs.”
- Board of Governors of the Federal Reserve System, “Report on the Economic Well-Being of U.S. Households in 2015”; and Dynan, Elmendorf, and Sichel, “The Evolution of Household Income Volatility.” Among respondents to the Federal Reserve’s Board Survey of Household Economics and Decisionmaking who indicated that their income varied, 43 percent said it was as a result of an irregular work schedule. The next three most common selections were bonuses (16 percent), periods of unemployment (15 percent), and seasonal employment (13 percent). Additionally, Dynan et al. found that income volatility increased 30 percent between 1971 and 2008, and this rise was attributable to hourly income and number of hours worked.
- JPMorgan Chase Institute, “Weathering Volatility”; Anthony Hannagan and Jonathan Morduch, “Income Gains and Month-to-Month Income Volatility: Household Evidence From the US Financial Diaries” (September 2015), http://dx.doi.org/10.2139/ ssrn.2659883; and Federal Deposit Insurance Corp., “2015 FDIC National Survey of Unbanked and Underbanked Households” (October 2016), https://www.fdic.gov/householdsurvey/2015/2015report.pdf. Using proprietary data, the JPMorgan Chase Institute found that although 31 percent of households experienced year-to-year income swings of 25 percent or more between 2013 and 2014, volatility was even higher on a month-to-month basis. Seventy percent of households had an income change of at least 5 percent year over year, but 89 percent experienced such a change month to month. Some of the drivers of monthly volatility were extra paydays (if the month had five Fridays) and tax refunds or bills. Similarly, the U.S. Financial Diaries indicate that on average, households face income volatility of 25 percent above or below their average approximately five months of the year. Specifically, households experienced an average of 2.7 large income gains and 2.7 large dips during the course of 12 months. The FDIC found that more than 20 percent of households across income levels experienced monthly income volatility in 2015: Among households making less than $15,000 annually, 21.6 percent reported income that varied somewhat or a lot from month to month, as did 19.6 percent of households with annual income of $75,000 or more.
- Proctor, Semega, and Kollar, “Income and Poverty in the United States: 2015”; The Pew Charitable Trusts, “The Role of Emergency Savings in Family Financial Security: What Resources Do Families Have for Financial Emergencies?” (November 2015), http://www.pewtrusts.org/~/media/assets/2015/11/ emergencysavingsreportnov2015.pdf.
- Volatility results when a household experiences an income increase or decrease of 25 percent or more from one year to the next. As a result, households making less than $25,000 have the lowest threshold to be considered volatile. For example, a household with annual income of $10,000 would need an increase or decrease of $2,500 or more to be classified as volatile income, and a family making $24,000 annually would need a change of at least $6,000. Both amounts are much less than those for families in higher income groups.
- The Pew Charitable Trusts, “The Precarious State of Family Balance Sheets.” From 2014 to 2015, households across demographic groups were more likely to experience an income gain than a loss. Only four of the subgroups studied were more likely to experience income losses: the silent and baby boomer generations, households making $50,000 to $84,999, and those making over $85,000. Those with a high school diploma or less were the only group to have equal shares experiencing an income loss or gain. Additionally, a Pew analysis of the Panel Study of Income Dynamics data demonstrated that on average, from 1979 to 2011, households were more likely to experience an income gain than a loss.
- The median change in income experienced by households from 2014 to 2015 was zero, but the median household in 2015 had $5,000 more in income than the median household in 2014.
- The Pew Charitable Trusts, “Americans’ Financial Security.”
- The Pew Charitable Trusts, “Household Expenditures and Income: Balancing Family Finances in Today’s Economy” (March 2016), http://www.pewtrusts.org/~/media/assets/2016/03/ household_expenditures_and_income.pdf.
- Although respondents from households with income losses and those with gains had similar responses to questions about having savings or experiencing financial shortfalls, they did demonstrate some differences in their perceptions of their financial situations. For example, respondents from households with gains answered more like those from families with stable income than with losses with respect to being financially secure and prepared for the unexpected. In 2015, respondents were asked, “Thinking about your household’s finances today, do you feel your household is: (financially secure/not financially secure)?” Fifty-two percent of respondents from households with gains reported being financially secure, compared with 41 percent of those from families with losses and 59 percent from households with stable income. Respondents were also asked, “Thinking about your household’s finances today, do you feel your household is: (financially prepared for the unexpected/not financially prepared for the unexpected)?” Forty-seven percent of respondents from households with gains reported being financially prepared versus 41 percent from those with losses and 50 percent from families with stable income.
- The Pew Charitable Trusts, “The Role of Emergency Savings in Family Financial Security: How Do Families Cope With Financial Shocks?” (October 2015), http://www.pewtrusts.org/~/media/assets/2015/10/emergency-savings-report-1_artfinal.pdf.
- The Pew Charitable Trusts, “The Role of Emergency Savings in Family Financial Security: Barriers to Saving and Policy Opportunities” (January 2016), http://www.pewtrusts.org/~/media/assets/2016/01/emergency-savings-report-3_011116_update.pdf.
- For more, see: “Building Solutions for Financial Health,” CFSI, accessed Nov. 22, 2016, http://finlab.cfsinnovation.com/challenge-winners.
In 2016, the Center for Financial Services Innovation and JPMorgan Chase & Co.’s joint Financial Solutions Lab identified companies and organizations that developed promising methods to address family financial challenges, including financial shocks and cash flow problems. - Board of Governors of the Federal Reserve System, “Report on the Economic Well-Being of U.S. Households in 2015.”
- The Pew Charitable Trusts, “America’s Savings Challenge: Using Policies, Programs, and Products to Promote Financial Health” (April 2016), http://www.pewtrusts.org/en/about/events/2016/americas-savings-challenge-using-policies-programs-and-products-to-promote-financial-health; and The Aspen Institute, “Income Volatility: Managing the Swings” (September 2016), https://static1. squarespace.com/static/56ba3fc540261d9363ecd2d1/t/ 57eea317e6f2e1b06db28197/1475257112243/EPIC-IncomeVolatility-Managing.pdf.
- Reid Cramer, Justin King, and Elliot Schreur, “Flexible Savings: The Missing Foundation for Financial Security and Economic Mobility,” New America Foundation (May 2015), https://static.newamerica.org/attachments/3034-flexible-savings/Flexible Savings Asset Building.78a8b5f805794bc5a196154ea33dc65c.pdf; and David John, “Making Retirement Saving Even More Valuable by Adding Automatic Emergency Savings” (July 13, 2015), http://blog.aarp.org/2015/07/13/making-retirement-saving-even-more-valuable-by-adding-automatic-emergency-savings.
- The Pew Charitable Trusts, “Do Limits on Family Assets Affect Participation in, Costs of TANF? Restricting Holdings Has Minimal Impact on Program Caseloads, Expenses” (July 2016), http://www.pewtrusts.org/~/media/ assets/2016/07/do_limits_on_family_assets_affect_ participation_in_costs_of_tanf.pdf; and The Aspen Institute, “Income Volatility: Managing the Swings.”
- Susan J. Lambert, “Passing the Buck: Labor Flexibility Practices That Transfer Risk Onto Hourly Workers,” Human Relations 61, no. 9 (September 2008), http://dx.doi.org/10.1177/0018726708094910; and Heather Boushey and Bridget Ansel, “Working by the Hour: The Economic Consequences of Unpredictable Scheduling Practices,” Washington Center for Equitable Growth (September 2016), http://cdn.equitablegrowth.org/wp-content/uploads/2016/09/07110051/090716-unpred-sched-practices.pdf.
- The Aspen Institute, “Income Volatility: Managing the Swings.”
- Krystina Gustafson, “On-Call Scheduling Debate: Where Retailers Stand,” CNBC, Feb. 4, 2016, http://www.cnbc.com/2016/02/04/on-call-scheduling-debate-where-retailers-stand.html; and Marcia Layton Turner, “Is On-Call Scheduling in Retail Coming to an End?” Forbes, Dec. 31, 2016, http://www.forbes.com/sites/marciaturner/2016/12/31/is-on-call-scheduling-in-retail-coming-to-an-end/#2a0f63d91d49.
- Rose and Winship, “Ups and Downs.” Using Panel Study of Income Dynamics data, Rose and Winship explored short- and long-term income fluctuations, as well as whether and how long it took for families to recover from income losses. They examined how households that experienced an income loss from 1993 to 1994 fared in the years after the loss and found that one-fifth of adults recovered within one year, 31 percent recovered within four years, and 34 percent had yet to fully recover a decade later.


America’s Overdose Crisis
Sign up for our five-email course explaining the overdose crisis in America, the state of treatment access, and ways to improve care
Sign up


The Precarious State of Family Balance Sheets


The Role of Emergency Savings in Family Financial Security

Americans' Financial Security
Perception and reality
ADDITIONAL RESOURCES

Podcast

Article


