Federal Spending in the States
2005 to 2014
 The Pew Charitable Trusts
Overview
The federal government spent $3.3 trillion in the states during its 2014 fiscal year.1 But the amount and composition of federal spending vary widely from state to state. As a result, federal budget decisions that increase or decrease areas of spending affect each state differently. The distribution of federal spending provides important context for understanding the effect that federal fiscal policy has on the states.
This analysis combines publicly available data sources to show the state-by-state distribution of federal spending, divided into the five major categories:2
- Retirement benefits, which are payments to individuals and include Social Security retirement, survivor, and disability payments; veterans’ benefits; and other federal retirement and disability payments. Social Security accounts for about four-fifths of these payments.
- Nonretirement benefits, which are payments to individuals and include Medicare benefits, food assistance, unemployment insurance payments, student financial aid, and other assistance payments. Medicare accounts for nearly two-thirds of these payments.
- Grants, which include funding to state and local governments for a variety of program areas such as health care, transportation, education, and housing, as well as funding for individuals and other nonfederal entities, such as research grants. Medicaid grants to states account for about half of all federal grants.
- Contracts for purchases of goods and services, from military and medical equipment to information technology and catering services. Defense purchases account for two-thirds of federal contracts.
- Salaries and wages for federal employees. Roughly two-thirds of this spending is for civilians, and one-third is for military personnel.
Federal spending in the states in fiscal 2014 was equivalent to about one-fifth of their economic activity
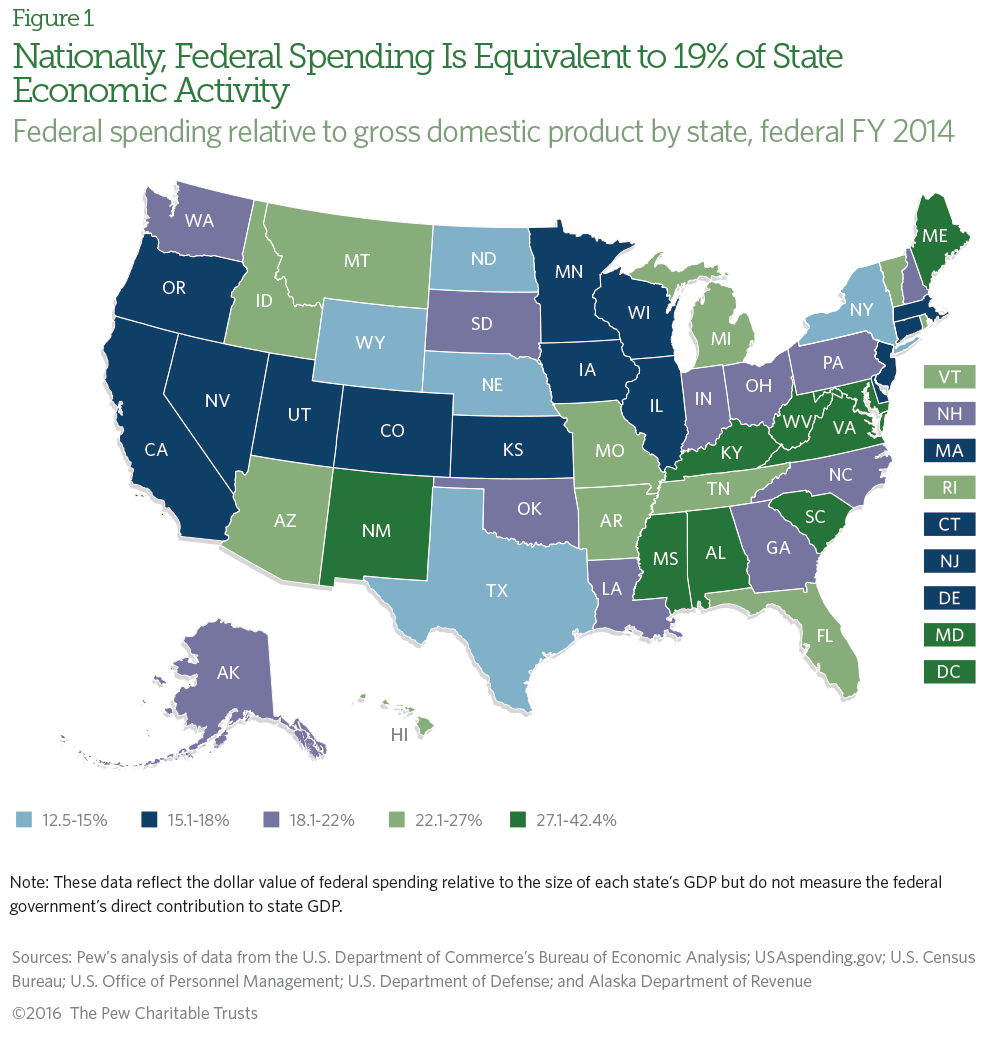
Federal spending affects economic activity in every state. One way to gauge its relative importance is to measure total federal spending against total economic activity—also known as gross domestic product (GDP)—in each state. This provides a yardstick by which to compare federal spending across states. It is important to note, however, that this metric does not measure how much total federal spending directly contributes to each state’s economy.3
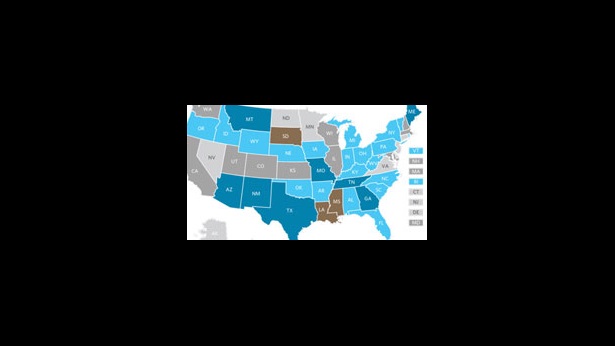
Nationally, federal spending in the states was equivalent to 19 percent of state economic activity in federal fiscal 2014, but on a state-by-state basis, the figure ranged from 32.9 percent in Mississippi to 12.5 percent in Wyoming. Federal spending in the District of Columbia was higher than in any state, at 42.4 percent. (See Figure 1.)
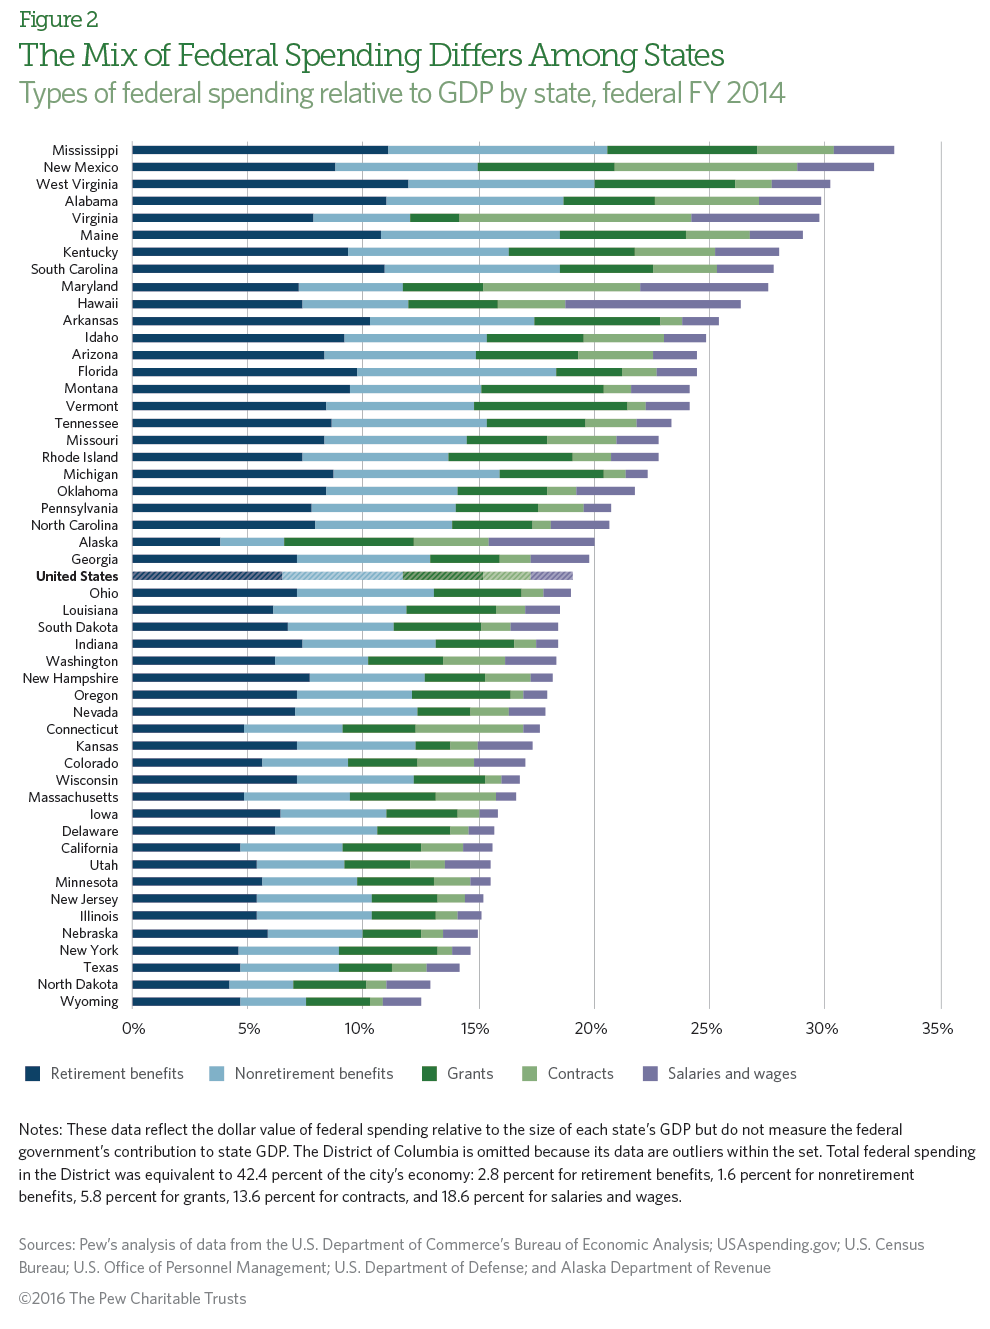
The mix of federal spending varies by state
Multiple factors account for variations in the composition of federal spending across states, including differences in demographics and types of industries and in the decisions that state and local governments make about which public services to provide and at what levels. Because each state’s mix of federal spending is unique, the effect of a federal budget change will vary by state. For instance, in Alabama and Virginia, total federal spending was equivalent to about 30 percent of state GDP in federal fiscal 2014, but spending on salaries and wages was equivalent to 5.5 percent of Virginia’s economic activity, compared with 2.7 percent in Alabama. Consequently, Virginia’s economy would probably be more affected than Alabama’s by federal salary and wage cuts. (See Figure 2.) Note that these figures do not measure how much federal spending on salaries and wages directly contributed to each state’s economy.
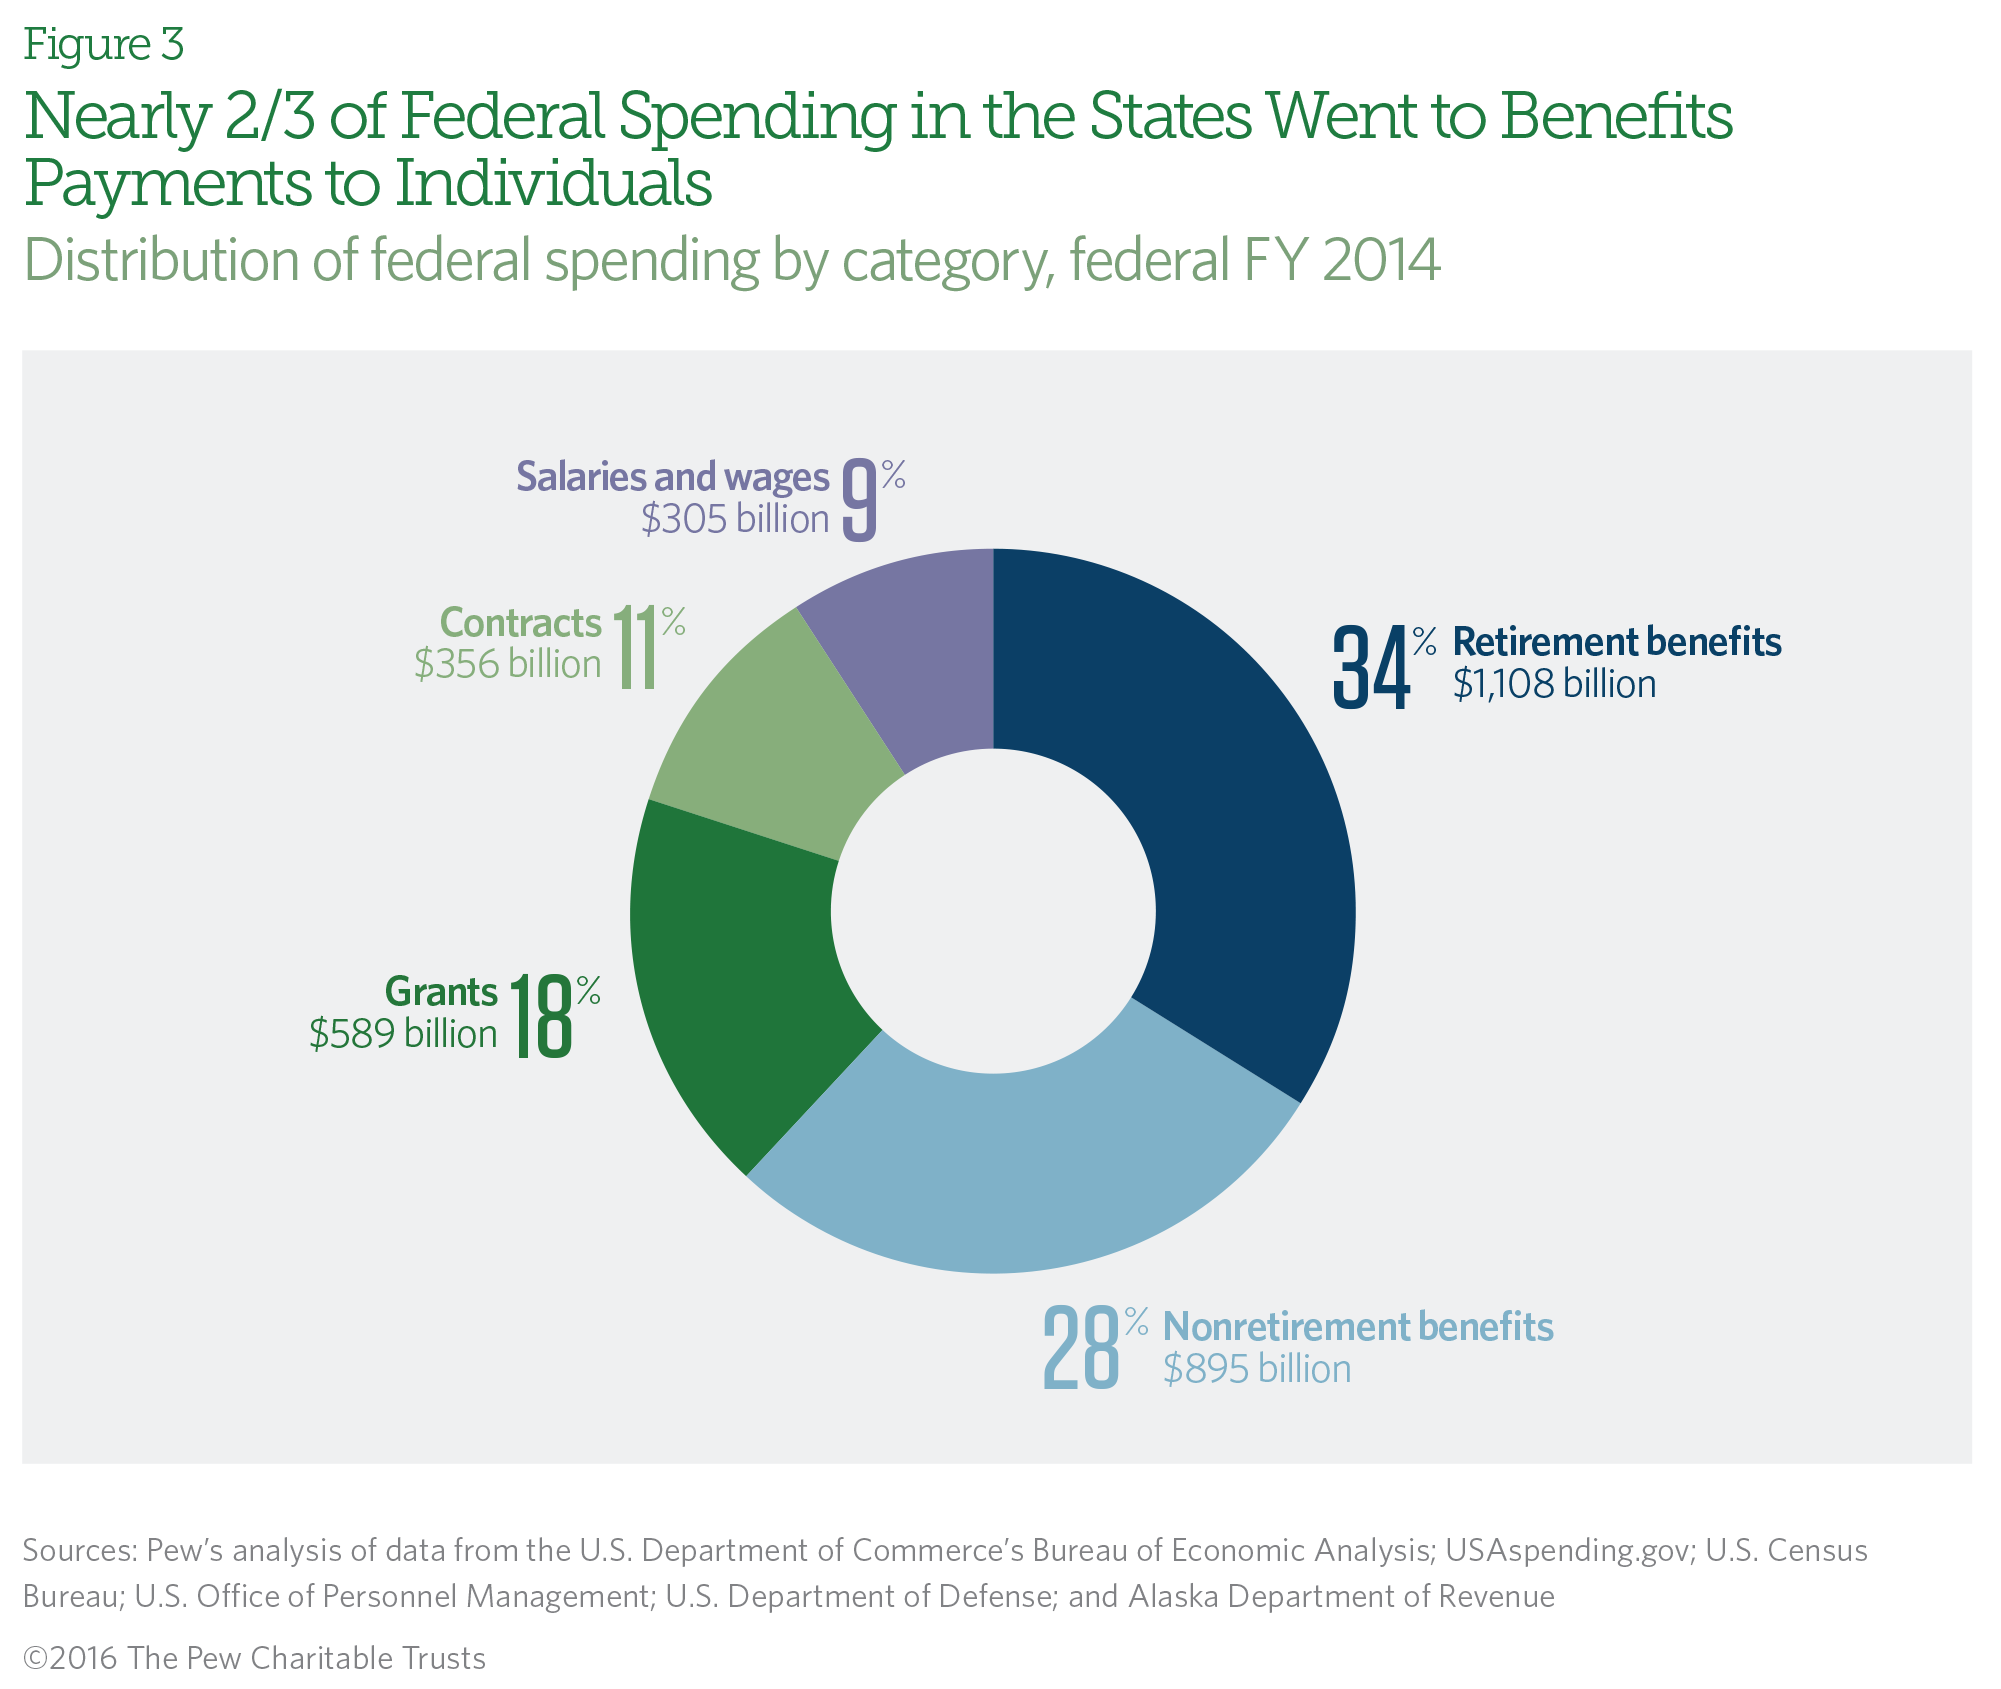
Benefits payments to individuals accounted for 62 percent of federal spending in the states in fiscal 2014
Retirement and nonretirement benefits accounted for more than half of all federal spending in the states in fiscal 2014. Over one-third of total spending went to retirement benefits, including Social Security and federal employee pensions. Nonretirement benefits, the largest of which is Medicare, accounted for over one-quarter of federal spending in the states. Grants, the largest of which is Medicaid, and contracts made up roughly one-sixth and one-ninth of spending, respectively. At 9 percent, salaries and wages accounted for the smallest share. (See Figure 3.)
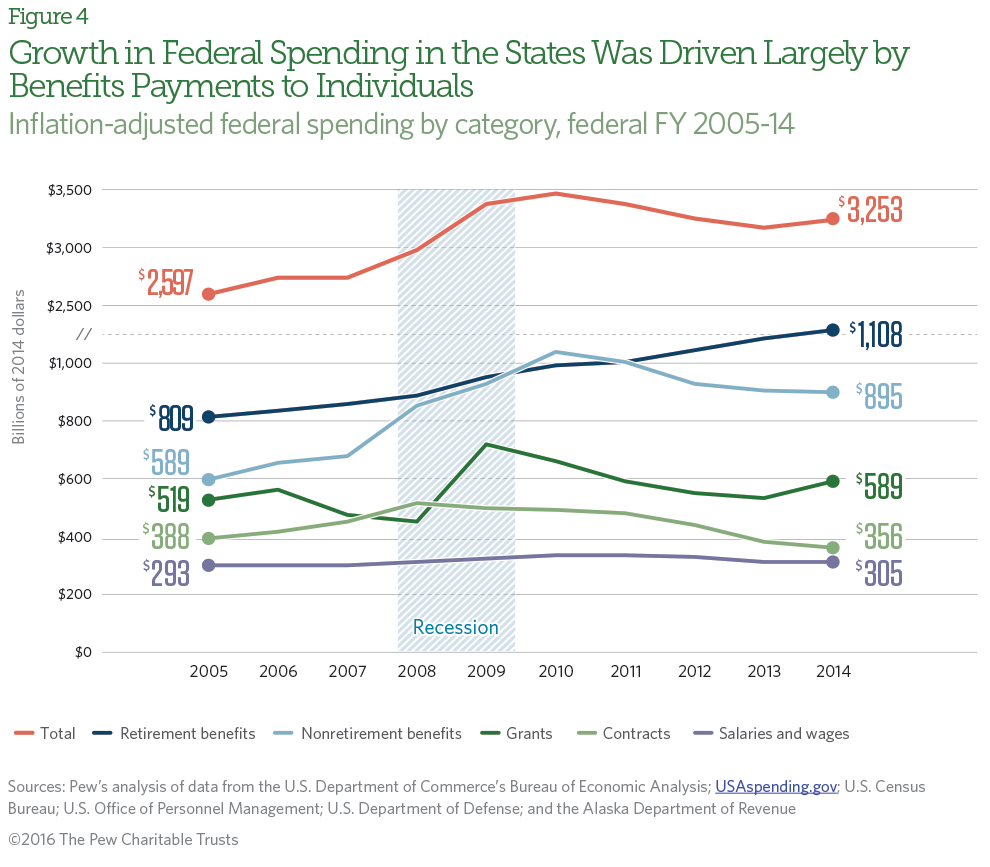
Federal spending in the states grew 25 percent over the past decade, adjusted for inflation
From fiscal 2005 to 2014, total inflation-adjusted federal spending in the states grew 25 percent, from $2.6 trillion to $3.3 trillion.4 Every category of spending increased in real terms, with the exception of contracts, which fell by 8 percent. Spending on retirement and nonretirement benefits grew the most (37 percent and 52 percent, respectively), followed by grants (13 percent) and salaries and wages (4 percent). The temporary spike in grants and nonretirement benefit payments during and immediately after the Great Recession were the result of federal stimulus aid to states, which has been almost entirely phased out. (See Figure 4.)
Endnotes
- Office of Management and Budget, “Fiscal Year 2017 Historical Tables: Budget of the U.S.Government,” https://www.whitehouse.gov/sites/default/files/omb/budget/fy2017/assets/hist.pdf. This equals 93 percent of the $3.5 trillion in federal outlays for fiscal 2014; the remaining 7 percent includes interest payments on the federal debt, international transactions and foreign payments, classified expenditures, and other spending that cannot be assigned to a state.
- Pew’s analysis uses the same federal spending categories as the U.S. Census Bureau used when producing the Consolidated Federal Funds Report. See “About this analysis” on Page 1 for more information.
- Determining how much economic activity in a state is directly attributable to total federal spending in that state is difficult for several reasons. First, government transfers to individuals, such as Social Security and other direct payments, are not direct purchases of goods or services and therefore are not included in state or national GDP calculations. Second, some federal spending in one state may contribute to economic activity in another. For instance, Social Security recipients living in Oregon may spend a portion of their benefits in Idaho, thus contributing to Idaho’s economic activity. Third, salary and wage data are reported by place of employment, not place of residence, which may overstate or understate spending in areas with a high percentage of commuters.
- Total inflation-adjusted federal spending in the states grew from $2.597 trillion to $3.253 trillion from federal fiscal 2004 to 2015, or 25 percent. The dollar amounts shown in the text have been rounded and cannot be used to calculate the stated percentage increase.
Fiscal Federalism by the Numbers


Tax Code Connections
How changes to federal policy affect state revenue


America’s Overdose Crisis
Sign up for our five-email course explaining the overdose crisis in America, the state of treatment access, and ways to improve care
Sign up
ADDITIONAL RESOURCES

Fact Sheet

Podcast


