Federal Spending in the States
2004 to 2013
Note: This issue brief has been updated with new data. Click here to see the latest version of “Federal Spending in the States.”
Overview
The federal government spent $3.1 trillion in the states during its 2013 fiscal year.1 But the amount and composition of federal spending vary widely from state to state. As a result, federal budget decisions that increase or decrease different areas of spending affect each state differently. The distribution of federal spending provides important context for understanding the effect that federal fiscal policy has on the states.
For nearly three decades, the U.S. Census Bureau produced the Consolidated Federal Funds Report, an annual look at the geographic distribution of federal spending. But following the publication of the fiscal 2010 data, the Census Bureau discontinued the report. To fill this data gap, the Pew Charitable Trusts’ fiscal federalism initiative prepared this analysis and companion methodology. The analysis combines publicly available data sources to show the state-by-state distribution of federal spending, divided into the five major categories used by the Census Bureau:
- Retirement benefits payments to individuals include Social Security retirement, survivor, and disability payments; veterans benefits; and other federal retirement and disability payments. Social Security accounts for about three-fourths of these payments.
- Nonretirement benefits payments to individuals include Medicare benefits, food assistance, unemployment insurance payments, student financial aid, and other assistance payments. Medicare accounts for nearly two- thirds of these payments.
- Grants include funding to state and local governments for a variety of program areas such as health care, transportation, education, and housing, as well as funding for individuals and other nonfederal entities, such as research grants. Medicaid grants to states account for about half of all federal grants.
- Contracts for purchases of goods and services, from military and medical equipment to information technology and catering services. Defense purchases account for more than half of federal contracts.
- Salaries and wages for federal employees. Roughly two-thirds of this spending is for civilians, and one-third is for military personnel.
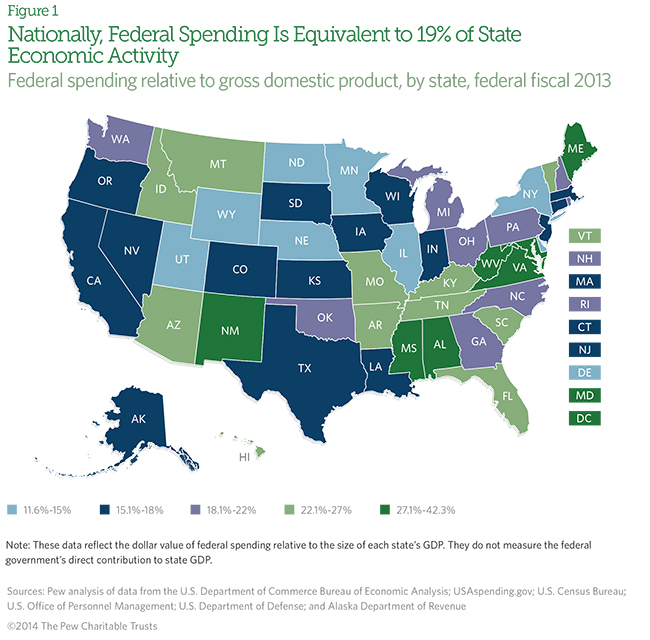
Federal spending in the states in fiscal 2013 was equivalent to about one-fifth of states’ economic activity
Federal spending affects economic activity in every state. One way to gauge its relative importance is to measure total federal spending against total economic activity—also known as gross domestic product (GDP)—in each state.2 This provides a standardized yardstick by which to compare spending across states. It is important to note, however, that this metric does not measure how much total federal spending directly contributes to each state’s economy.3
Nationally, federal spending in the states was equivalent to 19 percent of state economic activity in fiscal 2013, but that figure ranged from 32.9 percent in Mississippi to 11.6 percent in Wyoming. Federal spending in the District of Columbia was higher than in any of the states, at 42.3 percent. (See Figure 1.)
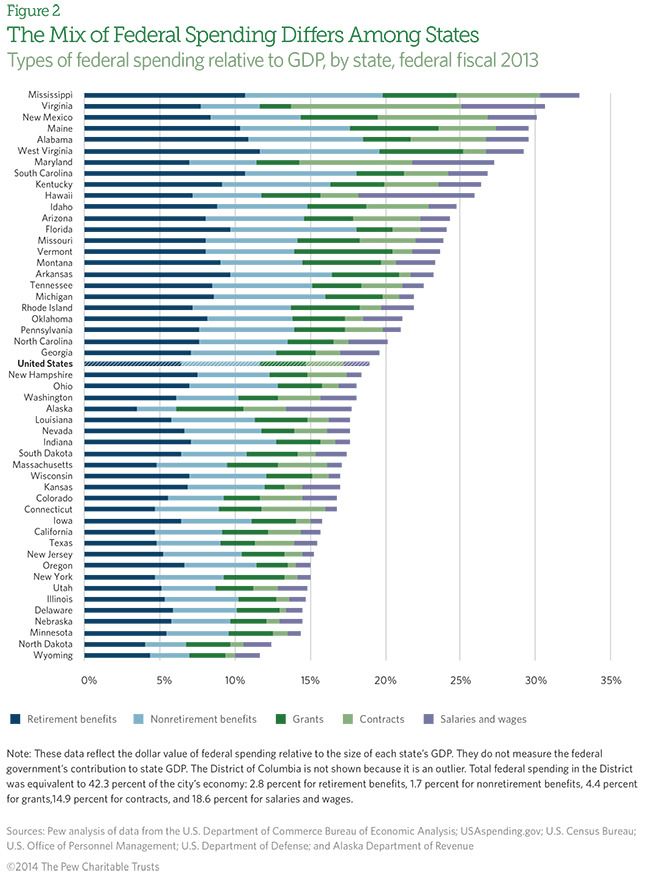
The mix of federal spending varies by state
Multiple factors account for variations in the makeup of federal spending across states, including differences in demographics and types of industries, as well as in the decisions state and local governments make about which public services to provide and at what levels. Because each state’s mix of federal spending is unique, the effect of a given federal budget change will vary by state. For instance, in both Louisiana and Alaska, total federal spending was equivalent to about 18 percent of state GDP in fiscal 2013, just below the national average. But spending on salaries and wages was equivalent to 4.4 percent of Alaska’s economic activity compared with 1.4 percent of Louisiana’s. Consequently, Alaska’s economy would likely be more affected than Louisiana’s by federal salary and wage cuts. (See Figure 2. Note that these figures do not measure how much federal spending on salaries and wages directly contributed to each state’s economy.4)
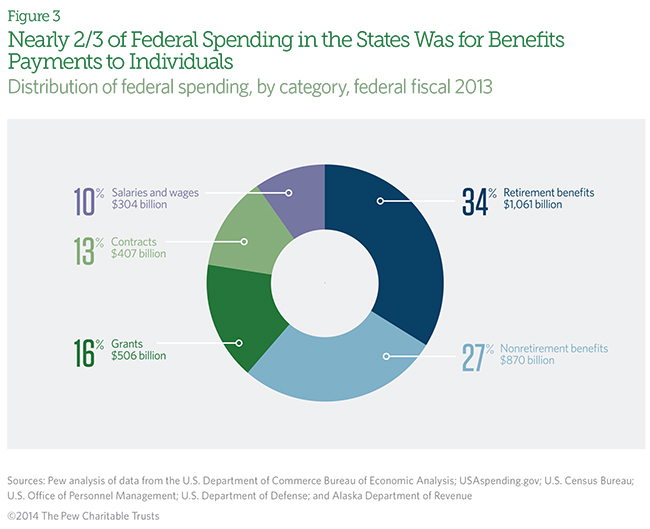
Benefits payments to individuals accounted for 61 percent of federal spending in the states in fiscal 2013
Retirement and nonretirement benefits accounted for more than half of all federal spending in the states in fiscal 2013. Over one-third of total spending went to retirement benefits, including Social Security and federal employee pensions. Nonretirement benefits, the largest of which is Medicare, accounted for over one-quarter of federal spending. Grants, the largest of which is Medicaid, and contracts made up roughly one-sixth and one-eighth of spending, respectively. At 10 percent, salaries and wages was the smallest share of total federal spending. (See Figure 3.)
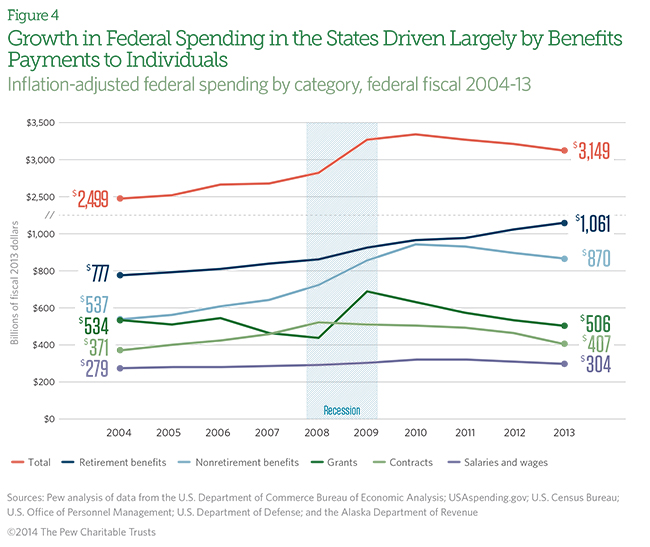
Federal spending in the states grew 26 percent over the past decade, adjusted for inflation
From fiscal 2004 to 2013, total inflation-adjusted federal spending in the states grew 26 percent, from $2.5 trillion to $3.1 trillion. Every category of spending increased in real terms, with the exception of grants, which fell by 5 percent. Spending on retirement and nonretirement benefits grew the most (37 percent and 62 percent, respectively), followed by contracts (10 percent) and salaries and wages (9 percent). Federal stimulus aid to states resulted in a temporary spike in grants and nonretirement benefit payments during and immediately after the Great Recession; that aid has been almost entirely phased out. (See Figure 4.)
Download the accompanying data tables and methodology. Ten-year historical data are available upon request. Please contact Sarah Leiseca.
Endnotes
- Office of Management and Budget, “Fiscal Year 2015 Historical Tables: Budget of the U.S. Government,” http://www.whitehouse.gov/sites/default/files/omb/budget/fy2015/assets/hist.pdf. This equals 91 percent of the $3.5 trillion in federal outlays for fiscal 2013; the remaining 9 percent includes interest payments on the federal debt, international transactions and foreign payments, classified expenditures, and other spending that cannot be assigned to a state.
- Per capita state-level data are available in the downloadable tables.
- It is difficult for several reasons to determine how much economic activity in a state is directly attributable to total federal spending in that state. First, government transfers to individuals, such as Social Security and other direct payments, are not direct purchases or goods or services and therefore are not included in state or national GDP calculations. Second, some federal spending in one state may contribute to economic activity in another. For instance, Social Security recipients living in Oregon may spend a portion of their benefits in Idaho, thus contributing to Idaho’s economic activity. Third, salary and wage data are reported by place of employment not place of residence, which may overstate or understate spending in areas with a high percentage of commuters.
- See endnote 3.
ADDITIONAL RESOURCES

Podcast