Tax Revenue in Most States Surpasses Pre-Pandemic Growth Trend
Note: This data has been updated. To see the most recent data and analysis, visit Fiscal 50.
In nearly two-thirds of states—the most since the pandemic's start—tax revenue had outperformed its pre-COVID growth trajectory by the end of the first quarter of 2022, when combining all receipts since January 2020. Still, uncertainty about the strength of future collections is mounting amid slowing economic growth and historically high inflation rates.
As the first quarter of 2022 came to an end and the United States passed the two-year anniversary of the start of the COVID-19 pandemic, total state tax revenue was at its highest level since just before its historic decline in early 2020. Collections were 18.1% greater than those for the final quarter of 2019, after adjusting for inflation and averaging across four quarters to smooth seasonal fluctuations. Only Wyoming and North Dakota had not taken in enough revenue to surpass their pre-pandemic levels.
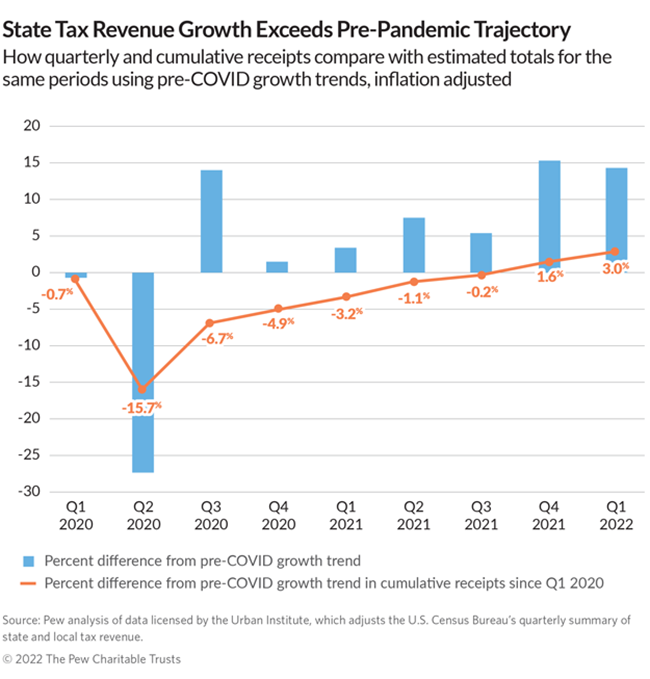
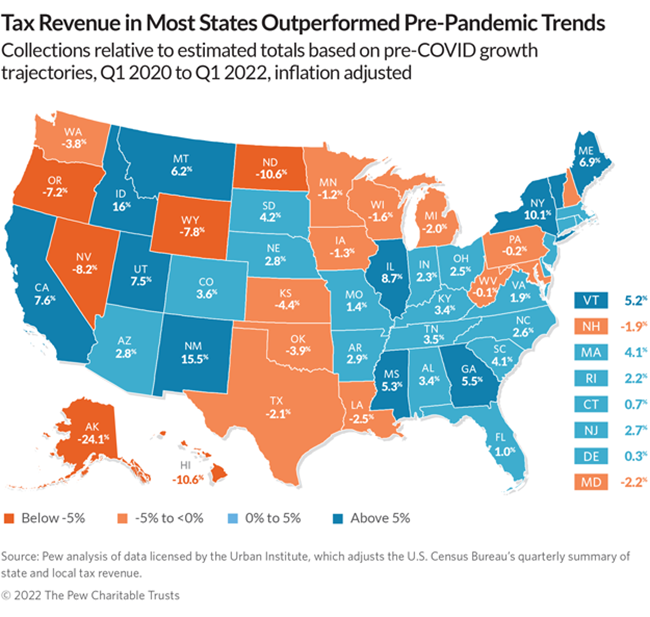
Nationwide and in 31 states as of the end of the first quarter of 2022, cumulative tax receipts since the pandemic’s start, adjusted for inflation, were even higher than they would have been if pre-COVID growth trends had continued—despite fallout from the pandemic and a two-month recession. According to Pew estimates, Idaho led all states, with 16% more cumulative tax revenue than it would have collected under its pre-pandemic growth rate. New Mexico was second at 15.5% above the trend. Nationally, combined tax revenue at the end of the first quarter of 2022 was 3% above estimates of what might have been collected had the pandemic not occurred.
Download the data, including state-by-state trends.
However, estimates also show that cumulative tax revenue fell short of its pre-COVID growth trend in slightly more than a third of states since the pandemic’s onset, and most other states’ recoveries largely followed historical trends.
Looking at cumulative totals since the start of the pandemic offers a way to identify states in which tax revenue has over- or underperformed since January 2020, based on pre-COVID trends. This approach also provides a different view of the strength of collections from the often-astonishing quarterly and annual percentage increases that were skewed by this particularly volatile period. For each of the nine quarters from Jan. 1, 2020 to March 31, 2022, Pew calculated the difference between actual tax revenue and estimates of how much each state would have collected had revenue grown at its pre-pandemic, five-year average annual growth rate.
Preliminary monthly data from the Urban Institute shows that inflation-adjusted receipts continued to grow but at a slower pace through June 2022. Similarly, forecasts suggested that collections would remain elevated through fiscal year 2022, which in most states ended June 30; however, overall growth is expected to be slower in fiscal 2022 than in fiscal 2021.
State and economic experts project a potential end to this brief but extraordinary chapter in state finances. Reports from S&P Global Ratings, the Urban Institute, Fitch Ratings, Moody’s Analytics, and the National Association of State Budget Officers all indicate that annual state tax revenue growth is likely to temper substantially in fiscal 2023 as underlying economic conditions weaken and temporary factors that have bolstered recent growth fade.
Policymakers in most states are navigating an unusual mix of temporarily strong financial conditions and growing uncertainty. Although higher-than-expected tax revenue growth, abundant federal aid, and record financial reserves have buttressed states’ fiscal positions, states now must reckon with several looming challenges, including weakening economic growth amid tightening monetary policy and historically high inflation, and tapering of federal aid.
During the past two fiscal years, states have pursued a blend of short- and long-term budgetary commitments—such as tax cuts, pay raises for public workers, and deposits to rainy day funds—in response to recent fiscal conditions. For instance, 30 state governors proposed net tax cuts in their fiscal 2023 budgets, building on the 18 states that enacted reductions as part of their fiscal 2022 budgets. These reductions have ranged from permanent, broad-based rate reductions to targeted, temporary rebates. Additionally, lawmakers in several states have approved either permanent wage increases or one-time bonus payments for state employees.
To better understand whether they can afford these commitments and to prepare for possible future fiscal challenges, states can use two forward-looking fiscal management tools: long-term budget projections, which help policymakers identify challenges that can build over time, and budget stress tests, which help determine states’ risk from adverse events.
State highlights
A comparison of inflation-adjusted tax revenue between Jan. 1, 2020 and March 31, 2022—with estimates for the same period if collections had grown at their pre-pandemic, five-year average annual growth rate—shows that:
- Idaho’s tax revenue outperformed that of all states—posting 16% more in collections than it would have raised had revenue continued at the state’s five-year pre-pandemic growth trend. A combination of strong personal income and sales tax gains drove overall revenue growth. Idaho also recorded the fastest-growing population among states in the past two years. The state enacted multiple tax cuts as part of its fiscal 2022 budget and a second round of major cuts in February of this year.
- The states with the next-strongest tax revenue gains compared with their pre-COVID growth trends were New Mexico (15.5%), New York (10.1%), Illinois (8.7%), California (7.6%), and Utah (7.5%).
- In 48 states, revenue met or exceeded 2019 levels just before the pandemic, and in 17 of those states, collections remained below pre-COVID growth trends: Alaska, Hawaii, Iowa, Kansas, Louisiana, Maryland, Michigan, Minnesota, Nevada, New Hampshire, Oklahoma, Oregon, Pennsylvania, Texas, Washington, West Virginia, and Wisconsin.
- Only two states, North Dakota and Wyoming, did not take in enough revenue to return to pre-pandemic levels, much less catch up to pre-COVID growth trends. Since the start of the pandemic, natural resource-dependent states have had some of the deepest declines in tax revenue. Recently, however, these states have experienced a sudden turnaround, with stronger tax revenue growth due largely to rising energy prices.
Recent trends
Tax revenue in most states grew in the first quarter of 2022, strengthening an already remarkably fast recovery since the 2020 recession. Overall, after adjusting for inflation, collections during the first quarter of 2022 grew by 13.9% compared with those from the same period in 2021, building on the unexpectedly high gains that have characterized state tax revenue during the pandemic era.
Forty-six states reported higher year-over-year inflation-adjusted tax revenue in the first quarter of 2022, ranging from 214.1% in Alaska and 67.5% in New Mexico to less than 2% in Mississippi and Nebraska. Collections in Alaska and New Mexico benefited from boosts in severance tax revenue related to the rise in crude oil prices, which surpassed $100 a barrel for the first time since 2014. Severance tax revenue is Alaska’s largest and New Mexico’s second-largest tax source.
Four states—Delaware, Ohio, Oregon, and Wisconsin—bucked the national trend and took in less inflation-adjusted revenue in the first quarter of 2022 than in the first quarter of 2021. Drops in personal income tax revenue drove the declines in Oregon and Wisconsin, while in Delaware and Ohio, nominal year-over-year gains were not large enough to offset increases in the prices of goods and services.
Nationally, state revenue benefited from robust growth in all major tax streams. Personal income taxes, which are the largest source of total state tax revenue, grew by an inflation-adjusted 11.3% in the first quarter of 2022. Strong employment growth and rising wages were major underlying drivers of this increase, along with high short-term government aid to individuals. Sales taxes, which are states’ second-largest revenue source, posted an inflation-adjusted quarterly gain of 10.4%, supported by elevated—yet, notably slowing—consumer spending and a temporary, pandemic-driven shift in expenditure patterns from purchases of often-untaxed services to typically taxable goods.
Trends since the pandemic’s onset
The start of the Covid-19 pandemic abruptly ended a nearly continual stretch of annual growth since state tax revenue began recovering from the recession of 2007-09.
No major tax stream was left unscathed after the economy plunged into a new recession in February 2020 amid a historic spike in unemployment to nearly 15%, a short-lived stock market crash, business closures, and restrictions on public gatherings.
Aggregate state tax revenue from April through June 2020 was an extraordinary 25% lower than the same quarter of 2019—its steepest single-quarter plunge in at least 25 years. But much of the sudden shortfall resulted from the federal government’s decision—copied by nearly all states—to delay the income tax filing deadline until July 15, which pushed large sums of personal and corporate income tax payments into the first quarter of fiscal 2021 and aggravated the strain on many states’ fiscal 2020 budgets.
In the face of tremendous uncertainty about the course and severity of the coronavirus, its effects on state tax revenue, and the availability of federal aid, states forecasted multiyear revenue declines on par with or worse than what they had experienced because of the Great Recession. However, tax revenue nationally rebounded swiftly by both historical standards—approximately five times faster than the recovery after the Great Recession—and compared with what many states and economic experts had initially projected.
Various factors drove these higher-than-expected collections, including unprecedented federal aid that helped support businesses and unemployed workers, quicker-than-anticipated recoveries in the stock market and employment, states’ relatively recent authority to collect sales taxes from out-of-state online sellers, and job stability in higher-wage professions that were able to pivot to remote work. In addition, record funding levels of rainy day funds and historic federal aid to state governments gave state budgets extra breathing room.
To be sure, the pandemic’s sudden and widespread disruptions in early 2020 triggered a sharper decline in total state tax revenue than was recorded during at least the last two recessions, but total losses were not as deep. And the national data obscures another hallmark of the 2020 recession: sharply divergent effects on state tax revenue. The size and speed of states’ revenue declines and rebounds varied widely, influenced by each state’s economic makeup, share of jobs that could be performed remotely, mix and structure of imposed taxes, COVID-19 caseloads, and public health restrictions.
Further, since the start of the pandemic, natural resource-dependent states, such as Alaska, North Dakota, and Wyoming, and those reliant on tourism, such as Hawaii and Nevada, have had some of the deepest and longest-running declines in tax revenue. Reduced travel in the early stages of the COVID-19 pandemic hurt businesses and jobs in the leisure and hospitality industry and lowered demand for fuel, further depressing tax revenue in energy states already coping with pre-pandemic declines in oil and gas prices. Starting in the second half of 2021, however, rising energy prices and increasing tourism have boosted these states’ recoveries.
State budgets do not adjust revenue for inflation, so percentage changes presented here may differ from tax revenue figures in states’ documents. Adjusting for inflation is just one way to evaluate state tax revenue changes. Different insights would be gained by tracking revenue relative to population growth or state economic output.
The fiscal year ends June 30 in all but four states: New York (March 31), Texas (Aug. 31), and Alabama and Michigan (both Sept. 30).
Download the data to see individual state trends, and visit The Pew Charitable Trusts’ interactive resource, Fiscal 50: State Trends and Analysis, to sort and analyze data for other indicators of state fiscal health.


America’s Overdose Crisis
Sign up for our five-email course explaining the overdose crisis in America, the state of treatment access, and ways to improve care
Sign up
Fiscal 50: State Trends and Analysis
