State and Local Government Job Growth Lags as Economy Recovers
While private employers add workers, multiple factors hold back return of public noneducation jobs
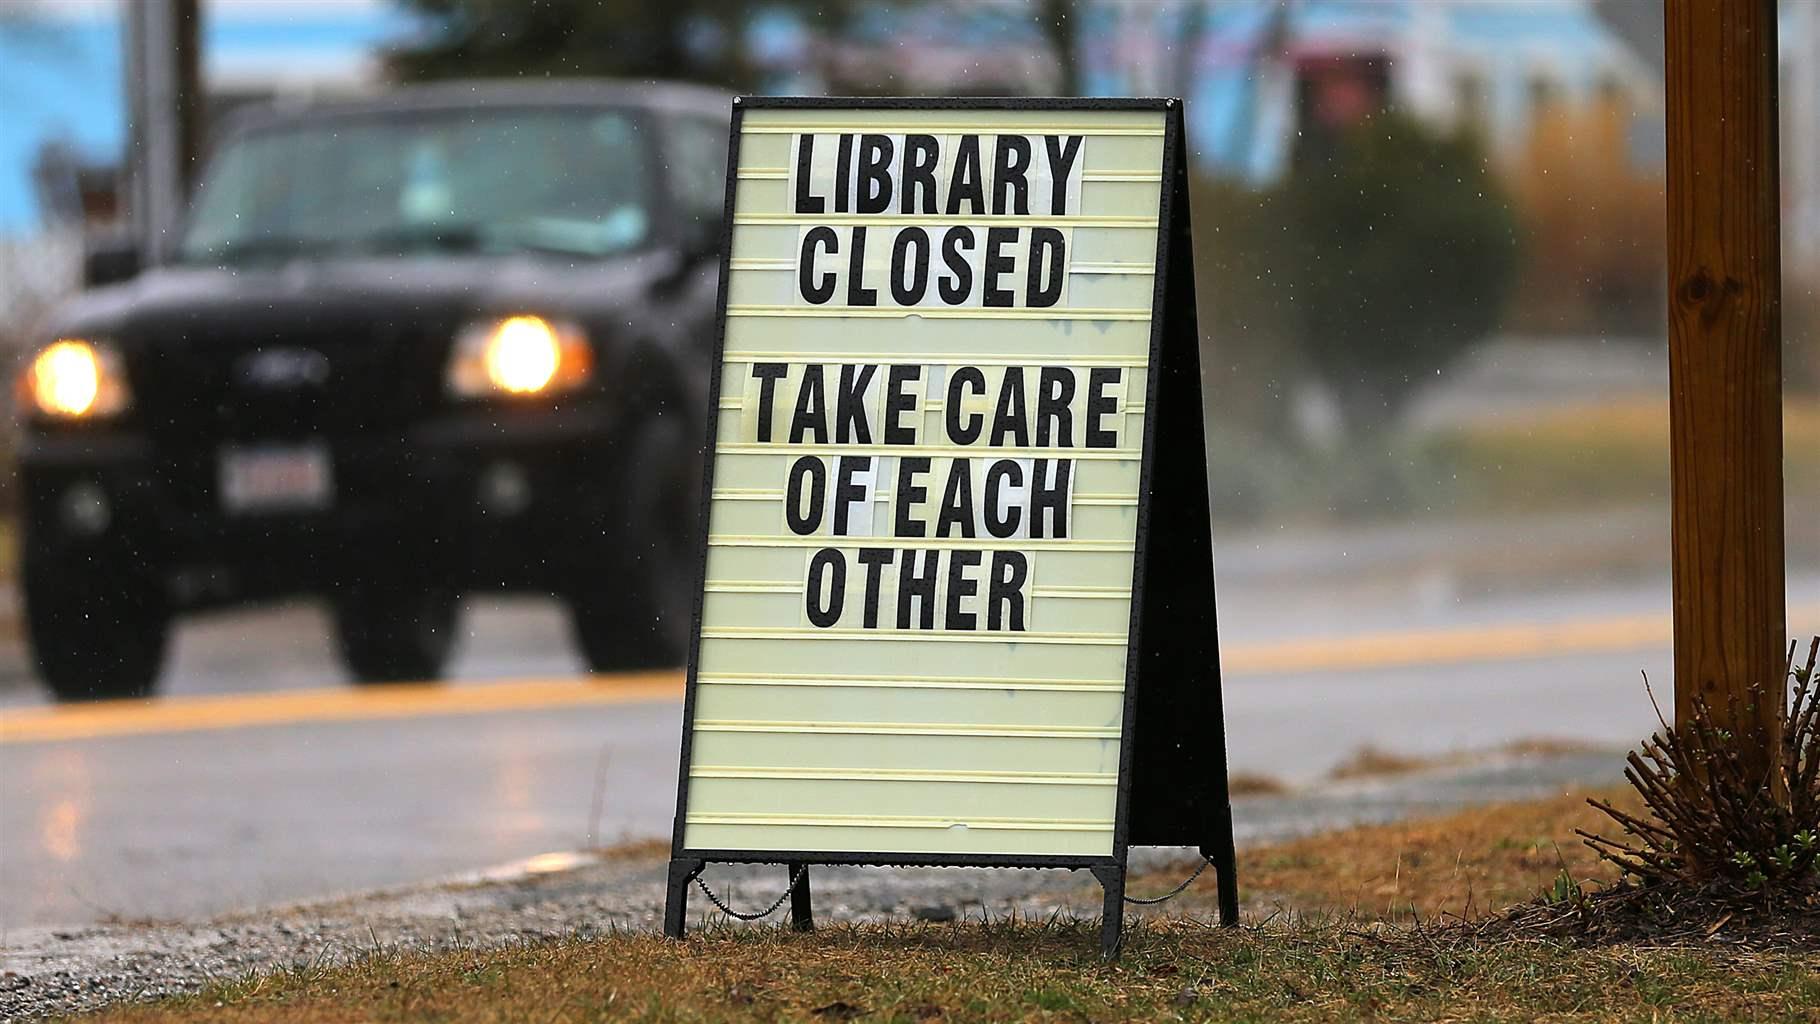
More than a year after the sharpest monthly decline in state and local government employment on record, the return of jobs in much of the public workforce is lagging as the economy recovers from the pandemic-induced recession. Although the private sector and hard-hit public school systems are now regaining lost positions, employment growth in state and local government outside of schools has withered.
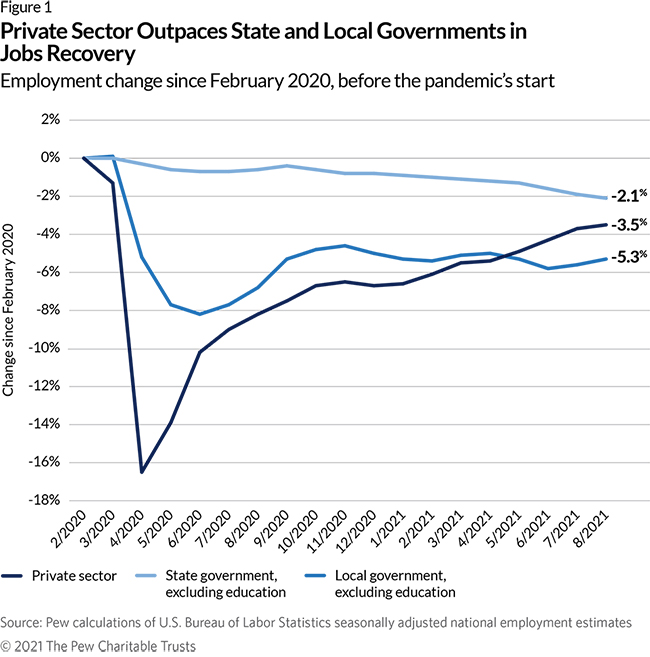
The number of noneducation state and local jobs, which make up about half of the public sector and include workers in areas ranging from city parks and city halls to police forces and correctional facilities, is down by more than 400,000 since the pandemic struck, according to the latest federal Labor Department estimates for August. The current total is about equal to the low point after the Great Recession. Surprisingly, employment in this sector has dipped slightly even as the recovery lengthens, down 0.6% since December.
By comparison, private employment is up 3.4% since that month, though still not fully recovered from its losses since the pandemic struck earlier in 2020. Local school and state higher education jobs have also climbed recently after initially experiencing steep losses but are still below pre-pandemic levels.
Among noneducation jobs, the greatest reductions since the pandemic began have been in local governments, which employ more than twice as many workers as states do. As of August, local public payrolls were down 5.3% from pre-pandemic totals, more than 350,000 jobs, excluding education positions. After weathering the early months of the pandemic with relatively small losses, state government employment—also excluding education—has declined slowly every month this year, with the total down 2.1% from pre-pandemic levels, or about 57,000 jobs.
Multiple factors have held back the recovery of these jobs. Temporary layoffs persist as many cities and states are still ramping up services that were scaled back to prevent the spread of COVID-19. In addition, budget pressures that led to hiring freezes or furloughs earlier in the pandemic remain in place in some jurisdictions. At the same time, more workers are leaving government, including retirements, causing managers to scramble to hire for hard-to-fill positions.
The lagging recovery of state and local jobs matters beyond the bank accounts of those previously on the public payroll. Reduced public employment—if it persists over a lengthy recovery—could harm government services and hinder broader economic growth.
The state-by-state picture
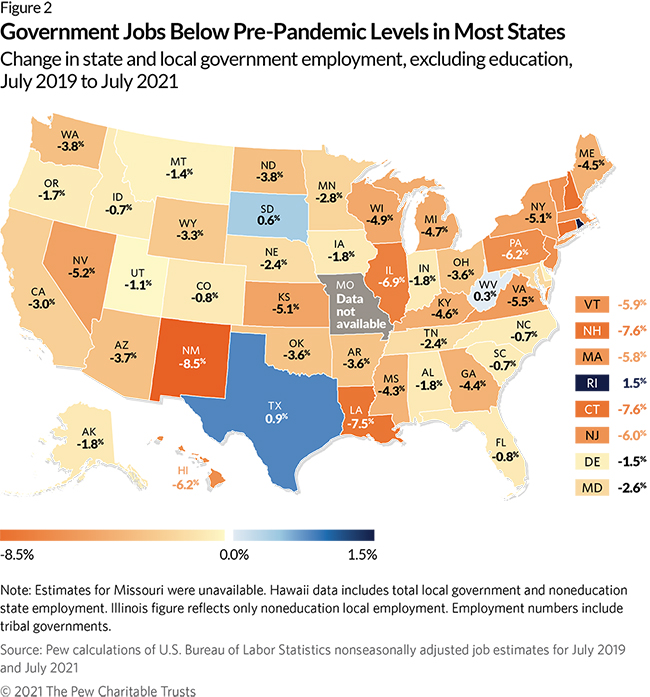
State and local government employment, outside of education, remains down in nearly every state since the pandemic’s start. As of July, the most recent month of data available on a state-by-state basis, there were fewer noneducation workers in state and local government than in July 2019 except in Rhode Island, South Dakota, Texas, and West Virginia, according to Pew calculations of Labor Department estimates.
Fourteen states recorded declines of more than 5% over that period. New Mexico experienced the sharpest loss (-8.5%), in large part because many tribal-owned casinos and hotels closed throughout much of the pandemic. Tribal government jobs are included in local public sector data.
Why jobs haven’t recovered
A major reason that public sector employment hasn’t rebounded at the same pace as in the private sector is that many workers furloughed or laid off temporarily have not returned to work because of pandemic-related service reductions. Just over three-quarters of all unemployed state and local government workers who reported in July that they had lost their jobs considered their layoffs to be temporary rather than permanent, according to Pew calculations of national Current Population Survey estimates from the U.S. Census Bureau. Affected employees could be required to take a few furlough days or go without a paycheck for months.
Jobs in some areas of government have held up better than in others, reflecting the unique nature of the pandemic economy and recovery. The latest Labor Department estimates, for example, show that there were nearly 23% fewer workers in state and local government-owned amusement, gambling, and recreation facilities in March compared with a year earlier while fire protection jobs were essentially unchanged.
Hard-Hit State and Local Government Jobs
Selected categories experiencing large year-over-year declines since the pandemic’s start
| State and local employment | March 2020-March 2021 change | Percentage change |
|---|---|---|
| Casino hotels | -20,958 | -22.6% |
| Amusements, gambling, and recreation | -53,364 | -22.5% |
| Museums, historical sites, zoos, and parks | -7,516 | -15.3% |
| Information (including libraries) | -15,448 | -11.2% |
| Transit and ground passenger transportation | -13,746 | -5.1% |
| Executive and legislative offices, combined | -78,801 | -4.5% |
| Administration of environmental programs | -9,689 | -4.2% |
| Correctional institutions | -16,684 | -3.7% |
Note: Many of the losses reflect temporary layoffs.
Source: Pew calculations of March 2020-March 2021 national employment estimates from the U.S. Bureau of Labor Statistics Quarterly Census of Employment and Wages. Figures represent combined state and local totals for select industries.
In March, Congress approved $350 billion in federal aid for state and local governments as part of the American Rescue Plan Act, which helped reduce the budget pressures driving many furloughs. Hawaii, for example, announced that it no longer needed to furlough workers after Congress acted, while Detroit was able to return hundreds of employees to work.
But since the start of 2021, total job openings and the number of noneducation state and local government workers quitting are up from recent years, according to Labor Department estimates. A survey conducted by Washington, D.C.-based MissionSquare Research Institute in May found that 31% of state and local employees said that working during the pandemic made them consider changing jobs. The retirement rate for police departments increased 45% in the 12 months preceding the end of March 2021, compared with a year earlier, according to a Police Executive Research Forum survey.
Even governments with adequate budgets to hire are having trouble filling positions because of pandemic-related closures or recruitment hurdles. Some of the toughest jobs to fill are in health care, corrections, and highway maintenance. “They were challenging to fill already, then you add the pandemic, and it becomes difficult to retain them,” said Leslie Scott, director of the National Association of State Personnel Executives. Unlike private businesses, state and local employers often cannot offer hiring bonuses or remote work options, she said.
Many rural local governments are having a particularly difficult time recruiting, said Joshua Franzel, managing director of the MissionSquare Research Institute, which studies public workforce issues. Some governments have responded by expanding remote work options, offering financial incentives to retain staff, and broadening their recruitment pools. “Now is a great opportunity to reach out to communities and residents who wouldn’t consider working for a locality,” Franzel added.
Job losses and recovery linked to pandemic’s course
Historically, government jobs are less prone to quick cuts when there’s a downturn in the economy. Job losses tend to lag those in the private sector because economic shocks often take time to take a toll on state and local government revenue. Last year played out differently; both the public and private sectors suffered steep employment declines shortly after the pandemic began disrupting daily life and the economy.
Still, as happened after the Great Recession, state and local government jobs (excluding education) are again proving slower to rebound than those in private industry. This time, budget woes are largely not to blame. Job recovery instead depends more on the unpredictable course of the pandemic and the unique challenges it poses for the public workforce.
Barb Rosewicz is a project director and Mike Maciag is an officer with The Pew Charitable Trusts’ state fiscal health initiative.
