States’ Total Rainy Day Funds Fall for First Time Since Great Recession
Note: This data has been updated. To see the most recent data and analysis, visit Fiscal 50.
The total amount set aside in state rainy day funds fell for the first time since the Great Recession as lawmakers in fiscal year 2020 filled budget gaps driven by the pandemic’s early fiscal and economic fallout. Nearly a third of states reported declines in the total dollar amounts of their savings—the most since 2010. Still, remaining balances hovered near record highs.
In the face of steep tax revenue shortfalls and increased spending demands, 15 states tapped a total of $12.4 billion from their rainy day funds in the first budget year disrupted by COVID-19, according to data reported by the National Association of State Budget Officers (NASBO). Some withdrew only a small share of their savings, but others tapped substantial amounts to plug budget holes that suddenly emerged.
Despite the start of a recession, rainy day funds in the rest of states were unchanged or even grew somewhat in the fiscal year that ended for most states in June 2020. Overall, rainy day funds nationwide were left with $71.6 billion—second only to the pre-pandemic record-setting total of $78.7 billion—to deal with budget shortfalls or other emergencies as the pandemic continued into this fiscal year.
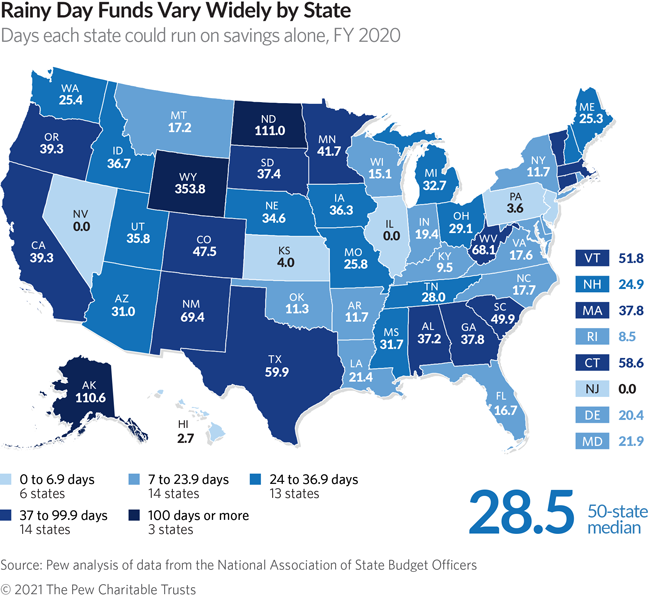
A 50-state comparison, though, shows wide variation in how far each state’s rainy day funds could stretch—from enough to run government operations for almost a year in Wyoming to zero savings in Illinois, Nevada, and New Jersey. The median amount at the start of this fiscal year could cover 28.5 days’ worth of general fund spending, or 7.8%, meaning at least half of states had that much or more saved and half had less.
It is still unclear how much states may draw on their reserves to balance budgets this fiscal year, which ends June 30 in 46 states. Eleven states expected their rainy day fund totals to fall by the close of fiscal 2021, according to NASBO data. But fiscal and economic outlooks have improved considerably since most states’ budget plans were passed last year.
The threat of big year-end budget gaps lessened as the national economy began bouncing back and state tax revenue began recovering. As of February 2021, tax collections in 29 states had grown enough to offset initial losses since the start of the pandemic, though in at least 18 states—often those heavily reliant on tourism or energy production—receipts still were running behind pre-pandemic levels. Although budgets also were stressed by billions of dollars of expenses to fight COVID-19 and repair economic damage, states were poised to receive an unprecedented amount of federal aid that could be used to fill gaps and also fund economic relief and infrastructure projects. A few states that recently withdrew from their rainy day funds were already considering making sizeable deposits in fiscal 2022, including California, Michigan, and Oklahoma.
States were cautious early on about using their rainy day accounts, also known as budget stabilization funds, amid significant uncertainty over how long the public health and economic crises might last and how much federal aid might be forthcoming. Instead of turning first to rainy day funds, many managed fiscal 2020 budget gaps through a combination of spending cuts, federal aid, and a historically high cache of leftover general fund budget dollars, known as ending balances, that had built up over two years of widespread surpluses.
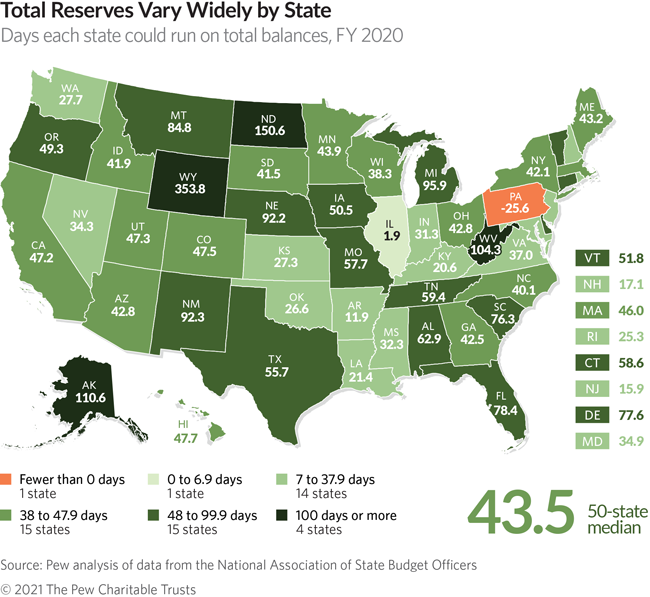
Before the pandemic hit, the combination of states’ ending balances and rainy day funds—what is known as total balances—amounted to a record $121.6 billion, the largest fiscal cushion on record in at least the past 20 years. After dealing with the pandemic’s sudden blows to public health, the economy, and tax collections in the final four months of fiscal 2020, states still held $105.6 billion in total balances heading into the current fiscal year, enough cash reserves to cover a median of 43.5 days’ worth—or 11.9%—of operating costs.
Rainy day funds
Overall, states learned a lesson from the 2007-09 downturn, when tax revenue losses far outstripped savings, and they pumped up the total amount set aside in rainy day funds almost every year over the past decade. When the pandemic hit, they had enough money to cover 28.9 days’ worth of operating costs at the end of fiscal 2019 compared with just 17.3 days in fiscal 2007, on the brink of the Great Recession.
However, some states had far more set aside than others to deal with potential revenue downturns, natural disasters, or other emergencies, such as COVID-19. At least 36 states by the start of fiscal 2020 had saved enough to cover a greater share of government operating costs than in the last full budget year before the previous recession.
Rainy day fund highlights
In fiscal 2020, the first budget year scarred by the pandemic:
- Two states—New Jersey and Nevada—drained their savings, a sharp reversal after each had made recent progress replenishing rainy day funds they had emptied during the previous downturn. New Jersey had just made its first deposit in a decade, and Nevada had surpassed its pre-Great Recession savings level for the first time. The governor of Nevada has proposed a plan to begin refilling its rainy day fund, and New Jersey’s balance is projected to hit $1.4 billion by the end of the current fiscal year.
- The 13 other states that tapped their rainy day funds were: Alaska, California, Georgia, Hawaii, Indiana, Maine, Michigan, New Mexico, North Carolina, Oklahoma, Oregon, Rhode Island, and Texas. Declines ranged from 4% of savings in Texas and Georgia to 71% in Oklahoma and 84% in Hawaii. California’s $7.2 billion decline was the largest by dollar amount and accounted for 31% of its savings; however, its governor has proposed a budget that would restore much of these funds in the upcoming budget year. Maine’s withdrawal was unrelated to the pandemic, and the governor’s proposed budget for fiscal 2022 would bolster the fund.
- Connecticut posted the largest gain among 26 states in which rainy day fund savings grew as a share of operating costs, despite the pandemic-induced economic downturn. A $940 million increase—driven by a deposit rule tied to revenue volatility—boosted its savings from 40.4 days’ worth of operating costs in fiscal 2019 to 58.6 days in fiscal 2020.
- Wyoming boasted the nation’s largest rainy day reserves as a share of operating costs in fiscal 2020 (353.8 days). North Dakota (111 days) and Alaska (110.6) were the only states besides Wyoming with more than 100 days’ worth of operating costs stowed away. Alaska, though, has made withdrawals for seven years in a row and was down to one-eighth what it once had as a share of spending.
- Six states had less than a week’s worth of operating costs in reserve in fiscal 2020: Kansas (four days), Pennsylvania (3.6), Hawaii (2.7), and Illinois (less than one-tenth of a day), plus Nevada and New Jersey, each with zero. Kansas, though, made its first deposit of $82 million since creating its rainy day fund in 2016.
- The 11 states that earlier this fiscal year had expected declines in their rainy day funds were: Alaska, California, Louisiana, Massachusetts, Missouri, Nebraska, New Mexico, North Carolina, Texas, Vermont, and Wyoming. In addition, Delaware authorized a withdrawal from a new fund that functions as savings but is not reflected in NASBO’s data. States may find less need to tap their savings by the close of fiscal 2021 because both economic and budget conditions have improved considerably.
Total balances
Unlike the Great Recession, rainy day funds made up the bulk of states’ reserves in the year before the pandemic, accounting for 65 cents of every dollar in total balances at the end of fiscal 2019, compared with 45 cents just before the 2007-09 downturn. The contrast highlights the more prominent role of rainy day funds today in managing state fiscal uncertainty. Ending balances, which make up the remainder of total balances, were historically high before both recessions.
At the end of the first budget year of the pandemic, ending balances were down more than rainy day funds. In net dollars, which account for the fact that totals fell in some states while rising in others, ending balances fell by nearly $9 billion to $34 billion in fiscal 2020, while rainy day funds declined by $7 billion to $71.6 billion.
At the close of fiscal 2020, total balances in 31 states could cover fewer days’ worth of general fund spending than a year earlier but 18 states could cover more, with one state unchanged.
Ending balances fluctuate from year to year, so policymakers cannot count on them as cushions against future budget uncertainty to the degree that they can with rainy day funds, which are saved until policymakers decide to draw them down.
Total balance highlights
In fiscal 2020, which for most states included the first five months of the new pandemic-induced recession:
- Of the 31 states whose fiscal cushion shrank from a year earlier, total balances in seven declined by more than 50% in terms of days’ worth of government spending: New Hampshire, Oregon, Illinois, Arkansas, Oklahoma, Kansas, and Pennsylvania.
- The highest-ranked state for total balances was the same as for rainy day funds: Wyoming (353.8 days). Three other states held more than 100 days’ worth of operating costs by the end of fiscal 2020: North Dakota (150.6), Alaska (110.6), and West Virginia (104.3).
- Illinois (1.9 days) was the only state with less than one week’s worth of operating costs held in total balances in fiscal 2020, nearly all ending balances. Pennsylvania was the only state to finish the fiscal year with a negative total balance—spurred by a $2.7 billion budget deficit—which lawmakers had to resolve in the current budget cycle.
Why reserves matter
States use reserves and balances to manage budgetary uncertainty, including revenue forecasting errors, budget gaps during economic downturns, and other unforeseen emergencies, such as natural disasters. This financial cushion can soften the need for severe spending cuts or tax increases when states need to balance their budgets.
Because reserves and balances are vital to managing unexpected changes and maintaining fiscal health, their levels are tracked closely by bond rating agencies. For example, Moody’s Investors Service upgraded Connecticut’s credit rating in March 2021, citing the state’s buildup of reserve levels as part of its rationale.
There is no one-size-fits-all rule on when, how, and how much to save. States with a history of significant economic or revenue volatility may desire larger cushions. According to a report by The Pew Charitable Trusts, the optimal savings target of state rainy day funds depends on three factors: the defined purpose of funds, the volatility of a state’s tax revenue, and the level of coverage—similar to an insurance policy—that the state seeks to provide for its budget.
Reserves and balances represent funds available to states to fill budget gaps, although there may be varied levels of restriction on their use, such as under what fiscal or economic conditions they can be used. In addition, limits are often set on how much states may deposit into rainy day accounts in a given year when seeking to replenish their reserves.
General fund reserves and balances may not reflect a state’s complete fiscal cushion. States may have additional resources to soften downturns, such as dedicated reserves outside of their general funds or rainy day accounts. In addition, the scope of each state’s general fund expenditures can differ, so comparisons across states should be made with caution. For example, some states—such as Michigan—spend considerable amounts outside of their general fund, and Ohio is unusual because its general fund includes spending from federal Medicaid dollars. One way to standardize the size of reserves and balances is to calculate how many days a state could run solely on those funds, even though the scenario is highly unlikely.
Download the data to see individual state trends. Visit Pew’s interactive resource, Fiscal 50: State Trends and Analysis, to sort and analyze data for other indicators of state fiscal health.
—Analysis by Barb Rosewicz, Justin Theal, and Joe Fleming


America’s Overdose Crisis
Sign up for our five-email course explaining the overdose crisis in America, the state of treatment access, and ways to improve care
Sign up
Fiscal 50: State Trends and Analysis
Economic Downturns: Protecting State and Local Budgets


