Decade After Recession, Tax Revenue Higher in 45 States
Note: These data have been updated. To see the most recent data and analysis, visit Fiscal 50.
A decade after the Great Recession ended, the number of states in which tax collections had fully recovered jumped to 45—the highest yet, after accounting for inflation—as most states closed out their 2019 budget year. Still, the size and speed of each state’s recovery varied widely, and recent growth showed signs of receding.
As the United States entered its longest economic recovery on record, total state tax revenue at the end of the second quarter of 2019 was at its highest level since falling during the 2007-09 recession. Collections were 16 percent above their 2008 peak, just before revenue plunged, after adjusting for inflation and averaging across four quarters to smooth seasonal fluctuations.
The results mean that states collectively had the equivalent of 16 cents more in purchasing power for every $1 they collected at their recession-era peak more than a decade earlier.
However, the road to recovery has varied widely from state to state, shaping how quickly each could begin catching up on investments and spending that had been cut or deferred during the downturn. Among states that had surpassed their recession-era peaks by 2019’s second quarter, recovery ranged from as much as 71 percent higher tax revenue to less than 1 percent and took from as little as one year to achieve to more than 11 years.
Nearly every state experienced tax revenue gains in fiscal 2019 for the second year a row, following two years in which many states posted declines amid the weakest growth in tax revenue—outside of a recession—in at least 30 years. Higher tax collections in the past two years drove widespread budget surpluses, in some states for the first time since the recession.
But growth was showing signs of easing. Overall tax receipts rose 3.5 percent from July 2018 through June 2019—the budget year used by most states—from a year earlier, down from a spike of 5.4 percent in the previous year, after adjusting for inflation.
Looking ahead, the tax revenue boost that states enjoyed through mid-2019 is expected to slow as personal income tax collections moderate, according to preliminary figures for the third quarter collected by the Urban Institute. Looming over future collections are the declining impacts of federal tax changes, which had led to a surge of one-time money for states, and predictions of weaker U.S. economic growth. Stock market volatility, along with a global economic slowdown and the impacts of U.S. trade policies, also threaten to dampen growth.
Just five states collected less in inflation-adjusted tax dollars than at their peak before collections plunged in the recession: Alaska, Florida, Louisiana, Ohio, and Wyoming. Revenue in these states was still below its recession-era peak for a variety of reasons, including state tax cuts, weak economic growth, volatile energy prices, or an unusually high tax revenue peak before the downturn.
But even states that have surpassed their recession-era peaks have had to deal with years of slow revenue growth before the recent surge. Meanwhile, spending demands have not stood still. For example, Medicaid enrollment rose by 55 percent from 2008 to 2017, according to data from the Medicaid and CHIP Payment and Access Commission. Population increases and other fiscal strains, such as accumulated debts and liabilities, have also squeezed state finances.
State highlights
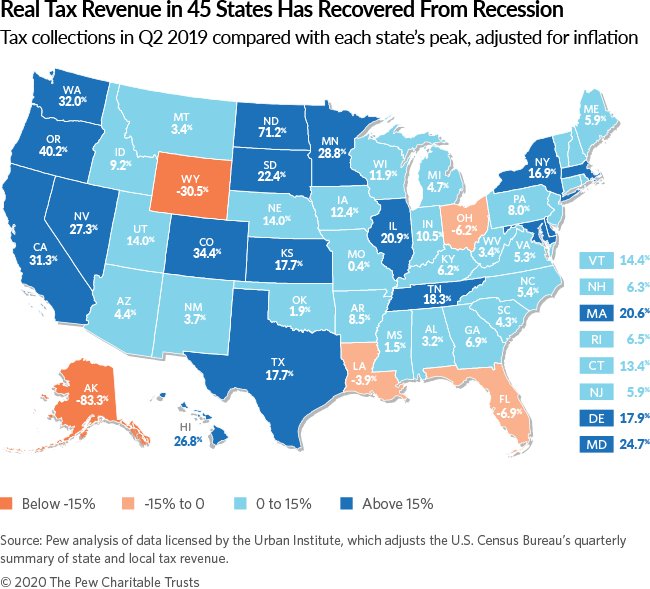
A comparison of tax receipts in the second quarter of 2019 with each state’s peak quarter of revenue before the end of the recession, averaged across four quarters and adjusted for inflation, shows:
- North Dakota remained the leader among all states in tax revenue growth since the recession, although its collections have swung dramatically along with the price of oil during the same period. At the end of 2014, receipts hit a high of 123.9 percent above their peak during the recession, compared with 71.2 percent above in the second quarter of 2019.
- Sixteen other states posted tax revenue rebounds of 15 percent or more: Oregon (40.2 percent), Colorado (34.4 percent), Washington (32 percent), California (31.3 percent), Minnesota (28.8 percent), Nevada (27.3 percent), Hawaii (26.8 percent), Maryland (24.7 percent), South Dakota (22.4 percent), Illinois (20.9 percent), Massachusetts (20.6 percent), Tennessee (18.3 percent), Delaware (17.9 percent), Kansas (17.7 percent), Texas (17.7 percent), and New York (16.9 percent).
- Alaska (-83.3 percent) was furthest below its peak. This means the state collected only about 16.7 percent as much in inflation-adjusted tax dollars as it did at its short-lived peak in 2008, when a new state oil tax coincided with record-high crude prices. Without personal income or general sales taxes, Alaska is highly dependent on oil-related severance tax revenue, which began falling even before worldwide crude prices declined in 2014 as its oil production waned.
- One additional state was down more than 15 percent from its previous peak: Wyoming (-30.5 percent).
- Other states still below their peaks were Florida (-6.9), Ohio (-6.2), and Louisiana (-3.9).
- New Jersey and Oklahoma surpassed their recession-era peaks for the first time, taking in 5.9 percent and 1.9 percent more tax dollars, respectively. Mississippi and Missouri climbed back above their peaks from 11 years ago—collecting 1.5 percent and 0.4 percent more, respectively—after falling below for multiple quarters.
Latest trends
Just four states bucked the national trend and took in less tax revenue in fiscal 2019 than they did a year earlier: Connecticut, Idaho, Missouri, and New York. Idaho and Missouri cut tax rates recently, and personal income tax collections in all four states have seen multiple quarters of decline.
Strong personal income tax collections drove overall revenue growth in 2019’s second quarter, while sales taxes—the other major tax revenue source for most state governments—were sluggish compared with recent periods. Personal income tax collections spiked 17 percent from the same quarter a year earlier, the largest gain since mid-2013, fed by high April tax returns, according to the Urban Institute. In contrast, sales tax revenue grew by 0.5 percent for the quarter, after adjusting for inflation—the first time below 2 percent since late 2017. Post-recession sales tax revenue growth has trailed rates seen in past economic expansions due in part to consumer spending patterns that have been migrating toward services and online purchases, which only recently have become widely subject to sales tax.
In states with significant fossil fuel deposits, increased production—despite sporadic energy prices—buoyed annual tax collections and helped push many energy-reliant states up from recent tax revenue lows.
Total state tax revenue collections have been bolstered in part because of two recent landmark policy actions—the 2017 federal Tax Cuts and Jobs Act and the U.S. Supreme Court’s 2018 decision to uphold states’ authority to collect online sales taxes—as well as by favorable economic conditions and robust stock market returns.
Many states collected more tax dollars in late 2017, 2018, and early 2019 because of the way their tax codes link to federal tax law, though some states have acted to counteract these gains. The 2017 changes cut U.S. tax rates but broadened the amount of income subject to taxation, automatically increasing what many individuals and businesses owed to state tax collectors unless policymakers acted to neutralize the unlegislated state tax hikes. The federal law also incentivized taxpayers to shift the timing of income and payments in ways that resulted in a temporary inflation of state tax collections. Gains in some states also came from a deadline for hedge fund managers to pay taxes on offshore earnings by the end of 2017.
The Supreme Court’s June 2018 decision to uphold state governments’ authority to collect sales taxes from online retailers marked a new era for state finances. As of June 2019, the period of study for this analysis, 31 of the 45 states with sales taxes had enacted and implemented laws to exploit this new revenue source. While sales tax collections have been sluggish in recent years, preliminary data collected by the Urban Institute for the third quarter of 2019 indicate a substantial turnaround.
Trends since the recession
State tax revenue—like the U.S. economy—has grown slowly and unevenly since the recession. After states’ tax collections bottomed out after the recession, the number of states that have regained their tax revenue levels has risen and fallen, reflecting volatility in state tax collections as well as tax policy changes.
Nationally, tax revenue recovered from its losses in mid-2013, after accounting for inflation. But individual state results have differed dramatically depending on economic conditions, population changes, and tax policy choices since the recession. For example, state policymakers have enacted tax cuts in states such as North Carolina and Ohio and hikes in states such as California and Illinois since the recession. States collectively enacted the fourth straight year of net tax increases in fiscal 2019, according to data from the National Association of State Budget Officers. These hikes ranged from nearly $10 billion in fiscal 2018 to $545 million in fiscal 2016.
Recovery times varied widely among the 45 states that had surpassed their recession-era peaks as of the second quarter of 2019. North Dakota was the first state to surpass its recession-era peak, in 2010—after just five quarters (1.25 years)—while Michigan, New Mexico, and Virginia each took 46 quarters (11.5 years) to recover their tax revenue losses from the downturn. States that tracked closely with the national trend of 18 quarters (4.5 years) include Connecticut, Hawaii, Iowa, Massachusetts, and Wisconsin.
State budgets do not adjust revenue for inflation, so tax revenue totals in states’ documents will appear higher than or closer to pre-recession totals. Without adjusting for inflation, 50-state tax revenue was 35 percent above peak and tax collections had recovered in 48 states—all except Alaska and Wyoming—as of the second quarter of 2019. Unadjusted figures do not take into account changes in the price of goods and services.
Adjusting for inflation is just one way to evaluate state tax revenue growth. Different insights would be gained by tracking revenue relative to population growth or state economic output.
Download the data to see individual state trends from the first quarter of 2006 to the first quarter of 2019. Visit The Pew Charitable Trusts’ interactive resource Fiscal 50: State Trends and Analysis to sort and analyze data for other indicators of state fiscal health.


Fiscal 50: State Trends and Analysis


America’s Overdose Crisis
Sign up for our five-email course explaining the overdose crisis in America, the state of treatment access, and ways to improve care
Sign up
.png?h=999&w=650&la=en&hash=C9C186CF1136173F7D76121E25D9C057)


