Since Recession, Tax Revenue Lags in 30 States
These data have been updated. To see the most
recent data and analysis, visit Fiscal 50.
Nationally, total state tax revenue recovered in mid-2013 from its plunge during the Great Recession. But the state-by-state picture is far more mixed. Adjusted for inflation, tax receipts in 30 states had not fully rebounded by the third quarter of 2014.
Overall, states collected 2.5 percent more tax revenue in the third quarter of 2014 than they did midway through the recession, after accounting for inflation and seasonal fluctuations. It was the sixth straight quarter that tax revenue surpassed its 50-state peak, which was reached in the third quarter of 2008 just before receipts plummeted.
This means that for every $1 of purchasing power states derived from tax receipts at the 2008 peak, they collectively had 2.5 cents more, based on collections from July through September 2014, up from 1.8 cents in the previous quarter.
But the 50-state total masks how unevenly revenue is recovering state to state. More than five years after the recession’s end, 30 states were still collecting less in real terms than at their individual peaks before or during the recession. In 11 states, tax revenue was down 10 percent or more from those peaks.
Tax revenue trends reflect the effect of economic changes as well as tax structures and policy decisions, such as rate increases or decreases.
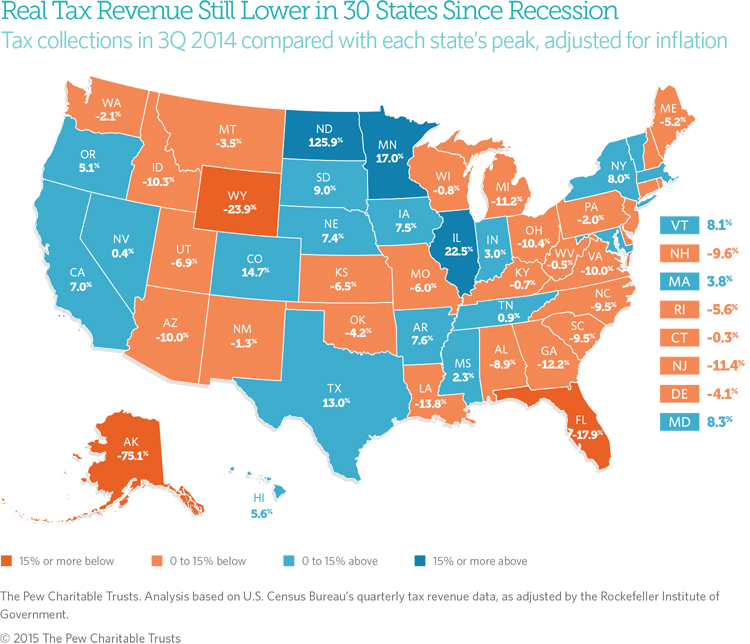
A comparison of each state’s tax receipts in the third quarter of 2014 with its peak quarter of revenue before the end of the recession, averaged across four quarters and adjusted for inflation, shows that:
- Alaska was furthest from its peak, down 75.1 percent. This was its lowest point since a short-lived windfall in 2008, when a new state oil tax coincided with record-high crude prices. As oil production has waned, the state has seen revenue decline for the past seven quarters, even before a recent drop in crude prices.
- Two other states’ receipts also were down more than 15 percent from their prior peaks: Wyoming (-23.9 percent) and Florida (-17.9 percent), which is one of several states that have trimmed taxes or fees since the recession.
- New Mexico had reported that tax revenue was down by more than 25 percent from its 2006 peak, but state officials recently submitted revised data for several years to the U.S. Census Bureau. The new information shows that revenue was just 1.3 percent below its peak.
- North Dakota led all states, as its oil boom boosted tax revenue to 125.9 percent above its highest point during the recession. Revenue increased from last quarter, despite a drop in crude prices, as production also increased.
- The next-largest rebounds were in Illinois (22.5 percent) and Minnesota (17.0 percent). Tax increases imposed after the recession contributed to both states’ revenue growth, though Illinois’ income tax hike ended at the close of 2014.
Total 50-state tax revenue has hovered above its 2008 high mark—even though most states had below-peak receipts—largely because of the recovery of collections in three states with large tax bases: California, Illinois, and Texas. If those states were excluded, overall tax revenue would fall short of its 2008 level.
The latest results show that 50-state tax revenue is growing again after two quarters of declines broke a string of steady increases over the previous 16 quarters. The early 2014 slump follows a one-time surge that occurred a year earlier when some taxpayers accelerated payments on certain income to avoid new federal tax rates.
Looking ahead, tax revenue is expected to continue growing. Preliminary figures for October through December 2014 show increases in personal, sales, and total tax revenue, according to the Nelson A. Rockefeller Institute of Government.
As states regain fiscal ground lost in the recession, policymakers face pressure to catch up on investments and spending postponed because of the downturn. That may be more difficult in states where tax revenue remains below its previous peak. But even a return to peak levels can leave states with little extra to make up for cuts in federal aid or to pay for costs associated with population increases, growth in Medicaid enrollment, deferred needs, and accumulated debts.
Without adjusting for inflation, 50-state quarterly tax revenue was 12.0 percent above peak, and tax collections had recovered in 38 states as of the third quarter of 2014. Unadjusted figures do not take into account changes in the price of goods and services.
Adjusting for inflation is just one way to evaluate state tax revenue growth. Different insights would be gained by tracking revenue relative to population growth or state economic output.
Download the data to see individual state trends from the first quarter of 2006 to the third quarter of 2014. Visit The Pew Charitable Trusts’ interactive resource Fiscal 50: State Trends and Analysis to sort and analyze data for other indicators of state fiscal health.
Analysis by Barb Rosewicz and Alex Boucher


America’s Overdose Crisis
Sign up for our five-email course explaining the overdose crisis in America, the state of treatment access, and ways to improve care
Sign up

Fiscal 50: State Trends and Analysis
Sort and chart data about key fiscal and economic trends in the 50 states, and read Pew's insights.
ADDITIONAL RESOURCES

Fact Sheet

Podcast


