Revenue Volatility Varies Widely by State and Tax Type
These data have been updated. To see the most
recent data and analysis, visit Fiscal 50.
Note: This analysis was updated on Jan. 29, 2015, to express volatility scores as percentage points rather than as percents.
States experienced vastly different tax revenue fluctuations over the past two decades, with the greatest year-to-year volatility in Alaska and the least in South Dakota. These swings can confound efforts to balance state budgets. This first-of-its-kind assessment controls for the effect of known state tax law changes to reveal the underlying volatility of each state’s total tax revenue and major tax sources.
Each state’s overall revenue volatility springs from its unique mix of taxes. From fiscal year 1995 to 2013, corporate income tax and severance tax on oil and minerals consistently were more volatile than other major state taxes, such as those on personal income and sales of goods and services.
States choose what and how much to tax, but the volatility of individual tax streams is often influenced by factors outside policymakers’ control. Ups and downs in tax collections can be attributed to state economic factors—such as the mix of industry, natural resources, workforce, and population growth—and to federal budget changes and unforeseen events, such as natural disasters.
By altering tax policy, states can alter year-over-year increases or decreases in tax revenue. Removing the estimated effect of such policy changes from the calculation of each state’s volatility score reveals the underlying revenue trends and provides useful information for policymakers trying to plan for and manage revenue uncertainty in state budgets. After controlling for changes to state tax law, this analysis derives a volatility score for each state’s overall tax revenue and each of its major taxes—those that made up at least 5 percent of its tax revenue on average over the past 10 years. The score measures how much variation there is in year-over-year percent change between fiscal 1995 and 2013, based on a calculation of standard deviation. A low score means that revenue was similar from year to year, and a high one indicates that it grew or shrank more dramatically.
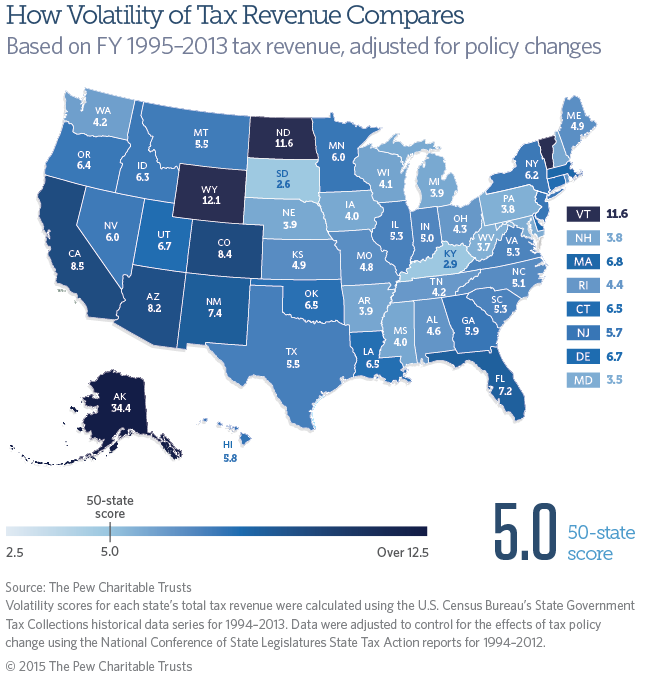
Alaska had the highest overall volatility score—34.4—meaning the state’s total tax revenue showed wide variability from year to year, typically fluctuating within 34.4 percentage points above or below its overall growth trend. The next most volatile tax revenue streams were in Wyoming (12.1) and in North Dakota and Vermont (both 11.6).
The states with the lowest volatility were South Dakota (2.6) and Kentucky (2.9). The majority of states had volatility scores clustered within a range of 3 to 7 percentage points.
An analysis of each state’s tax revenue fluctuations from fiscal 1995 to 2013 reveals that:
- Overall, 50-state tax revenue had a volatility score of 5.0. Compared with this national benchmark, 29 states had higher volatility and 21 had lower.
- Three of the four states with the greatest overall volatility received a substantial share of their tax dollars from severance taxes, which are affected by global energy prices. In 2013, severance taxes made up 78.3 percent of tax revenue in Alaska, 39.7 percent in Wyoming, and 46.4 percent in North Dakota.
- Among the states with low overall scores, Kentucky collected the bulk of its tax dollars from some of the least volatile personal income and sales tax streams in the country, and South Dakota relied primarily on one of the most stable streams of sales tax revenue.
- Corporate income tax revenue seesawed more than any other tax source in 24 of the 29 states where it was a major tax, and it was more volatile than personal income tax in all 25 states that collected both as a major tax. Its volatility score ranged from 59.0 in Alaska to 9.3 in New Hampshire.
- Severance tax was the most volatile revenue source in six of the nine states where it was a major tax, with volatility scores ranging from 39.7 in Alaska to 15.3 in West Virginia.
- Personal income tax fluctuated more than any other type of tax in nine of the 41 states that levy it. Volatility scores ranged from 13.4 in North Dakota to 3.5 in West Virginia.
- Sales tax was the most volatile major tax in only three of the 45 states that impose it: Nevada and Washington, which have no personal income tax, and Colorado, the only state where sales tax was more volatile than personal income tax among 38 states that collect both. Volatility scores for sales tax ranged from a high of 14.9 in Wyoming to a low of 2.8 in Kentucky.
Although most types of taxes tracked broader economic trends, some followed their own paths. As financial markets foundered and unemployment surged during the Great Recession, West Virginia benefited from high coal and natural gas prices and an increase in coal exports. In 2010, severance collections increased by 42.7 percent, helping to offset other revenue declines, including a 41.1 percent drop in corporate income tax revenue. As a result, West Virginia was one of the few states that did not tap its emergency reserves during the recession, according to Pew's report "Managing Uncertainty: How State Budgeting Can Smooth Revenue Volatility."
State tax collections have become more volatile over the past decade, according to a recent study by the Nelson A. Rockefeller Institute of Government. Added volatility complicates the already difficult tasks of revenue forecasting and budgeting, yet it is not inherently bad. When receipts are higher than anticipated, states can improve roads and bridges, pay down debt, or build up reserves. But periods of unexpectedly high revenue may just as easily be followed by years of unanticipated low revenue that prompt service cuts or tax increases to make ends meet. By studying volatility, policymakers can put in place evidence-based savings strategies that harness tax growth in good years to cushion the lean years.
Analysis by Steve Bailey and Brenna Erford

Fiscal 50: State Trends and Analysis
Explore fiscal and economic trends in the 50 states, then learn their significance with our expert analysis.


This video is hosted by YouTube. In order to view it, you must consent to the use of “Marketing Cookies” by updating your preferences in the Cookie Settings link below. View on YouTube
This video is hosted by YouTube. In order to view it, you must consent to the use of “Marketing Cookies” by updating your preferences in the Cookie Settings link below. View on YouTube
ADDITIONAL RESOURCES

Fact Sheet

Podcast


