More Imprisonment Does Not Reduce State Drug Problems
Data show no relationship between prison terms and drug misuse

Overview
Nearly 300,000 people are held in state and federal prisons in the United States for drug-law violations, up from less than 25,000 in 1980.1 These offenders served more time than in the past: Those who left state prisons in 2009 had been behind bars an average of 2.2 years, a 36 percent increase over 1990,2 while prison terms for federal drug offenders jumped 153 percent between 1988 and 2012, from about two to roughly five years.3
As the U.S. confronts a growing epidemic of opioid misuse, policymakers and public health officials need a clear understanding of whether, how, and to what degree imprisonment for drug offenses affects the nature and extent of the nation’s drug problems. To explore this question, The Pew Charitable Trusts examined publicly available 2014 data from federal and state law enforcement, corrections, and health agencies.4 The analysis found no statistically significant relationship between state drug imprisonment rates and three indicators of state drug problems: self-reported drug use, drug overdose deaths, and drug arrests.
The findings—which Pew sent to the President’s Commission on Combating Drug Addiction and the Opioid Crisis in a letter dated June 19, 2017—reinforce a large body of prior research that cast doubt on the theory that stiffer prison terms deter drug misuse, distribution, and other drug-law violations. The evidence strongly suggests that policymakers should pursue alternative strategies that research shows work better and cost less.
Sharp rise in federal drug imprisonment yields high cost, low returns
More than three decades ago, Congress responded to the rise of crack cocaine by requiring that more drug offenders go to prison and stay there longer.5 Largely as a result of those actions, between 1980 and 2015, the number of federal prisoners serving time for drug offenses soared from about 5,000 to 92,000, though changes in drug crime patterns and law enforcement practices also contributed to the growth.6 Although the share of federal inmates who are drug offenders has declined from its peak of 61 percent in 1994,7 it was still nearly 50 percent in 2015.8
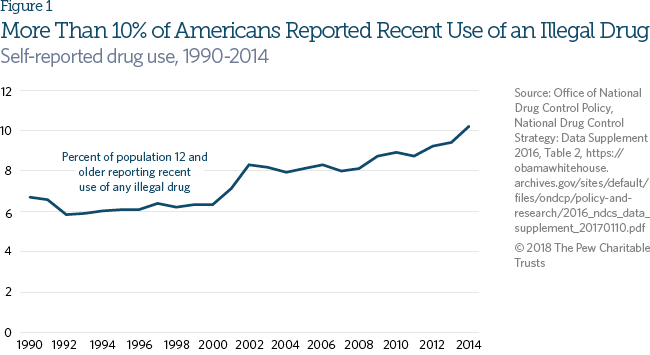
And as the federal prison population soared, spending ballooned 595 percent between 1980 and 2013 without delivering a convincing public safety return.9 In fact, self-reported use of illegal drugs increased between 1990 and 2014 (see Figure 1), as has the availability of heroin, cocaine, and methamphetamine as indicated by falling prices and a rise in purity.10 The surge in federal prison spending has also failed to reduce recidivism. The rate of federal drug offenders who leave prison and are placed on community supervision but commit new crimes or violate the conditions of their release has been roughly a third for more than three decades.11
Penalties do not match roles
Although federal sentencing laws have succeeded in putting some kingpins and other serious drug offenders behind bars, they have also led to lengthy imprisonment for lower-level offenders.12 The U.S. Sentencing Commission found that in 2009 the most serious traffickers—those defined as “high-level suppliers” or “importers” who rank at the top of the commission’s culpability scale—represented 11 percent of federal drug offenders.13 In contrast, nearly half of those sentenced for federal drug crimes in 2009 were lower-level actors, such as street dealers, couriers, and mules.14 Research indicates that the public safety impact of incapacitating these offenders is essentially nullified because they are rapidly replaced.15
Rise in opioid misuse
Lawmakers across the country are trying to address the rise in opioid misuse, which includes prescription drugs and illicitly manufactured heroin and fentanyl. In 2015, more than 33,000 Americans died from an opioid overdose, and heroin-related deaths climbed 20 percent from the previous year, according to the Centers for Disease Control and Prevention.16 In addition to lost lives and destabilized families and communities, these mortality rates take an extreme economic toll. The costs of opioid misuse totaled $504 billion in 2015, according to a recent report from the White House Council of Economic Advisers.17
Prescription opioids are more widely misused than heroin, and nearly 80 percent of today’s heroin users said they previously misused prescription opioids.18 Changes in the prescription opioid market may have spurred some users to shift to heroin.19 For example, one study found that in a population of OxyContin users, heroin use nearly doubled within 18 months after the medication was reformulated in 2010 to deter misuse by making it harder to crush the tablets.20 Heroin also costs less and is easier to acquire than prescription opioids in some communities.21
Drug imprisonment varies widely by state
Although federal courts garner more public attention, most of the nation’s criminal justice system is administered by the states, and state laws determine criminal penalties for most drug offenses. But the 50 states have made different policy choices regarding drug penalties, which has led to considerable variation in drug imprisonment rates. (See Figure 2.)
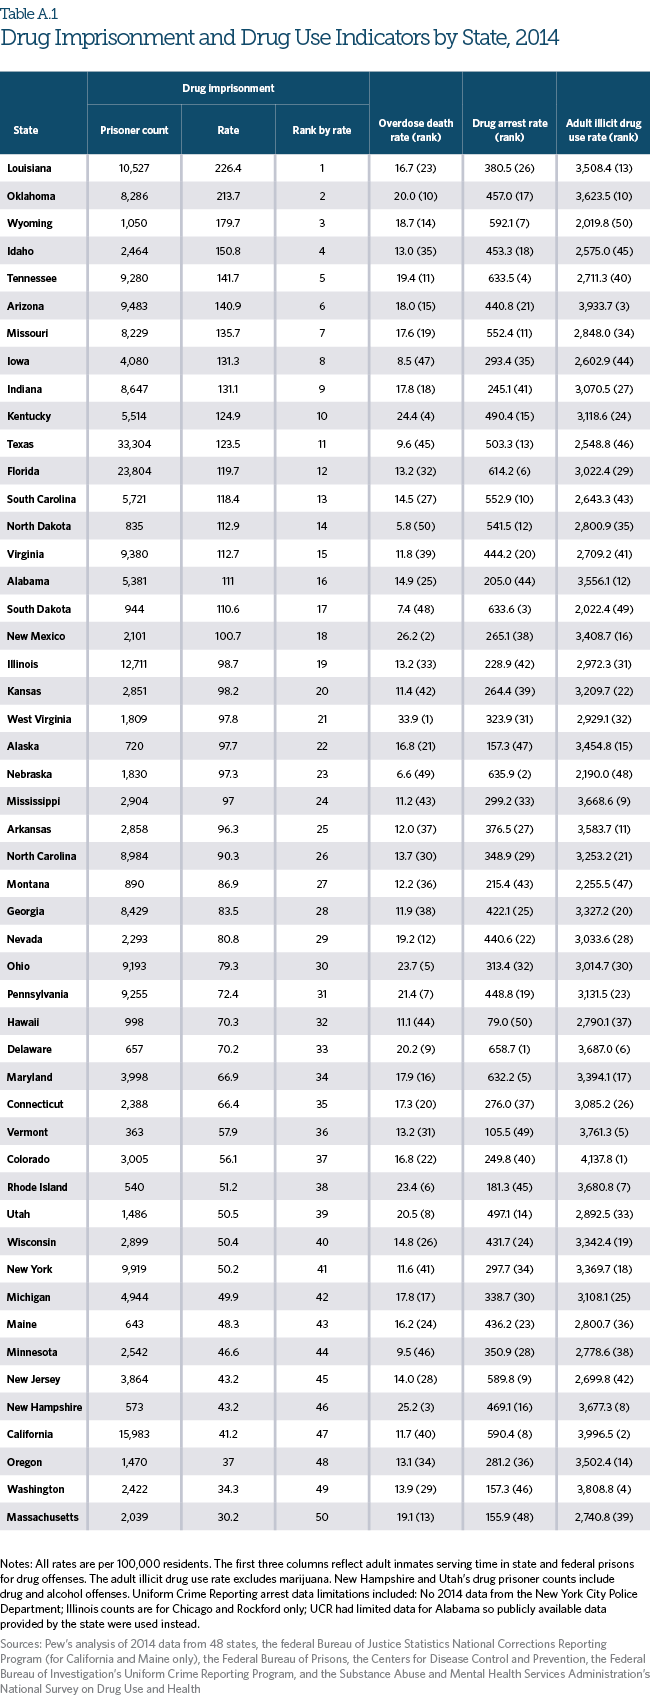
In 2014, Louisiana had the highest drug-offender imprisonment rate in the nation at 226.4 per 100,000 residents, more than twice the rate of 37 other states. In contrast, Massachusetts’ drug imprisonment rate was the lowest at 30.2 per 100,000 residents, less than one-seventh Louisiana’s. In raw numbers, Louisiana had more drug offenders in prison on the last day of 2014 than every state except California, Florida, Illinois, and Texas, which have much larger populations. The country’s second-highest drug imprisonment rate, 213.7 per 100,000 residents, was in Oklahoma and was more than double the rates in two neighboring states, Kansas and Arkansas. (See Table A.1 for more information.)
Lawmakers across the country are trying to address the rise in opioid misuse, which includes prescription drugs and illicitly manufactured heroin and fentanyl. In 2015, more than 33,000 Americans died from an opioid overdose, and heroin-related deaths climbed 20 percent from the previous year, according to the Centers for Disease Control and Prevention.
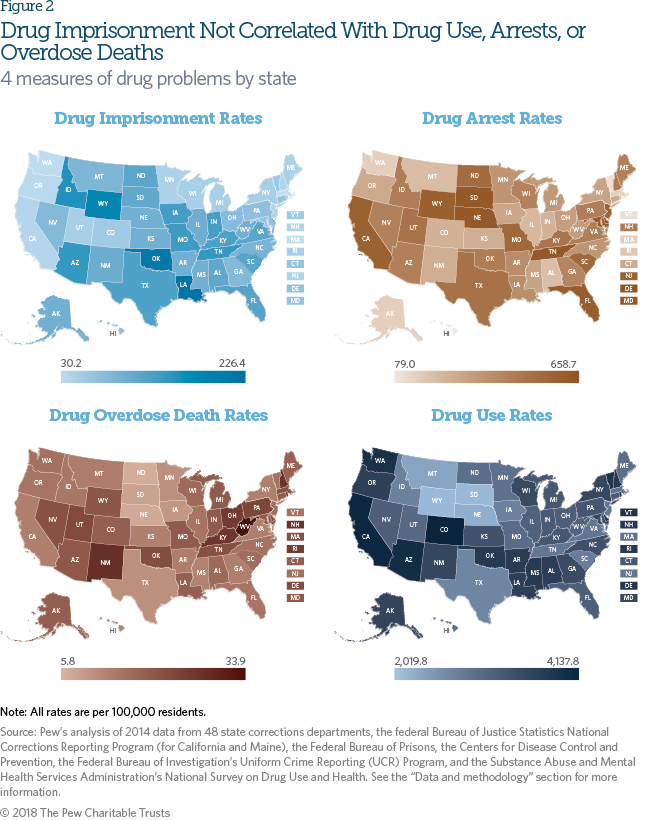
No relationship between drug imprisonment rates and states’ drug problems
One primary reason for sentencing an offender to prison is deterrence—conveying the message that losing one’s freedom is not worth whatever one gains from committing a crime. If imprisonment were an effective deterrent to drug use and crime, then, all other things being equal, the extent to which a state sends drug offenders to prison should be correlated with certain drug-related problems in that state. The theory of deterrence would suggest, for instance, that states with higher rates of drug imprisonment would experience lower rates of drug use among their residents.
To test this, Pew compared state drug imprisonment rates with three important measures of drug problems— self-reported drug use (excluding marijuana), drug arrest, and overdose death—and found no statistically significant relationship between drug imprisonment and these indicators. In other words, higher rates of drug imprisonment did not translate into lower rates of drug use, arrests, or overdose deaths.
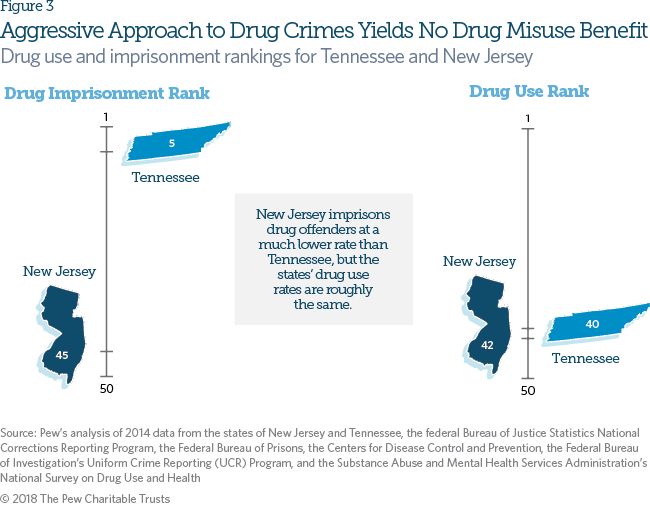
State pairings offer illustrative examples. For instance, Tennessee imprisons drug offenders at more than three times the rate of New Jersey, but the states’ rates of self-reported drug use are virtually the same. (See Figure 3.) Conversely, Indiana and Iowa have nearly identical rates of drug imprisonment, but Indiana ranks 27th among states in self-reported drug use and 18th in overdose deaths compared with 44th and 47th, respectively, for Iowa.
If imprisonment were an effective deterrent to drug use and crime, then, all other things being equal, the extent to which a state sends drug offenders to prison should be correlated with certain drug-related problems in that state.
The results hold even when controlling for standard demographic variables, including the percentage of the population with bachelor’s degrees, the unemployment rate, the percentage of the population that is nonwhite, and median household income. (See the “Data and methodology” section for more information.)
Some associations (though not causal relationships) did emerge among the demographic variables. The larger the share of a state’s population that:
- Has a bachelor’s degree, the lower the drug imprisonment rate.
- Is not white, the higher the drug imprisonment rate.
- Is unemployed, the lower the drug imprisonment rate.
Effective policies for curtailing drug misuse
The absence of any relationship between states’ rates of drug imprisonment and drug problems suggests that expanding imprisonment is not likely to be an effective national drug control and prevention strategy. The statelevel analysis reaffirms the findings of previous research demonstrating that imprisonment rates have scant association with the nature and extent of the harm arising from illicit drug use. For example, a 2014 National Research Council report found that mandatory minimum sentences for drug and other offenders “have few, if any, deterrent effects.”22 The finding was based, in part, on decades of observation that when street-level drug dealers are apprehended and incarcerated they are quickly and easily replaced.
On the other hand, reduced prison terms for certain federal drug offenders have not led to higher recidivism rates. In 2007, the Sentencing Commission retroactively cut the sentences of thousands of crack cocaine offenders, and a seven-year follow-up study found no increase in recidivism among offenders whose sentences were shortened compared with those whose were not.23 In 2010, Congress followed the commission’s actions with a broader statutory decrease in penalties for crack cocaine offenders.24
These and other research findings suggest that the most effective response to drug misuse is a combination of law enforcement to curtail trafficking and prevent the emergence of new markets; alternative sentencing to divert nonviolent drug offenders from costly imprisonment; treatment to reduce dependency and recidivism; and prevention efforts that can identify individuals at high risk for substance use disorders.
Law enforcement strategies. A 2014 report by the Police Executive Research Forum found that law enforcement agencies in several states are collaborating with other stakeholders to develop alternative approaches to drug offenders, such as diverting those with substance use disorders into treatment.25 Another model involves harmreduction strategies, such as training law enforcement officers in overdose prevention and community policing in neighborhoods with emerging heroin markets.26 These interventions include collaborating with community organizations to dismantle open-air street markets by, among other things, telling drug dealers face to face that they will probably face punishment if they continue to sell drugs.27 When offered options and assistance, many dealers accept; drug offenses in targeted jurisdictions have dropped by as much as 55 percent.28
Alternative sentencing strategies. Over the past 10 years, many states have revised their drug penalties and reduced their prison populations without seeing an increase in crime rates. In 2010, as part of a larger reform effort, South Carolina expanded probation and parole opportunities for people convicted of drug offenses.29 The state’s reform bill passed unanimously in the Senate and by a vote of 97 to 4 in the House of Representatives.30 Since the legislation was enacted, South Carolina’s prison population has decreased by 14 percent, and people convicted of violent offenses now make up a larger proportion of the state’s inmates.31 In addition, the violent crime rate dropped by 16 percent between 2010 and 2015.32
Michigan, New York, and Rhode Island also significantly decreased drug sentences, with Michigan and Rhode Island rolling back mandatory minimum penalties for drug offenses.33 Each of these states reduced their prison populations and their crime rates.34 More recently, Mississippi, Alaska, and Maryland have changed their drug sentencing and related policies, including revising mandatory minimums, reducing sentencing ranges, and establishing presumptive probation for certain offenses.35 And in the 2016 election, 58 percent of Oklahoma voters approved a ballot measure that converted drug possession from a felony to a misdemeanor.36
Although lengthy prison sentences for drug offenders have shown a poor return on taxpayer investment, alternatives such as drug courts and stronger community supervision have proved more effective. A systematic review of drug courts in 30 states concluded that a combination of comprehensive services and individualized care is an effective way to treat offenders with serious addictions.37 Meanwhile, supervision strategies that provide swift, certain, and graduated sanctions for violations and rewards for compliance have been shown to reduce recidivism and costs.38 Texas, Georgia, North Carolina, and South Carolina have saved hundreds of millions of dollars by taking alternative approaches.39
The absence of any relationship between states’ rates of drug imprisonment and drug problems suggests that expanding drug imprisonment is not likely to be an effective national drug control and prevention strategy.
Treatment strategies. An estimated 22 million Americans needed substance use treatment in 2015, but only about 1 in 10 received it.40 Medication-assisted treatment (MAT)—a combination of psychosocial therapy and U.S. Food and Drug Administration (FDA)-approved medication—is the most effective intervention to treat opioid use disorder.41 Yet only 23 percent of publicly funded treatment programs report offering any FDAapproved medications, and fewer than half of private sector facilities report doing so.42
Many states and localities are expanding drug treatment programs to address opioid misuse. In March 2015, Kentucky enacted a law eliminating barriers to treatment in county jails and providing funds for evidence-based behavioral health or medication-assisted treatment for inmates with an opioid use disorder.43 It also allows local health departments to establish needle exchange sites, increases access to naloxone (a prescription drug shown to counter the effects of an opioid overdose), and supports individuals recovering from an overdose by connecting them to treatment services and prohibiting their possible prosecution for drug possession.44
Prevention strategies. Several evidence-based approaches are available to help patients and medical providers ensure appropriate use of prescribed opioids. One, a patient review and restriction (PRR) program, identifies individuals at risk for prescription misuse and ensures that they receive controlled substance prescriptions only from designated pharmacies and prescribers.45 Another approach is prescription drug monitoring programs (PDMPs), state-based electronic databases of controlled substance prescriptions dispensed by pharmacies and prescribers. PDMPs allow prescribers, pharmacists, and other authorized stakeholders to monitor patients’ controlled substance prescriptions and enable states to track prescribing practices and population-level drug use trends.46
Public supports alternatives for drug offenses
Across demographic groups and political parties, U.S. voters strongly support a range of major changes in how the states and federal government punish people who commit drug offenses. A nationwide telephone survey of 1,200 registered voters, conducted for Pew in 2016 by the Mellman Group and Public Opinion Strategies, found that nearly 80 percent favor ending mandatory minimum sentences for drug offenses.47 By wide margins, voters also backed other reforms that would reduce the federal prison population. More than 8 in 10 favored permitting federal prisoners to cut their time behind bars by up to 30 percent by participating in drug treatment and job training programs that are shown to decrease recidivism. Sixty-one percent believed prisons hold too many drug offenders and that more prison space should be dedicated to “people who have committed acts of violence or terrorism.”
A minority of voters backed tough prison terms for drug offenses. Twenty percent said drug couriers or mules should receive a 10-year minimum sentence, and 25 percent said drug dealers who sold illegal substances on the street deserved a minimum 10-year term. In addition, 34 percent believed that drug offenders “belong behind bars,” and 22 percent thought sentences for people convicted of federal drug offenses were “too lenient.”48
Across demographic groups and political parties, U.S. voters strongly support a range of major changes in how the states and the federal government punish people who commit drug offenses.
In addition, public opinion polls in four states, also conducted for Pew by the Mellman Group and Public Opinion Strategies between February 2015 and March 2017, reveal significant and broad political support for reducing prison sentences for nonviolent offenders and reinvesting the savings in alternatives, including drug treatment.
- Maryland.49
- 75 percent agreed that imposing longer prison terms “is the wrong way to break the cycle of crime and addiction” and that a “more effective strategy is to put drug-addicted offenders into treatment programs and community supervision and to hold them accountable with community service or short stays in jail if they continue to use drugs or fail to go to treatment.”
- More than 8 in 10 (83 percent) favored giving judges more discretion in deciding sentences for drug offenses.
- 86 percent supported “allowing nonviolent offenders to earn additional time off of their prison term for completing substance abuse and mental health treatment programs while in prison.”
- Utah.50
- 73 percent of state voters—including 74 percent of Republicans, 73 percent of independents, and 71 percent of Democrats—favored a bipartisan commission’s recommendation to reclassify simple drug possession from a felony to a misdemeanor.
- 70 percent believed that “prison is not the best place for people who are addicted to drugs. Requiring offenders to get treatment and increasing community supervision rather than sending them to prison will more effectively stop the cycle of addiction and make our communities safer.”
- 85 percent expressed support for “shorter prison sentences for inmates who complete rehabilitative substance abuse and mental health treatment programs while in prison.”
- Oklahoma.51
- 84 percent of respondents believed prison sentences for nonviolent offenders should be shortened and that the resulting savings should be reinvested in probation, parole, and substance abuse and mental health treatment.
- 86 percent favored allowing people on probation or parole the chance to reduce their supervision periods by engaging in good behavior or participating in substance abuse or mental health treatment programs.
- Support for both of these reforms spanned political parties and demographic groups.
- Louisiana.52
- Nearly two-thirds of Louisiana voters (63 percent)—including 54 percent of Republicans, 66 percent of independents, and 69 percent of Democrats—approved of a proposal to reduce penalties for lower-level drug offenses while keeping long sentences for higher-level drug dealers.
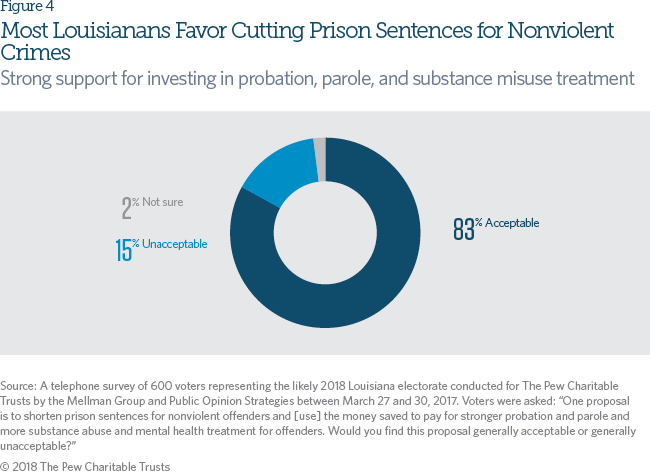
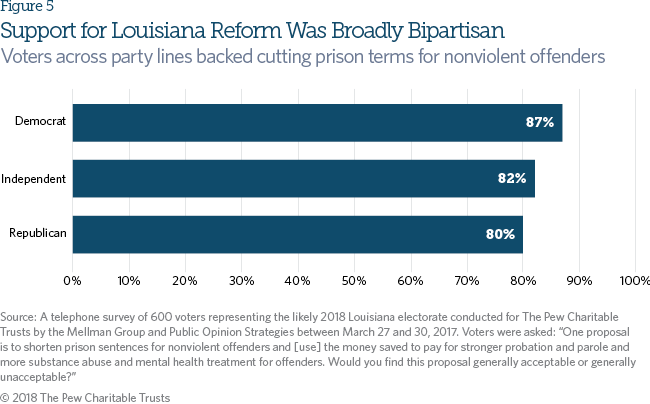
- 83 percent favored a proposal to cut prison sentences for nonviolent crimes and use the resulting savings for “stronger probation and parole and more substance abuse and mental health treatment for offenders.” (See Figure 4.) Consensus was broadly bipartisan for this question as well, with backing from 80 percent of Republicans, 82 percent of independents, and 87 percent of Democrats. (See Figure 5.)
Conclusion
Although no amount of policy analysis can resolve disagreements about how much punishment drug offenses deserve, research does make clear that some strategies for reducing drug use and crime are more effective than others and that imprisonment ranks near the bottom of that list. And surveys have found strong public support for changing how states and the federal government respond to drug crimes.
Putting more drug-law violators behind bars for longer periods of time has generated enormous costs for taxpayers, but it has not yielded a convincing public safety return on those investments. Instead, more imprisonment for drug offenders has meant limited funds are siphoned away from programs, practices, and policies that have been proved to reduce drug use and crime.
Data and methodology
This analysis used imprisonment data collected from state corrections departments, the Bureau of Justice Statistics National Corrections Reporting Program (for California and Maine only), and the Federal Bureau of Prisons. Imprisonment data included offenders in state and federal facilities; federal drug offenders were assigned to state counts based on the location of the federal district court in which they were sentenced. Inmates were considered “drug offenders” if their “most serious” or “controlling” offense was for a drug crime, including all drugs and all levels of drug offenses (ranging from possession to trafficking). Correctional facilities in the District of Columbia were not included in the analysis. Federal offenders in community corrections, military, and foreign facilities and local jail inmates (up to 70 percent of whom are being held pending trial53) also were not included.
Drug use rates were reported by the National Survey on Drug Use and Health (NSDUH), an annual survey of randomly selected individuals 12 and older, sponsored by the Substance Abuse and Mental Health Services Administration, an agency in the U.S. Department of Health and Human Services. This analysis utilized 2013-14 NSDUH data for adults 18 or older, comprising approximately 96,000 individuals. For this brief, illicit drug use rates excluded marijuana, which has been legalized for medicinal and recreational use in several states.
Overdose death rates came from the Centers for Disease Control and Prevention and the FBI’s Uniform Crime Reporting Program (UCR) reported drug arrest rates. The state-level drug arrest rates include marijuana since UCR data is not broken out by drug type.
Unless otherwise noted, all data are from 2014, the most recent year for which complete data are available for each of the four measures. Data on drug treatment admissions and unmet drug treatment need by state were excluded because the availability of drug treatment depends on a range of factors (including state funding levels) that make such data a relatively poor indicator of the extent of a state’s drug problems.
To measure whether a relationship exists between drug imprisonment rates and state drug problems, Pew performed a simple regression test. The statistical model isolated the correlation between states’ drug problems and drug offender imprisonment rates and controlled for standard demographic variables, including the percentage of the population with bachelor’s degrees, the unemployment rate, the percentage of the population that is nonwhite, and median household income in each respective state. Demographic data were drawn from the U.S. Census Bureau, and unemployment and income data were derived from the U.S. Bureau of Labor Statistics. The analysis did not draw conclusions about causality between state drug imprisonment rates and the aforementioned indicators of state drug problems.
The 2016 nationwide poll cited in this report captures findings from a telephone survey of 1,200 registered voters conducted for Pew by The Mellman Group and Public Opinion Strategies between Jan. 13 and 19, 2016, that included cellphones and landlines randomly selected from official voter lists. The margin of error for the survey was plus or minus 2.8 percent at the 95 percent confidence level and higher for subgroups.
The four state polls also capture findings of telephone surveys—also conducted by the Mellman Group and Public Opinion Strategies—of 600 likely voters per state, which similarly included cellphones and landlines selected from official voter lists. Each survey had a margin of error of plus or minus 4.0 percent at the 95 percent confidence level and higher for subgroups. The field dates for the state surveys were Feb. 16-19, 2015, for Utah; Feb. 17-21, 2016, for Maryland; March 6-10, 2017, for Oklahoma; and March 27-30, 2017, for Louisiana.
Appendix
External reviewers
The document was reviewed by Jonathan Caulkins of Carnegie Mellon University, Peter Reuter of the University of Maryland, College Park, and Sally Satel of the American Enterprise Institute. Although the reviewers provided many constructive comments and suggestions, neither they nor their organizations necessarily endorse the conclusions or recommendations.
Acknowledgments
This brief was prepared by Pew staff members Adam Gelb, Phillip Stevenson, Adam Fifield, Monica Fuhrmann, Laura Bennett, Jake Horowitz, and Erinn Broadus. The team thanks Pew colleagues Alex Duncan, Casey Ehrlich, Justine Calcagno, Peter Wu, Timothy Cordova, and Abby Walsh for research support; and Ken Willis, Krista MacPherson, Cindy Murphy-Tofig, Jennifer V. Doctors, Jennifer Peltak, Maria Borden, and Lisa Plotkin for their assistance with production and distribution.
Endnotes
- E. Ann Carson and Elizabeth Anderson, “Prisoners in 2015,” U.S. Department of Justice, Bureau of Justice Statistics (2016), https://www.bjs.gov/content/pub/pdf/p15.pdf; Tracy L. Snell, “Correctional Populations in the United States, 1993,” Bureau of Justice Statistics (1995), https://www.bjs.gov/content/pub/pdf/cpop93bk.pdf; University at Albany, Sourcebook of Criminal Justice Statistics 2003, Table 6.57, http://www.albany.edu/sourcebook/pdf/t657.pdf.
- The Pew Charitable Trusts, “Time Served: The High Cost, Low Return of Longer Prison Terms” (2012), 19, http://www.pewtrusts.org/~/media/assets/2012/06/06/ time_served_report.pdf.
- The Pew Charitable Trusts, “Federal Drug Sentencing Laws Bring High Cost, Low Return” (2015), http://www.pewtrusts.org/en/research-and-analysis/issue-briefs/2015/08/federal-drug-sentencing-laws-bring-high-cost-low-return.
- Pew’s analysis was based on 2014 data from 48 states; the federal Bureau of Justice Statistics National Corrections Reporting Program (for California and Maine only); the Federal Bureau of Prisons; the Centers for Disease Control and Prevention, “Drug Overdose Death Data,” 2014 data, https://www.cdc.gov/drugoverdose/data/statedeaths.html; the Federal Bureau of Investigation’s Uniform Crime Reporting Program, “Crime in the United States 2014” (2014), https://ucr.fbi.gov/crime-in-the-u.s/2014/crime-in-the-u.s.-2014; and the Substance Abuse and Mental Health Services Administration’s National Survey on Drug Use and Health, “Population Data / NSDUH,” 2014 data, https://www.samhsa.gov/data/population-data-nsduh/reports?tab=33.
- Nathan James, “The Federal Prison Population Buildup: Overview, Policy Changes, Issues, and Options” (2014), https://ia601308.us.archive.org/7/items/ R42937TheFederalPrisonPopulationBuildupOverviewPolicyChangesIssuesandOptions-crs/R42937 The Federal Prison Population Buildup_ Overview, Policy Changes, Issues, and Options.pdf; U.S. Sentencing Commission, “1995 Report to the Congress: Cocaine and Federal Sentencing Policy” (1995) Chapter 6, http://www.ussc.gov/research/congressional-reports/1995-report-congress-cocaine-and-federal-sentencing-policy.
- Carson and Anderson, “Prisoners in 2015”; University at Albany, Sourcebook of Criminal Justice Statistics.
- University at Albany, Sourcebook of Criminal Justice Statistics.
- Carson and Anderson, “Prisoners in 2015.”
- The Pew Charitable Trusts, “Federal Prison System Shows Dramatic Long-Term Growth” (2015), http://www.pewtrusts.org/en/research-and-analysis/fact-sheets/2015/02/federal-prison-system-shows-dramatic-long-term-growth.
- Office of National Drug Control Policy, “National Drug Control Strategy: Data Supplement 2016,” Tables 1, 2, 73, 74, and 75, https://obamawhitehouse.archives.gov/sites/default/files/ondcp/policy-and-research/2016_ndcs_data_supplement_20170110.pdf. Pew used the 1990-2012 period to capture all available yearly data.
- Bureau of Justice Statistics, “Federal Justice Statistics,” Statistical Tables Series 2005-12, http://www.bjs.gov/index.cfm?ty=tp&tid=65; Bureau of Justice Statistics, “Compendium of Federal Justice Statistics,” Series 1984-2004, https://www.bjs.gov/index.cfm?ty=pbse&sid=4.
- The Pew Charitable Trusts, “Federal Drug Sentencing Laws.”
- U.S. Sentencing Commission, “2011 Report to the Congress: Mandatory Minimum Penalties in the Federal Criminal Justice System” (October 2011), Chapter 8, https://www.ussc.gov/research/congressional-reports/2011-report-congress-mandatory-minimum-penalties-federal-criminal-justice-system.
- Ibid., Appendix D, Figure D-2.
- Mark A.R. Kleiman, “Toward (More Nearly) Optimal Sentencing for Drug Offenders,” Criminology & Public Policy 3, no. 3 (2004): 435–440, https://drive.google.com/file/d/0B6taQDF0rdAwYnJNTDU2bDVBNFU/edit.
- Centers for Disease Control and Prevention, “Opioid Overdose,” accessed on May 15, 2017, https://www.cdc.gov/drugoverdose; Centers for Disease Control and Prevention, “Heroin Overdose Data,” accessed May 19, 2017, https://www.cdc.gov/drugoverdose/data/heroin.html.
- White House Council of Economic Advisers, “The Underestimated Cost of the Opioid Crisis” (2017), https://www.whitehouse.gov/sites/whitehouse.gov/files/images/The Underestimated Cost of the Opioid Crisis.pdf.
- Substance Abuse and Mental Health Services Administration, Center for Behavioral Health Statistics and Quality, “Results From the 2015 National Survey on Drug Use and Health: Detailed Tables” (2016), https://www.samhsa.gov/data/sites/default/files/NSDUH-DetTabs-2015/NSDUH-DetTabs-2015/NSDUH-DetTabs-2015.pdf; Pradip K. Muhuri, Joseph C. Gfroerer, and M. Christine Davies, “CBHSQ Data Review: Associations of Nonmedical Pain Reliever Use and Initiation of Heroin Use in the United States,” Substance Abuse and Mental Health Services Administration (2013), abstract, http://www.samhsa.gov/data/sites/default/files/DR006/DR006/nonmedical-pain-reliever-use-2013.htm.
- The Pew Charitable Trusts, “Public Safety Aspects of the Heroin Abuse Epidemic” (2015), http://www.pewtrusts.org/en/research-and-analysis/issue-briefs/2015/07/public-safety-aspects-of-the-heroin-abuse-epidemic.
- Theodore J. Cicero, Matthew S. Ellis, and Hilary L. Surratt, “Effect of Abuse-Deterrent Formulation of OxyContin,” New England Journal of Medicine 367, no. 2 (2012): 187–189, http://www.nejm.org/doi/pdf/10.1056/NEJMc1204141.
- Nora D. Volkow (director of the National Institute on Drug Abuse), statement before the U.S. Senate Caucus on International Narcotics Control, 113th Cong. (2014), https://www.drugabuse.gov/about-nida/legislative-activities/testimony-to-congress/2016/americas-addiction-to-opioids-heroin-prescription-drug-abuse.
- National Research Council, The Growth of Incarceration in the United States: Exploring Causes and Consequences (Washington, D.C.: The National Academies Press, 2014), 347.
- U.S. Sentencing Commission, “U.S. Sentencing Commission Votes Unanimously to Apply Amendment Retroactively for Crack Cocaine Offenses,” news release, Dec. 11, 2007, http://www.ussc.gov/about/news/press-releases/december-11-2007; Kim Steven Hunt and Andrew Peterson, “Recidivism Among Offenders Receiving Retroactive Sentence Reductions: The 2007 Crack Cocaine Amendment” (2014), U.S. Sentencing Commission, https://www.ussc.gov/sites/default/files/pdf/research-and-publications/research-projects-and-surveys/miscellaneous/20140527_Recidivism_2007_Crack_Cocaine_Amendment.pdf.
- U.S. Sentencing Commission, “U.S. Sentencing Commission Reports on Impact of Fair Sentencing Act of 2010,” news release, Aug. 3, 2015, http://www.ussc.gov/sites/default/files/pdf/news/press-releases-and-news-advisories/press-releases/20150803_Press_Release.pdf.
- Police Executive Research Forum, “New Challenges for Police: A Heroin Epidemic and Changing Attitudes Toward Marijuana” (2014), http://www.policeforum.org/assets/docs/Critical_Issues_Series_2/a heroin epidemic and changing attitudes toward marijuana.pdf.
- Jonathan P. Caulkins and Peter Reuter, “Towards a Harm-Reduction Approach to Enforcement,” Safer Communities 8, no. 1 (2009): 12-15, http://www.ukdpc.org.uk/wp-content/uploads/Article - Safer Communities Special Issue_ Law enforcement to reduce drug harms.pdf. The authors assess tactics used by law enforcement in the United Kingdom.
- Nicholas Corsaro et al., “The Impact of Drug Market Pulling Levers Policing on Neighborhood Violence: An Evaluation of the High Point Drug Market Intervention,” Criminology & Public Policy 11, no. 2 (2012), http://onlinelibrary.wiley.com/doi/10.1111/j.1745-9133.2012.00798.x/pdf.
- National Network for Safe Communities, “Drug Market Intervention,” https://nnscommunities.org/our-work/strategy/drug-market-intervention.
- The Pew Charitable Trusts, “South Carolina’s Public Safety Reform” (2010), http://www.pewtrusts.org/~/media/assets/2010/06/10/ pspp_south_carolina_brief.pdf.
- Ibid.
- Bryan P. Stirling, “South Carolina’s Prison System: Report to the Sentencing Reform Oversight Committee,” South Carolina Department of Corrections (Nov. 28, 2016).
- Federal Bureau of Investigation Uniform Crime Reports. See also FBI, “Crime in the United States, 2010,” Table 5, https://ucr.fbi.gov/crime-in-the-u.s/2010/crime-in-the-u.s.-2010/tables/10tbl05.xls; Federal Bureau of Investigation, “Crime in the United States, 2015,” Table 5, https://ucr.fbi.gov/crime-in-the-u.s/2015/crime-in-the-u.s.-2015/tables/table-5.
- Families Against Mandatory Minimums, “Recent State-Level Reforms to Mandatory Minimums Laws” (2017), http://famm.org/wpcontent/uploads/2017/05/Recent-State-Reforms-May-2017.pdf.
- The Pew Charitable Trusts, “National Imprisonment and Crime Rates Continue to Fall” (2016), http://www.pewtrusts.org/en/research-and-analysis/fact-sheets/2016/12/national-imprisonment-and-crime-rates-continue-to-fall. For a discussion of the complex relationship between imprisonment and crime, see The Pew Charitable Trusts, “Q & A: Weighing Imprisonment and Crime” (2015), http://www.pewtrusts.org/en/research-and-analysis/q-and-a/2014/09/weighing-imprisonment-and-crime.
- The Pew Charitable Trusts, “33 States Reform Criminal Justice Policies Through Justice Reinvestment” (2016), http://www.pewtrusts.org/en/research-and-analysis/fact-sheets/2016/11/33-states-reform-criminal-justice-policies-through-justice-reinvestment.
- Sean Murphy, “Voters Provide Momentum to More Criminal Justice Changes,” Associated Press, Nov. 12, 2016, https://www.apnews.com/34dff70081024d8fb452c0a463378580.
- Ojmarrh Mitchell et al., “Drug Courts’ Effects on Criminal Offending for Juveniles and Adults” (2012), https://www.campbellcollaboration.org/library/drug-courts-effects-on-criminal-offending.html.
- Angela Hawken and Mark Kleiman, “Managing Drug Involved Probationers With Swift and Certain Sanctions: Evaluating Hawaii’s HOPE” (2009), National Institute of Justice, https://www.ncjrs.gov/pdffiles1/nij/grants/229023.pdf.
- Marc Levin, “Adult Corrections Reform: Lower Crime, Lower Costs” (2011), Texas Public Policy Foundation, http://www.texaspolicy.com/library/doclib/2011-09-PB44-TexasModel-AdultCorrections-CEJ-MarcLevin.pdf; Samantha Harvell et al., “Reforming Sentencing and Corrections Policy: The Experience of Justice Reinvestment Initiative States,” Urban Institute (2016), http://www.urban.org/sites/default/files/publication/86691/ reforming_sentencing_and_corrections_policy_1.pdf.
- Substance Abuse and Mental Health Services Administration, “Key Substance Use and Mental Health Indicators in the United States: Results From the 2015 National Survey on Drug Use and Health” (2016), https://www.samhsa.gov/data/sites/default/files/NSDUH-FFR1-2015/NSDUH-FFR1-2015/NSDUH-FFR1-2015.pdf.
- The Pew Charitable Trusts, “The Case for Medication-Assisted Treatment” (2017), http://www.pewtrusts.org/en/research-and-analysis/fact-sheets/2017/02/the-case-for-medication-assisted-treatment.
- Hannah K. Knudsen, Paul M. Roman, and Carrie B. Oser, “Facilitating Factors and Barriers to the Use of Medications in Publicly Funded Addiction Treatment Organizations,” Journal of Addiction Medicine 4, no. 2 (2010): 99–107, https://www.ncbi.nlm.nih.gov/pubmed/20835350; Hannah K. Knudsen, Amanda J. Abraham, and Paul M. Roman, “Adoption and Implementation of Medications in Addiction Treatment Programs,” Journal of Addiction Medicine 5, no. 1 (2011): 21–7, http://www.ncbi.nlm.nih.gov/pubmed/21359109.
- Kentucky State Legislature, S.B. 192 (2015), http://www.lrc.ky.gov/record/15RS/SB192.htm.
- Ibid.
- The Pew Charitable Trusts, “Using Patient Review and Restriction Programs to Protect Patients at Risk of Opioid Misuse and Abuse” (2015),http://www.pewtrusts.org/en/research-and-analysis/fact-sheets/2015/07/using-patient-review-and-restriction-programs-to-protect-patients-at-risk-of-opioid-misuse-and-abuse.
- The Pew Charitable Trusts, “Prescription Drug Monitoring Programs” (2016), http://www.pewtrusts.org/en/research-and-analysis/reports/2016/12/prescription-drug-monitoring-programs.
- The Pew Charitable Trusts, “Voters Want Big Changes in Federal Sentencing, Prison System” (2016), http://www.pewtrusts.org/en/research-and-analysis/analysis/2016/02/12/voters-want-changes-in-federal-sentencing-prison-system. For top line results, see http://www.pewtrusts.org/~/media/assets/2018/02/ national_sentencing_survey_2016.pdf.
- Ibid.
- The Mellman Group and Public Opinion Strategies, “Maryland Statewide Survey” (2016). For top line results, see http://www.pewtrusts.org/~/media/assets/2018/02/ maryland_statewide_survey_2016.pdf.
- The Mellman Group and Public Opinion Strategies, “Utah Statewide Survey” (2015). For top line results, see http://www.pewtrusts.org/~/media/assets/2018/02/ utah_statewide_survey_2015.pdf.
- The Mellman Group and Public Opinion Strategies, “Oklahoma Statewide Survey” (2017). For top line results, see http://www.pewtrusts.org/~/media/assets/2018/02/ oklahoma_statewide_survey_2017.pdf.
- The Mellman Group and Public Opinion Strategies, “Louisiana Statewide Survey” (2017). For top line results, see http://www.pewtrusts.org/~/media/assets/2018/02/ louisiana_statewide_survey_2017.pdf.
- According to one estimate, about 150,000 people were held in local jails on drug charges in 2015; about 70 percent of them were not convicted but were being held pending trial. See Prison Policy Initiative, “Mass Incarceration: The Whole Pie 2017” (2017), https://www.prisonpolicy.org/reports/pie2017.html.


Drug Arrests Stayed High Even as Imprisonment Fell


Surge in Methamphetamine Requires Multifaceted Response


Opioid Use Disorder Treatment in Jails and Prisons


