Punishment Rate Measures Prison Use Relative to Crime
Metric offers new perspective on state incarceration levels
Overview
Researchers, policymakers, and the public rely on a variety of statistics to measure how society punishes crime. Among the most common is the imprisonment rate—the number of people in prison per 100,000 residents. This metric allows for comparisons of prison use over time and across jurisdictions and is widely seen as a proxy for punishment. States with high imprisonment rates, for example, are considered more punitive than those with low rates.
A more nuanced assessment of punishment than the ratio of inmates to residents is that of inmates to crime— what The Pew Charitable Trusts calls the “punishment rate.” This new metric gauges the size of the prison population relative to the frequency and severity of crime reported in each jurisdiction, putting the imprisonment rate in a broader context.
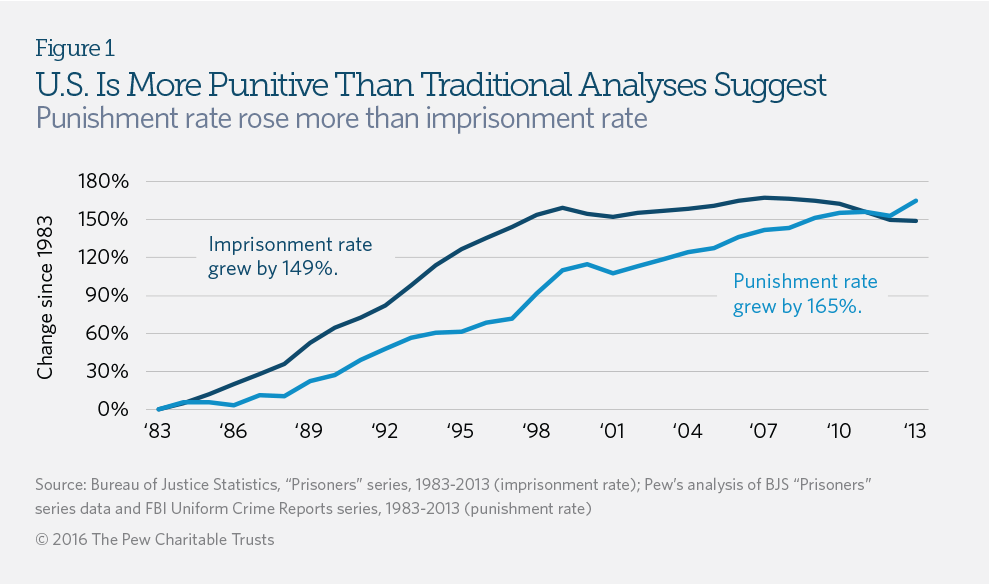
Using the punishment rate to examine the U.S. criminal justice system, Pew found that all states became more punitive from 1983 to 2013, even though they varied widely in the amount of punishment they imposed. The analysis also shows that the nation as a whole has become more punitive than the imprisonment rate alone indicates. (See Figure 1.)
How the punishment rate works
Assessing the relationship between crime and punishment is inherently challenging. Many crimes go unreported and, as a result, unpunished. Reported crimes often do not result in arrest or prosecution, and those that do frequently do not lead to conviction and imprisonment. As a measure of punitiveness, the imprisonment rate captures only the small subset of offenders who are apprehended, prosecuted, convicted, and sentenced to prison—and it reflects only the ratio of those inmates to residents, rather than to overall crime. The punishment rate, by contrast, calculates the use of prison relative to the frequency and severity of reported crime in each jurisdiction by combining two data points:
- The imprisonment rate is the count of inmates sentenced to a year or more behind bars per 100,000 residents of a jurisdiction, as reported by the federal Bureau of Justice Statistics. This is the traditional threshold for a felony offense. It excludes those who are awaiting trial and those who committed lower-level offenses for which crime data are limited. (Misdemeanor charges, by contrast, typically result in sentences of probation or less than a year in local jails.)
- The severity-weighted crime rate captures the frequency and seriousness of reported crime per 100,000 residents, as measured by the seven specific offenses for which reliable, national data are available and that the FBI classifies as Part I offenses: criminal homicide, rape, robbery, aggravated assault, burglary, larcenytheft, and motor vehicle theft. To account for differences in the severity of the offenses, Pew constructed a scale that assigns a weight to each crime according to the average period of imprisonment served by offenders convicted and sentenced for it. For example, because robbery offenders serve longer prison terms than larceny offenders, the former is weighted more heavily than the latter.
Although the imprisonment rate counts drug offenders—who make up nearly a fifth of the state prison population—drug crimes are not counted among the FBI’s Part I offenses, so the severity-weighted crime rate does not include them.
The punishment rate is not intended to replace the imprisonment rate as an analytical tool, nor should it be viewed as an assessment of specific corrections policies or practices. Instead, it provides a new lens through which policymakers, researchers, and the public can view the use of prison relative to reported crime—and the ways in which that relationship has changed over time.
A more punitive nation
As measured by the punishment rate, the U.S. became 165 percent more punitive from 1983 to 2013. Changes in the two components of the punishment rate—the imprisonment rate and the severity-weighted crime rate— explain this trend:
- The imprisonment rate soared over the 30-year period as lawmakers increased criminal penalties, eliminated parole, and made other policy changes that collectively sent more offenders to prison and kept them there longer.1 The effects of these changes can be seen in the average amount of time that Part I offenders served, which was much higher among those released in 2013 than those released in 1983.2 Other practices also played a significant role in the nation’s prison buildup: Research suggests, for instance, that during this span prosecutors increasingly pursued felony charges, which led to more offenders being sentenced to at least a year in prison.3
- Changes in the severity-weighted crime rate also played a critical role in the nation’s rising punishment rate. Violent and property crime rates rose sharply from 1983 to 1991, prompting many of the policy changes referenced above, including the establishment of mandatory minimum sentences and laws requiring offenders to spend most of their court-imposed sentences behind bars.4 But crime rates have dropped by more than half since 1991, reaching levels not seen since the 1960s, even as the imprisonment rate has remained far above historical levels.5 In other words, the United States has responded to declining crime with the same high level of imprisonment, leading to a significant increase in the punishment rate, particularly in recent years.
Comparing states
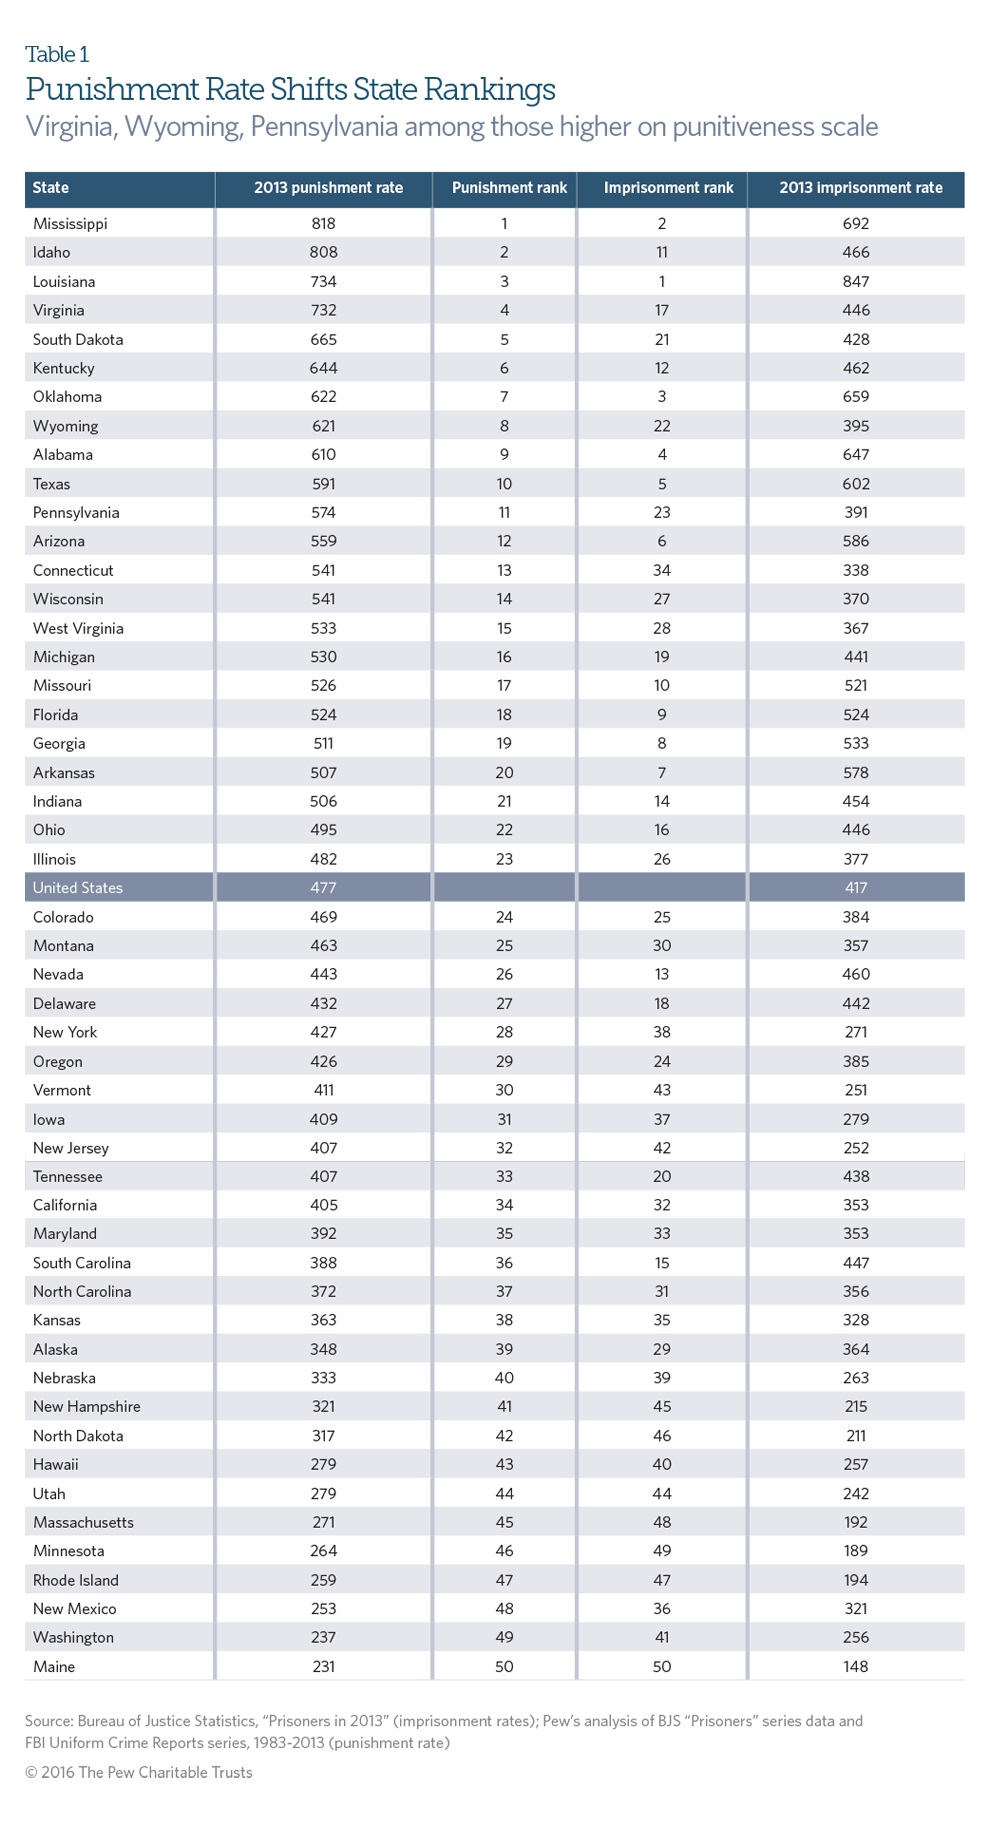
To assess relative punitiveness across jurisdictional lines, Pew calculated punishment rates for all 50 states using data from 2013, the most recent year available. Mississippi’s rate of 818, the highest in the nation, was 71 percent greater than the U.S. average of 477, while Maine’s rate of 231, the country’s lowest, was less than half of the U.S. average. (See Table 1.)
Many states had similar rankings in their imprisonment and punishment rates. Michigan, for instance, ranked 19th among the states in its imprisonment rate and 16th in its punishment rate in 2013. Nebraska was 39th in imprisonment and 40th in punishment.
However, many other states differed by several positions in the rankings, and 17 states varied by 10 or more slots. Connecticut, New Jersey, New York, Pennsylvania, South Dakota, Vermont, Virginia, West Virginia, Wisconsin and Wyoming each ranked much higher in their punishment rates than in their imprisonment rates. In other words, these states punished crime significantly more than their imprisonment rates show. The opposite was true for Alaska, Arkansas, Georgia, South Carolina, Tennessee, Nevada, and New Mexico.
The Complex Interplay of Crime and Imprisonment
Criminologists attribute some of the U.S. crime decrease since 1991 to the nation’s sharp rise in imprisonment. But they attribute most of the reduction to other factors, including better policing, the aging of the population, and advances in crime prevention technology.* Many experts also argue that the increase in imprisonment has reached a point of diminishing or even negative public safety returns. The National Research Council, for example, concluded in a comprehensive 2014 report that “statutes mandating lengthy prison sentences cannot be justified on the basis of their effectiveness in preventing crime.”
At the same time, research shows that policy choices— not crime rates—drive increased imprisonment. States that imprison a large share of their residents, for example, can have a high crime rate or a low one; the same is true for states that lock up a small proportion of their populations.
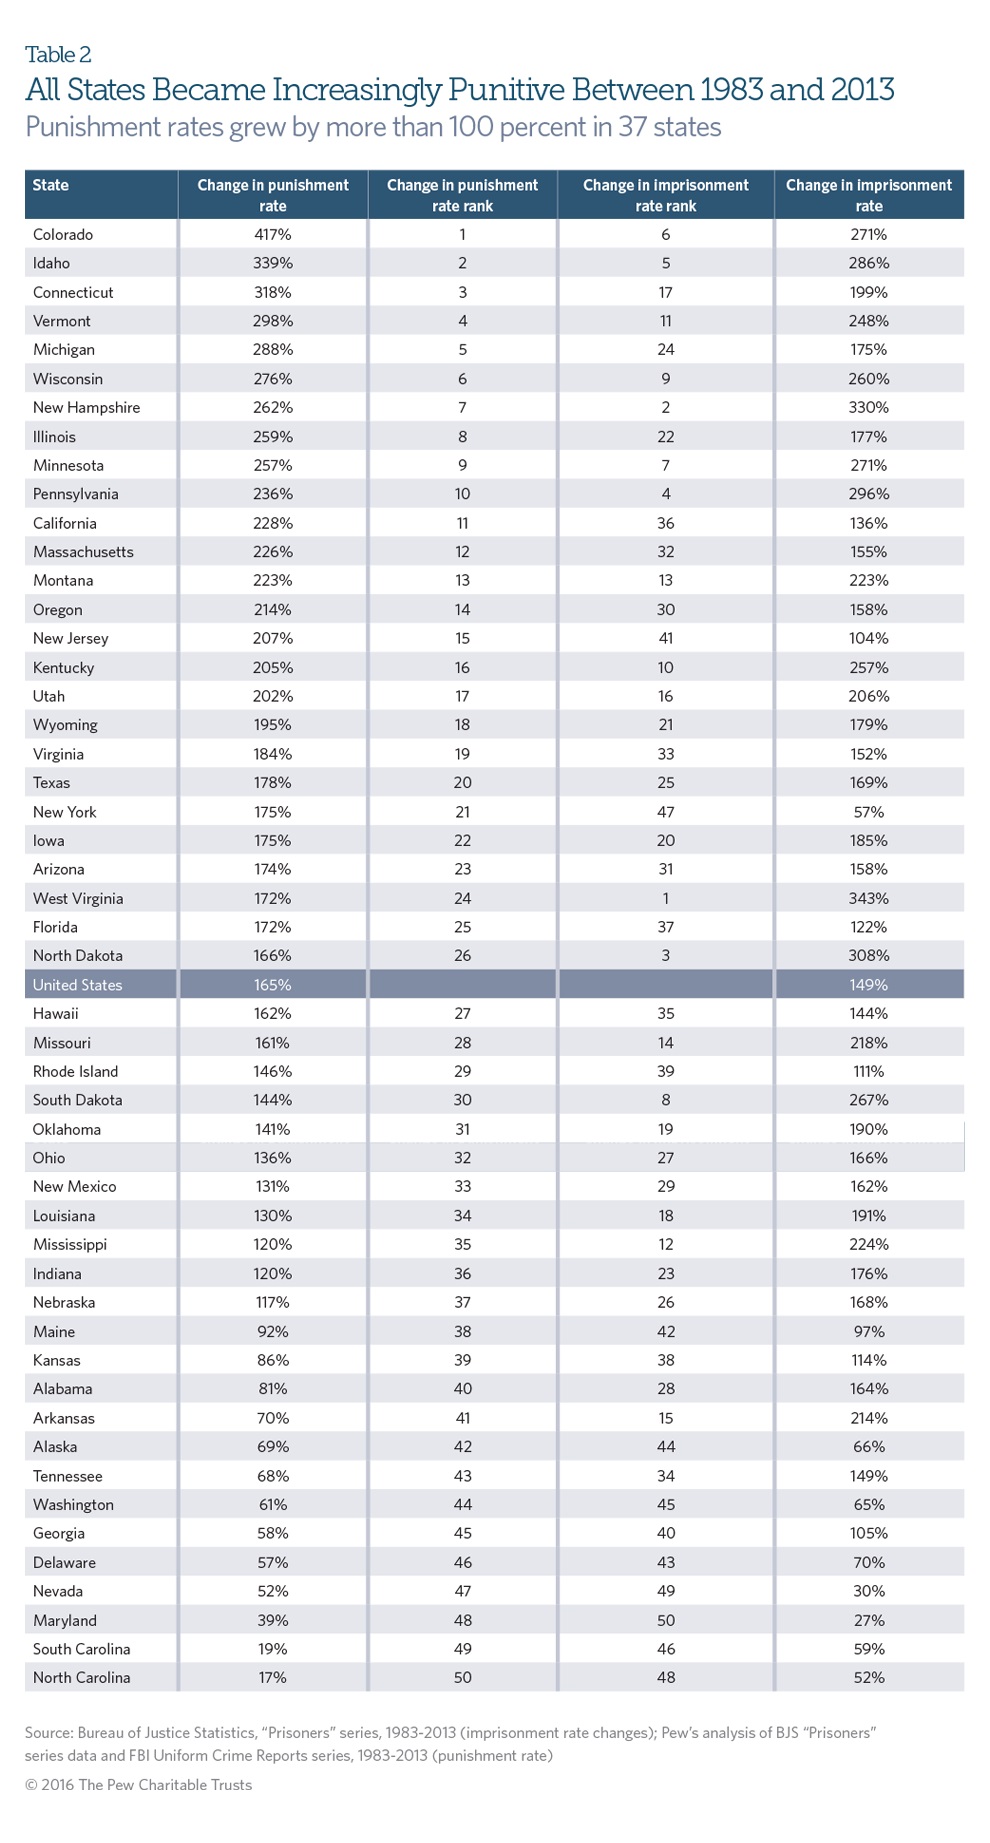
To assess how state punishment rates have changed over time, Pew calculated trends for all 50 states from 1983 to 2013. The rates grew in all states during this period, with Colorado’s 417 percent spike by far the largest; North Carolina’s rate rose the least, at 17 percent. (See Table 2.)
The analysis again shows that some states became far more or less punitive than their imprisonment rates suggest—changes that could be the result of decreasing crime, increasing penalties, or a combination of the two. The punishment rates for New York and New Jersey, for example, dramatically increased, but those states’ imprisonment rates grew much more slowly. Conversely, in Alabama, Arkansas, and Tennessee, imprisonment rates rose much more than did punishment rates.
Connecticut, South Dakota, Wyoming, and other states punished crime significantly more than their imprisonment rates show.
Conclusion
The long-term rise in U.S. imprisonment is a familiar story. Although the imprisonment rate is an essential tool in understanding correctional trends, it paints an incomplete picture of the nation’s and individual states’ punitiveness because it does not take crime rates into account. The punishment rate provides a more nuanced assessment by placing each jurisdiction’s imprisonment rate in the context of the severity and frequency of its crime.
Analysis of punishment rates over time and across jurisdictions makes clear that the nation has become more punitive. What’s more, many states punish crime significantly more—or less—than their imprisonment rates alone indicate. States with particularly high or low punishment rates and those that experienced significant increases in their punishment rates over time may benefit from identifying and examining the policy choices responsible for their rankings and trends.
Methodology
Pew calculated punishment rates for the 50 states and the nation as a whole with imprisonment rate data from the annual “Prisoners” series published by the Bureau of Justice Statistics (BJS) and crime rate statistics from the annual “Uniform Crime Report” series published by the FBI. Both rates are per 100,000 residents. To develop a scale with which to determine the relative severity of each Part I crime, Pew analyzed time-served data, by offense, from BJS’ National Corrections Reporting Program. All data are from 1983 to 2013.
The punishment rate counts only the state prison population—not the total incarcerated population, which includes jail inmates—because the seven crimes tracked in this analysis are more likely to result in prison sentences than jail terms. In addition, it counts only inmates who were sentenced to more than a year in prison— the traditional threshold used to define a felony offense—to ensure greater data consistency across all states, including those with combined prison and jail systems. Further, the punishment rate captures only the FBI’s seven Part I offenses, because they are most likely to be reported to police and, as a result, to be tracked consistently in all states. Although Part I offenses omit many crimes that can lead to a term of imprisonment—most notably, drug-related offenses—they represent the best available measure of crime on an annual state-by-state basis. All jurisdictional notes listed in BJS’ “Prisoners” series and in the FBI’s “Uniform Crime Report” series apply to this analysis.
Pew used data from the National Corrections Reporting Program (NCRP) annual release files from 1983 to 1999 and the term record files from 2000 to 2013 to estimate average time served for each Part I crime and each year. Pew’s estimate of average time served is for offenders considered “first releases”—that is, those who met the following conditions: Their prison sentence was for one year or more; they were sent to prison for a new crime rather than a supervision violation, categorized in the NCRP data file as a “new court commitment” or “imposed suspended sentence”; and their release from prison was not due to death, transfer, appeal, or detainer.6 Pew used average time served by released offenders rather than expected time served by those in prison to account for variations in state sentencing and release policies that can cause data irregularities.7 Average-time-served data are also more conservative than estimates of expected time served because they are based on offenders released from prison and, as a result, over-represent those with short sentences.
All cases in the data files used for this analysis were divided into seven offense categories: criminal homicide, rape, robbery, aggravated assault, burglary, larceny-theft, and motor vehicle theft, based on the NCRP code books for the years being evaluated. (A list of offense codes from the 2013 book is available upon request.) Inmates were placed in an offense category based on the crime for which they received the longest sentence.
Pew calculated total average time served by adding any jail time that was credited toward the current sentence to the prison time served for that sentence. If prior jail time was missing from the data, Pew estimated it as the average jail time for that year and offense category.
The NCRP is a voluntary federal data collection program; not all states participate. For the years represented in this data analysis, 25 to 35 states provided viable time served information. Pew used a centered moving average—one year before, the current year, and one year after—to account for fluctuations in states’ yearover- year reporting practices. Pew calculated average time served for 1983 and 2013 using a two-year moving average (1983 and 1984, and 2012 and 2013, respectively) because data were not available for 1982 or 2014.
The formula used to calculate the punishment rate is:
Imprisonment Rate y / (Murder Rate y * Murder Wt y) + (Rape Rate y * Rape Wt y) + (Robbery Rate y * Robbery Wt y) + (Assault Rate y * Assault Wt y) + (Burglary Rate y * Burglary Wt y) + (Larceny Rate y * Larceny Wt y) + (Motor Vehicle Theft Rate y * Motor Vehicle Theft Wt y)
The subscript y in the formula is an indicator for “year” in that the imprisonment and crime rates as well as weights change each year. The seven weighted crime rates are added together in the denominator of the formula. As noted above, the formula weights each offense by its relative severity, based on the average time served by inmates sentenced to prison for each of the seven Part I offenses.
This weighting mechanism is important because it ensures that the punishment rate does not treat all offenses equally, given important differences in the severity of each crime. Without the weighting mechanism, a ratio of imprisonment to crime would essentially treat each crime’s potential impact on imprisonment as the same—even though some offenders serve much longer terms than others.
External reviewers
This study benefited from the insights and expertise of Kristofer “Bret” Bucklen, Ph.D., director of the Bureau of Planning, Research, and Statistics at the Pennsylvania Department of Corrections; James P. Lynch, Ph.D., professor and chair of the Department of Criminology and Criminal Justice at the University of Maryland, College Park; and Jeremy Travis, Ph.D., president of the John Jay College of Criminal Justice. Pew also recognizes Mark A.R. Kleiman, Ph.D., professor of public policy at the Marron Institute of Urban Management at New York University, who provided consultation and whose 2009 book, When Brute Force Fails: How to Have Less Crime and Less Punishment, provided the inspiration for the punishment rate. Although they have reviewed the analysis and methodology, neither they nor their organizations necessarily endorse the findings or conclusions.
Endnotes
- National Research Council, The Growth of Incarceration in the United States: Exploring Causes and Consequences (2014), http://www.nap.edu/catalog/18613/the-growth-of-incarceration-in-the-united-states-exploring-causes.
- Pew analysis of data from the U.S. Bureau of Justice Statistics’ National Corrections Reporting Program, 1983-2013.
- John F. Pfaff, The Causes of Growth in Prison Admissions and Populations (July 2011), http://papers.ssrn.com/sol3/papers.cfm?abstract_ id=1884674.
- For changes in violent and property crime rates from 1983 to 1991, see FBI Uniform Crime Reporting Program, http://www.ucrdatatool.gov/. For policy changes made in response to rising crime, see National Research Council, The Growth of Incarceration in the United States.
- Ibid. For historical levels of imprisonment, see Bureau of Justice Statistics, Key Statistics, Estimated Number of Persons Under Correctional Supervision in the United States, http://www.bjs.gov/index.cfm?ty=kfdetail&iid=488.
- Prison inmates held on detainer are awaiting transfer to another agency or jurisdiction (e.g., federal custody).
- Expected time served is an alternative way to estimate time served by calculating the length of stay for those in prison during a particular year. For a more detailed explanation of this approach, see The Pew Charitable Trusts, Time Served: The High Cost, Low Return of Longer Prison Terms (June 2012), 21–22, http://www.pewtrusts.org/en/research-and-analysis/reports/2012/06/06/ time-served-the-high-costlow- return-of-longer-prison-terms.
ADDITIONAL RESOURCES
Article


