- * The compound annual growth rate shows the smoothed year-over-year growth in spending over a period of time. (Source: Investopedia, "Compound Annual Growth Rate—CAGR," accessed April 7, 2014, http://www.investopedia.com/terms/c/cagr.asp.)
- 13 Laura Snyder et al., Why Does Medicaid Spending Vary across States: A Chart Book of Factors Driving State Spending (Washington: Kaiser Family Foundation, 2012), accessed Feb. 19, 2014, http://kaiserfamilyfoundation.files.wordpress.com/2013/01/8378.pdf.
- 14 Janice K. Brewer, "Difficult Choice: Restoring Adult Medicaid Coverage" news release (Jan. 14, 2013), accessed Jan. 28, 2014, http:// azgovernor.gov/dms/upload/PR_011413_MedicaidBudgetMessage.pdf.
For state-by-state data please see the tables below.
Trends in Medicaid spending
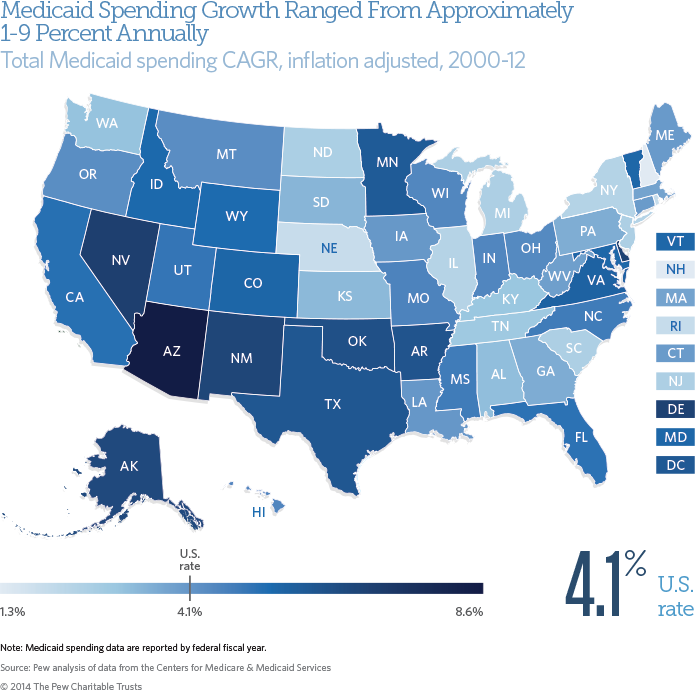
Between 2000 and 2012, total Medicaid spending—by states and the federal government—increased at a 4.1 percent compound annual growth rate, or CAGR, after adjusting for inflation.* In 2012 dollars, spending increased from $263 billion to $429 billion nationwide. Growth varied by state due to a range of factors, including state-specific policy decisions about Medicaid benefits and eligibility rules, the health status and income of residents, and the strength of the state's economy.13 Arizona, for example—which experienced an 8.6 percent CAGR in total Medicaid spending from 2000 to 2012—began offering full Medicaid benefits to childless adults whose incomes were below the federal poverty level, or FPL, in 2001.14 This change in eligibility set the stage for high enrollment growth of 20 to 30 percent per year and high spending growth in the few years following this change.
Total Medicaid spending and growth, inflation adjusted
2000–12
For state-by-state data please see the tables below.
Trends in Medicaid spending
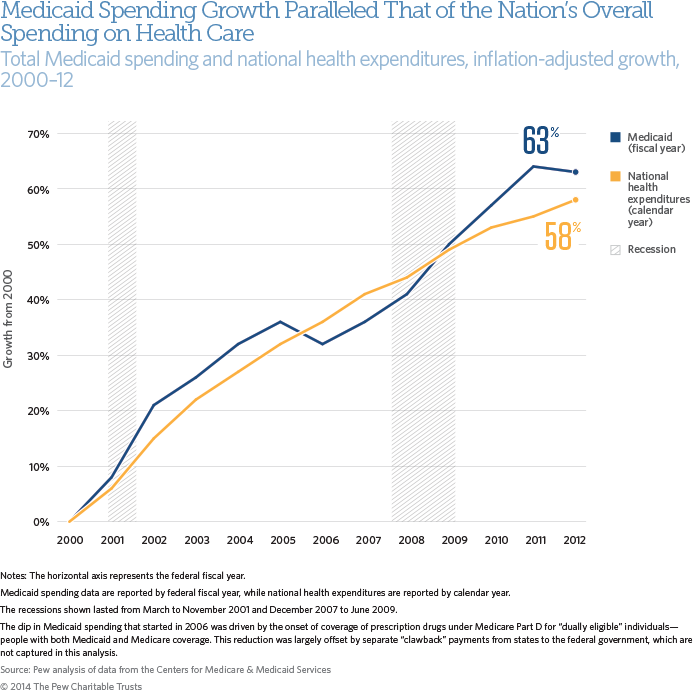
Looking at the cumulative growth, total Medicaid spending grew 63 percent after adjusting for inflation, from $263 billion to $429 billion.* This rate paralleled the 58 percent increase in overall national health care expenditures, which include public and private spending, during this time. Increased spending in Medicaid was largely driven by increases in enrollment stemming from economic downturns.15
Medicaid spending is also subject to factors that affect all of the nation's health care spending, such as medical- price inflation, the introduction of new medications and technologies, the increasing prevalence of chronic disease, and the related increased use of medical services.16
- * Medicaid spending in 2000 is expressed in 2012 dollars.
- 15 Katherine Young et al.,Enrollment-Driven Expenditure Growth: Medicaid Spending During the Economic Downturn, Fy 2007-2011 (Washington: Kaiser Family Foundation, 2013), accessed Jan. 14, 2014, http://kaiserfamilyfoundation.files.wordpress.com/2013/05/8309-02.pdf.
- 16 Bipartisan Policy Center,What Is Driving U.S. Health Care Spending? America's Unsustainable Health Care Cost Growth (Washington: Bipartisan Policy Center, 2012), accessed Jan. 16, 2014, http://bipartisanpolicy.org/sites/default/files/BPC%20Health%20Care%20 Cost%20Drivers%20Brief%20Sept%202012.pdf.