- 4 U.S. Census Bureau, "Health Insurance Coverage Status and Type of Coverage by State, All Persons: 1999 to 2012, " Current Population Survey, Annual Social and Economic Supplements, Health Insurance Historical Tables, table HIB-4, accessed Jan. 9, 2013, http://www.census.gov/hhes/www/hlthins/data/historical/HIB_tables.html.
- 5 Kaiser Commission on Medicaid and the Uninsured, The Uninsured: A Primer—Key Facts About Health Insurance on the Eve of Health Reform (Washington: Kaiser Family Foundation, 2013), accessed Feb. 24, 2014, http://kff.org/uninsured/report/the-uninsured-a-primer-key-facts-about-health-insurance-on-the-eve-of-coverage-expansions/.
- 6 Institute of Medicine, America's Uninsured Crisis: Consequences for Health and Health Care (Washington: The National Academies Press, 2009), 3, accessed Dec. 12, 2013, http://www.iom.edu/~/media/Files/Report%20Files/2009/Americas-Uninsured-Crisis-Consequences-for-Health-and-Health-Care/Americas%20Uninsured%20Crisis%202009%20Report%20Brief.pdf.
Providing context for state health care spending
State spending for health care services varies widely by state. But the relationship between the services delivered and residents' health status—how "healthy" people are—is complex. The amount a state spends on such services is not necessarily correlated with better or worse health status. A resident's well-being is only partially influenced by the health care services received; behavioral patterns, genetics, social circumstances, and environmental exposures also play a large role.
States need to invest wisely in health care as well as in the other related factors that contribute to health. High-value health care is as much about how dollars are spent as it is about how many dollars are spent.
For state-by-state data please see the tables below.
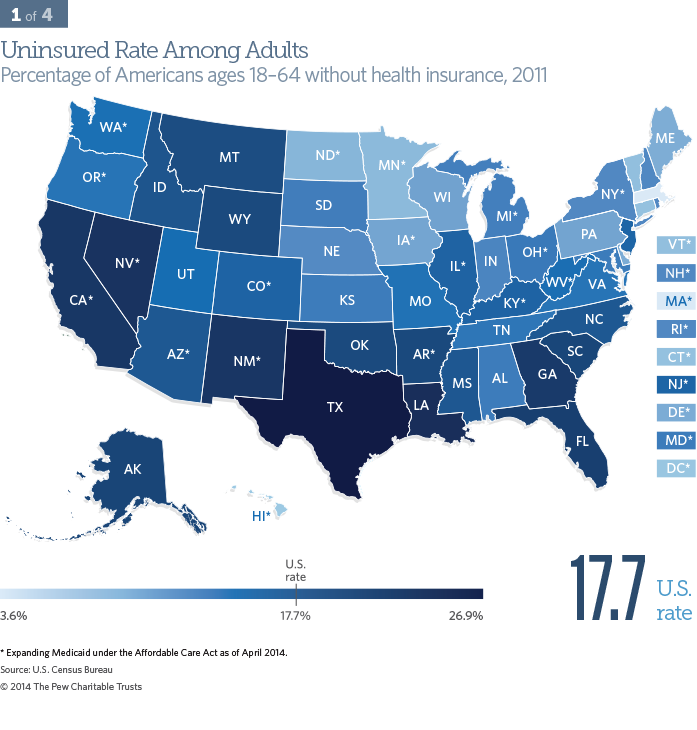
Uninsured rate among adults
Health insurance coverage is an important measure of access to care, which plays a significant role in overall health.
In 2011, over 41.6 million adults were uninsured. Rates of uninsured adults varied greatly across the nation. Massachusetts had the lowest rate (3.6 percent), and Texas had the highest rate (26.9 percent). Texas and California had the largest number of uninsured adults, accounting for a combined 27 percent of the total nationally.4
Uninsured rates are highest among blacks and Hispanics, and disproportionately include adults between ages 19 and 34.5 A high correlation exists between states’ rates for uninsured adults and children. States that have low rates of uninsured adults also tend to have high rates of employer-sponsored coverage.
The consequences to an adult of not having insurance can be significant. Uninsured adults are more likely to die or have extremely poor health outcomes than insured adults for many acute conditions, including heart attacks, strokes, and trauma. They also are likely to have less-timely diagnoses and treatments for chronic conditions such as cancer, diabetes, and hypertension.6
State policymakers can directly affect their uninsured rates by expanding the eligibility of their Medicaid programs.
Demographics and the uninsured
For state-by-state data please see the tables below.
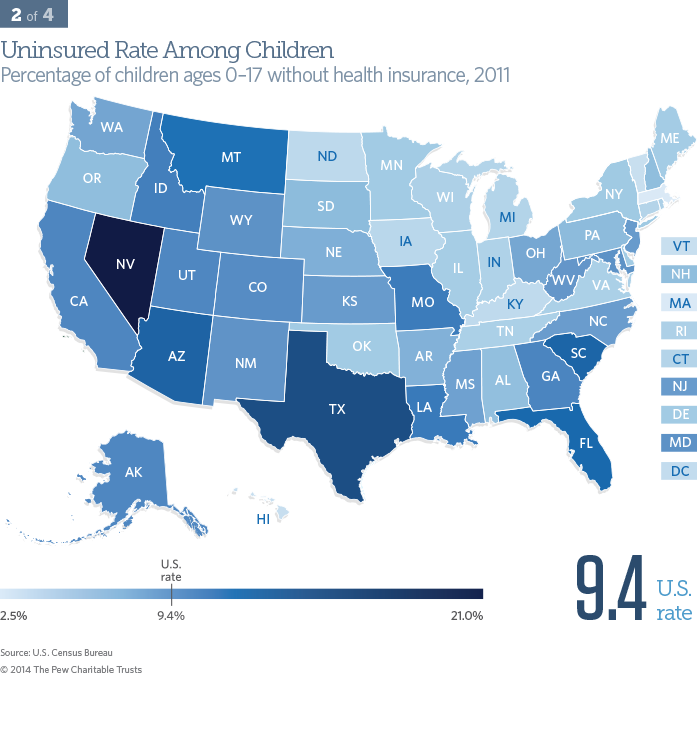
Uninsured rate among children
Health insurance coverage is an important measure of potential access to health care, which plays a significant role in overall health.
Almost 7 million children were uninsured in 2011.7 Rates varied dramatically among states. Massachusetts had the lowest rate (2.5 percent) and Nevada the highest (21.0 percent). Nationally, Texas and California account for nearly 30 percent of children without health insurance.8 Uninsured rates among children tend to be highest among Hispanics, American Indians, and those over the age of 6.9 Kids with health insurance are more likely to receive well-child care, immunizations, and dental care; have fewer avoidable hospitalizations; have better asthma outcomes; and less truancy.10 A high correlation exists between states’ rates for uninsured adults and children.
One way for state policymakers to directly affect their uninsured rate is to expand the eligibility of their Medicaid program and Children’s Health Insurance Program to above the federal eligibility minimums.
- 7 U.S. Census Bureau, "Health Insurance Coverage Status and Type of Coverage by State—Children Under 18: 1999 to 2012," Current Population Survey, Annual Social and Economic Supplements, Health Insurance Historical Tables, table HIB-5, accessed Jan. 9, 2013, http://www.census.gov/hhes/www/hlthins/data/historical/HIB_tables.html.
- 8 Ibid.
- 9 Joan Alker, Tara Mancini, and Martha Heberlein, "Uninsured Children 2009-2011: Charting the Nation’s Progress," Georgetown University Health Policy Institute, Center for Children and Families (2012), 3, accessed Oct. 9, 2013, http://ccf.georgetown.edu/wp-content/uploads/2012/10/Uninsured-Children-2009-2011.pdf.
- 10 Institute of Medicine, America's Uninsured Crisis: Consequences for Health and Health Care.
Demographics and the uninsured
For state-by-state data please see the tables below.
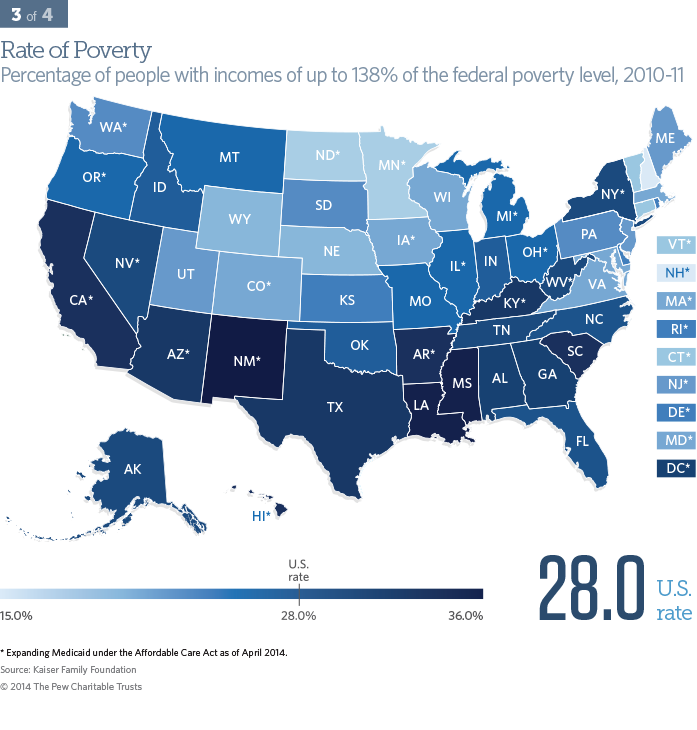
Poverty rate
Living in poverty can significantly influence health by limiting access to safe housing, food and water, and health care services.
Nationally, more than 86 million people live in the range of up to 138 percent of the federal poverty level, the eligibility guidelines for Medicaid established by the Affordable Care Act.*,11 New Hampshire had the lowest poverty rate (15 percent) and New Mexico the highest (36 percent). Poverty rates are highest among blacks and Hispanics.12
- * As of Jan. 1, 2014, the eligibility level for Medicaid was 138 percent of the federal poverty level, or $22,350 for a family of four in 2011, in states that expanded Medicaid.
- 11 Kaiser Family Foundation's State Health Facts, "Distribution of Total Population by Federal Poverty Level," Data source: Census Bureau's March 2012 and 2013 Current Population Survey, accessed Nov. 8, 2013, http://kff.org/other/state-indicator/distribution-by-fpl/.
- 12 National Center for Health Statistics, Health, United States, 2012: With Special Feature on Emergency Care (Hyattsville, MD: 2013), Table 2, accessed Jan. 13, 2014, http://www.cdc.gov/nchs/data/hus/hus12.pdf.
Demographics and the uninsured
For state-by-state data please see the tables below.
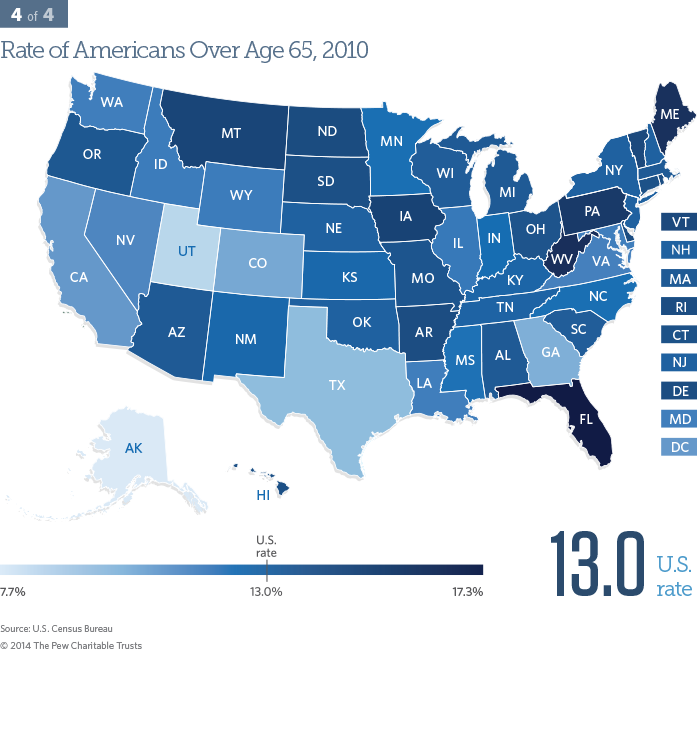
Population over age 65
People 65 years or older tend to use more health care services, compared with younger people.
Older Americans are a quickly growing segment of state populations, with more than 40 million people nationally over the age of 65 in 2010.13 Alaska had the lowest rate of elderly people (7.7 percent) and Florida the highest (17.3 percent). The health care needs of older Americans are generally more complex than the rest of the population because they tend to live with at least one chronic disease.
- 13 U.S. Census Bureau, "Age and Sex Composition in the United States: 2010 Census Brief" (issued May 2011), 2, accessed Jan. 9, 2013, http://www.census.gov/prod/cen2010/briefs/c2010br-03.pdf.
Demographics and the uninsured
For state-by-state data please see the tables below.
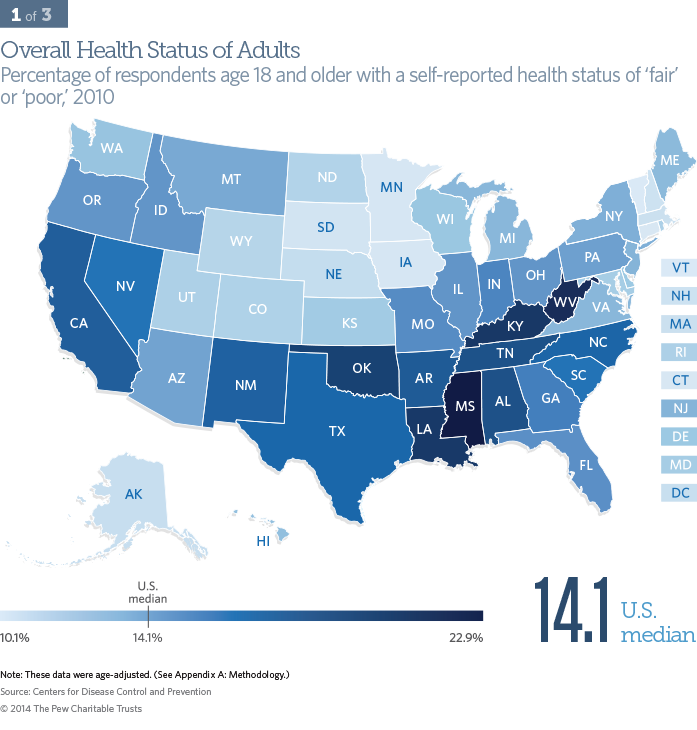
Overall health status
How people describe their health status, or how well they feel, is a highly validated indicator of their overall health.14
In 2010, 14.1 percent of Americans reported being in fair or poor health, ranging from 10.1 percent in Vermont to 22.9 percent in Mississippi. In general, people who described themselves as being in fair or poor health are more likely to be black, American Indian/Alaska Native, or Hispanic, and below 200 percent of the federal poverty level.15
State policymakers can influence their residents' self-assessed health status through interventions including oversight of the quality of their Medicaid and state employee health programs, support of public health initiatives, and a variety of other nonhealth strategies.
- 14 Karen B. DeSalvo et al., "Mortality Prediction With a Single General Self-Rated Health Question," Journal of General Internal Medicine 21, no. 3 (2006), accessed Jan. 13, 2014, http://dx.doi.org/10.1111/j.1525-1497.2005.00291.x.
- 15 National Center for Health Statistics, Health, United States, 2012: With Special Feature on Emergency Care, Table 2, accessed Jan. 13, 2014.
Health status of residents
For state-by-state data please see the tables below.
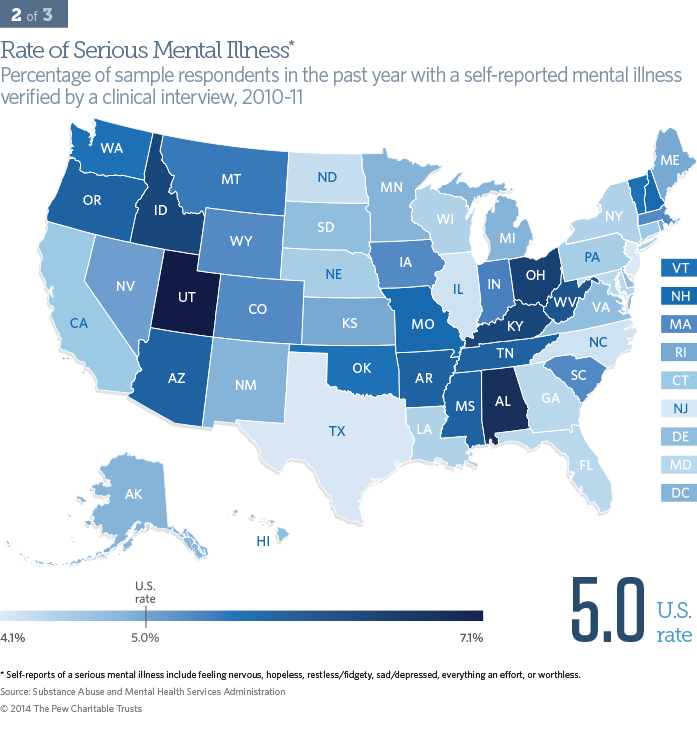
Serious mental illness
Mental health is an important component of overall health. The seriously mentally ill die on average 25 years earlier than the rest of the population, and they often have physical health problems such as cardiovascular disease and diabetes.16
Sample respondents age 18 and older were asked if they had a serious mental illness in the past year, which was verified by a clinical interview. Nationally, 5 percent of adults live with a serious mental illness. States did not vary widely in their percentage of populations with serious mental illness: New Jersey reported the lowest rate at 4.1 percent and Utah the highest at 7.1 percent.
Women and people whose income is below 100 percent of the federal poverty level have the highest rate of serious mental illness. Other populations with relatively high rates of serious mental illness include American Indians/Alaska Natives, unemployed persons, people convicted of a crime, and enrollees in Medicaid and the Children's Health Insurance Program.17
State policymakers can influence mental health rates by supporting mental health services and state-funded treatment and screening programs and by encouraging the availability of an adequate number of professionals to deliver treatment.
- 16 National Association of State Mental Health Program Directors, Measurement of Health Status for People With Serious Mental Illnesses (Alexandria, VA: 2008), 2, accessed Jan. 9, 2014, http://www.nasmhpd.org/docs/publications/MDCdocs/NASMHPD%20Medical%20 Directors%20Health%20Indicators%20Report%2011-19-08.pdf.
- 17 Substance Abuse and Mental Health Services Administration, Results From the 2011 National Survey on Drug Use and Health: Mental Health Findings (Rockville, MD: 2012), Figure 2.2, accessed Jan. 13, 2014, http://www.samhsa.gov/data/NSDUH/2k11MH_ FindingsandDetTables/2K11MHFR/NSDUHmhfr2011.htm#2.2; Marc A. Safran et al., "Mental Health Disparities," American Journal of Public Health 99, no. 11 (2009), accessed Jan. 13, 2014, http://dx.doi.org/10.2105/AJPH.2009.167346.
Health status of residents
For state-by-state data please see the tables below.
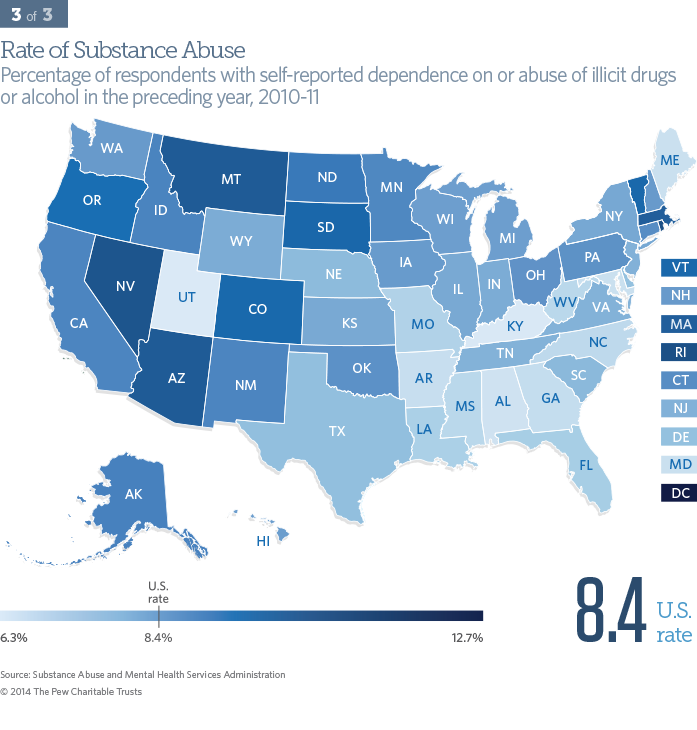
Substance abuse
Substance abuse can have significant consequences on overall health.
In 2010 and 2011, an average of 22.2 million, or 8.4 percent, of Americans ages 12 and older depended on or abused illicit drugs* or alcohol. Utah had the lowest rate of substance abuse at 6.3 percent, and the District of Columbia had the highest at 12.7 percent. People ages 18 to 25 had the highest rate of substance dependence or abuse of any age group. Substance abusers also tended to be male and white. Those in the "American Indian" or "Alaska Native and Native Hawaiian or Other Pacific Islander" categories had higher rates of substance abuse than other racial and ethnic groups.18
State policymakers can influence substance abuse rates by supporting prevention and treatment programs, ensuring accessibility to treatment, and by implementing effective law enforcement.
- * "Illicit drugs include marijuana/hashish, cocaine (including crack), heroin, hallucinogens, inhalants, or prescription-type psychotherapeutics... used nonmedically." (Source: Substance Abuse and Mental Health Services Administration, Results From the 2011 National Survey on Drug Use and Health: Mental Health Findings(Rockville, MD: 2012), accessed Jan. 13, 2014.)
- 18 Substance Abuse and Mental Health Services Administration, Results From the 2011 National Survey on Drug Use and Health: Mental Health Findings.
Health status of residents
For state-by-state data please see the tables below.
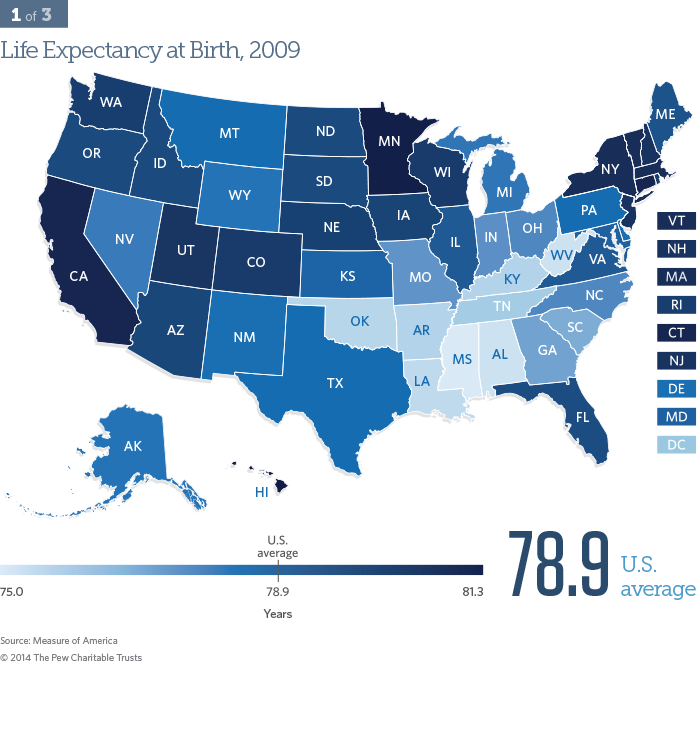
Life expectancy at birth
Life expectancy at birth is an all-encompassing measure of the health of a population. Americans live an average of 78.9 years.
Life expectancy at birth ranged from 75.0 years in Mississippi to 81.3 years in Hawaii. Women lived 4.9 more years than men, and whites lived 4.1 more years than blacks.19 Improved treatment and reduced incidence of heart disease, cancers, diabetes, and unintentional injury all contribute to how long people live. Behavioral and lifestyle choices also greatly influence life expectancy.
Many factors not specifically related to health also contribute to life expectancy, such as race and ethnicity, education, environment, personal safety, and social supports. Life expectancy at birth is an indicator over which government at any level does not have a significant immediate impact. Although policies can help extend the average person’s life, changes would be seen over decades instead of years.
- 19 National Center for Health Statistics, Health, United States, 2012: With Special Feature on Emergency Care, Table 18, accessed Jan. 13, 2014.
Vital Statistics
For state-by-state data please see the tables below.
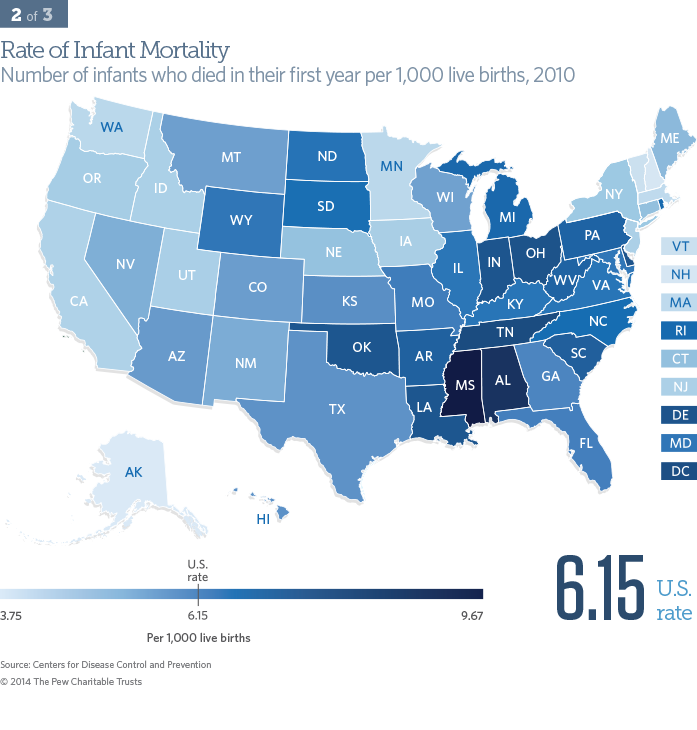
Infant mortality
The death rate of infants before their first birthday is an accepted measure of a population's health and well-being.
Approximately 25,000 infants under the age of 1 died in the United States in 2010. Alaska had the lowest infant mortality rate at 3.75 deaths per 1,000 live births, and Mississippi had the highest at 9.67. Blacks had a higher rate of infant deaths than whites.20
Infant mortality is influenced by the age of the mother and family income, among other factors. The leading causes of infant death include birth defects, preterm birth, sudden infant death syndrome, maternal complications from pregnancy, and injuries.
Women's health is a large contributor to the vitality of infants through avoiding tobacco, alcohol, and illicit drugs; maintaining a healthy weight; being physically active; and obtaining prenatal care.21 State policymakers can influence infant mortality rates by promoting women's health programs and other family support systems, but many nonhealth factors, such as adequate housing, also play a role.
-
20 Sherry L. Murphy, Jiaquan Xu, and Kenneth D. Kochanek,
Deaths: Final Data for 2010, Detailed Tables , National Vital Statistics Reports 61, no. 4 (2012): 2, accessed Jan. 10, 2014, http://www.cdc.gov/nchs/data/nvsr/nvsr61/nvsr61_04.pdf. - 21 Centers for Disease Control and Prevention, "Reproductive Health: Infant Mortality," accessed Oct. 2, 2013, http://www.cdc.gov/reproductivehealth/maternalinfanthealth/infantmortality.htm
Vital Statistics
For state-by-state data please see the tables below.
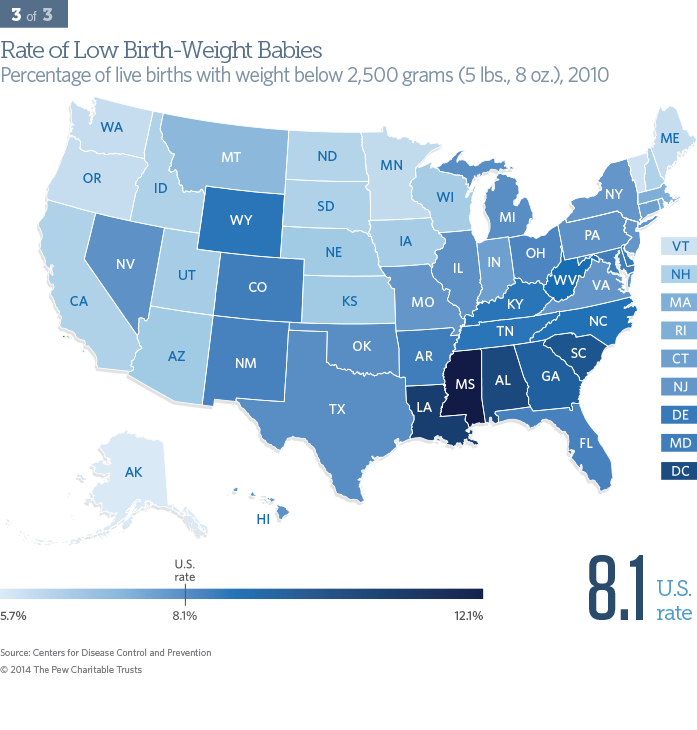
Low birth-weight babies
Birth weight is a strong indicator of infant survival and health. Low birth-weight babies weigh less than 2,500 grams (5 pounds, 8 ounces) at birth. They are more likely to die or be chronically ill or disabled than those born at a normal birth weight.
In 2010, over 325,000 American babies weighed less than 2,500 grams at birth. Low birth-weight babies were the least prevalent in Alaskan newborns at 5.7 percent, and most prevalent in Mississippi at 12.1 percent. These babies were disproportionately black.22
Other factors influencing the rates of low birth-weight babies included preterm birth and multiple births.23 Health care providers can help reduce the rate of these babies by encouraging patients to deliver at full term and to practice good maternal health. From a policy perspective, states can help improve infant health by supporting maternal health initiatives and encouraging pregnant women to obtain comprehensive prenatal care.
- 22 National Center for Health Statistics, Health, United States, 2012: With Special Feature on Emergency Care, Table 7.
- 23 Joyce A. Martin et al., Births: Final Data for 2010, National Vital Statistics Reports 61, no. 1 (2012): 12, accessed Jan. 16, 2014, http://www.cdc.gov/nchs/data/nvsr/nvsr61/nvsr61_01.pdf.
Vital Statistics
For state-by-state data please see the tables below.
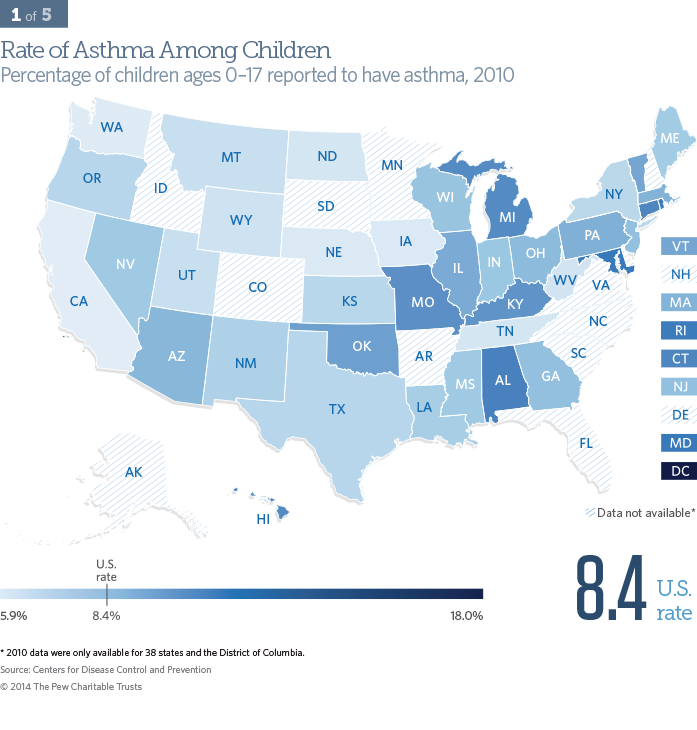
Asthma prevalence among children
Asthma is one of the leading chronic diseases in American children and is among the leading causes of hospitalization for kids under 15.24
Approximately 7 million children are estimated to live with asthma.25 Thirty-eight states and the District of Columbia reported childhood asthma rates in 2010, with California having the lowest at 5.9 percent and the nation's capital having the highest at 18.0 percent. Children living with asthma are more likely to be male, black, in low-income families, and between the ages of 5 and 17.26
Asthma is most often exacerbated by colds or allergens, and can be an important indicator of environmental health, such as exposure to high levels of mold. State policymakers can help promote effective asthma management tactics by ensuring that treatments and medications are covered under the state's Medicaid program and the Children's Health Insurance Program; requiring school personnel to be trained to treat acute episodes; and encouraging the reduction of household environmental triggers such as secondhand smoke.
- 24 American Lung Association, "Asthma & Children Fact Sheet," accessed Oct. 10, 2013, http://www.lung.org/lung-disease/asthma/resources/facts-and-figures/asthma-children-fact-sheet.html.
- 25 Ibid.
- 26 National Center for Health Statistics, Health, United States, 2012: With Special Feature on Emergency Care, Table 41, accessed Jan. 13, 2014.
Prevalence
For state-by-state data please see the tables below.
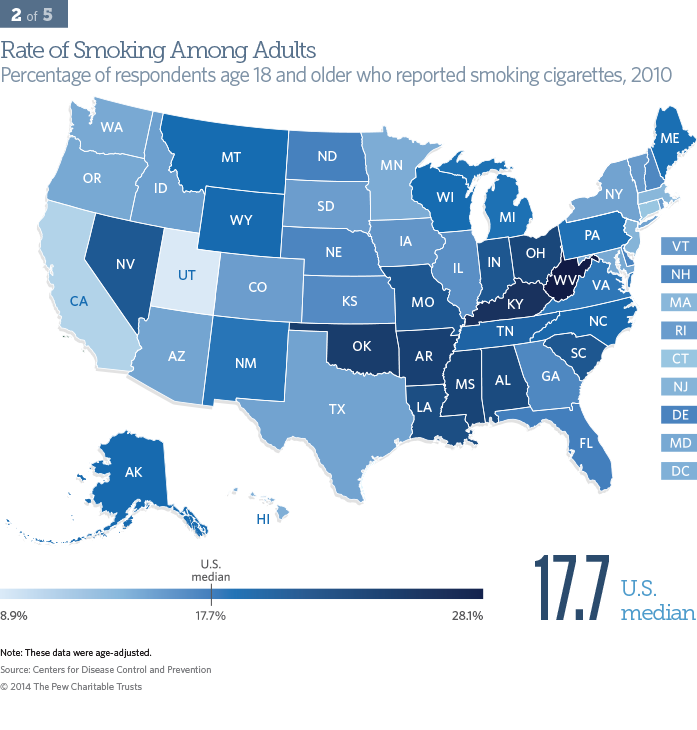
Smoking prevalence among adults
The most preventable cause of morbidity and mortality in the United States is tobacco use. Across the United States, 43.8 million people smoke cigarettes.27
For adults over the age of 18, Utah had the lowest rate of cigarette smokers at 8.9 percent, and West Virginia had the highest at 28.1 percent. Smoking rates are greatly influenced by culture and demographics. Among racial and ethnic groups, American Indians/Alaska Natives had the highest rate of smoking, followed by non-Hispanic whites. Adult smokers also tended to be men, live below the poverty level, and have less education than nonsmokers.28
From a policy perspective, states can influence smoking rates through adopting and implementing comprehensive tobacco-control programs. These include enacting smoke-free laws, raising taxes on tobacco products, and funding anti-smoking advertising campaigns.29
- 27 Centers for Disease Control and Prevention, "Current Cigarette Smoking Among Adults—United States, 2011," Morbidity and Mortality Weekly Report 61, no. 44 (2012), http://www.cdc.gov/mmwr/pdf/wk/mm6144.pdf.
- 28 National Center for Health Statistics, Health, United States, 2012: With Special Feature on Emergency Care, Table 56, accessed Jan. 13, 2014.
- 29 Centers for Disease Control and Prevention, "Smoking & Tobacco Use," accessed Oct. 10, 2013, http://www.cdc.gov/tobacco/data_statistics/state_data/state_highlights/2012/sections/index.htm.
Prevalence
For state-by-state data please see the tables below.
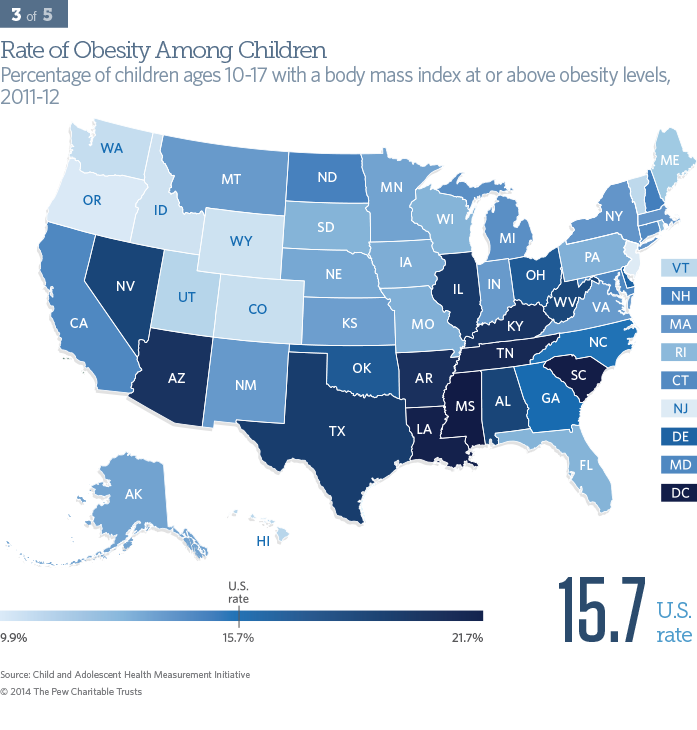
Obesity prevalence among children
Obesity is a risk factor for chronic diseases such as cardiovascular disease and diabetes. Children with obesity* are more likely than those of normal weight to be obese as adults.
Approximately 16 percent of children ages 10 to 17 in the nation were reported to be obese in 2011 to 2012. Oregon has the lowest proportion of obese children at 9.9 percent, and Mississippi has the highest at 21.7 percent. Boys were more likely to be obese than girls, and specific minority groups, including blacks and Mexican-Americans,† and low-income groups were at higher risk.30 Biological, behavioral, social, environmental, and economic factors—and how they affect one another—all contributed to obesity.31
Policymakers can influence childhood obesity rates through strategies that target kids, their families, schools and communities, and health professionals. Approaches to reducing childhood obesity are multifaceted and include tracking weight and height from birth, increasing physical activity while reducing sedentary behavior, making it easier and more affordable to eat healthful foods, and limiting the marketing of unhealthful foods to children.32 Nonhealth-specific policy areas—transportation and zoning, for example—also affect health and influence obesity rates.
- * Obesity in children is defined as having a body mass index at or above the 95th percentile. Reports of height and weight of children under 10 are not reliable and are not included.
- † The survey cited for racial and ethnic disparities provided estimates only for Mexican-Americans. The results are not representative of all U.S. Hispanics.
- 30 National Center for Health Statistics, Health, United States, 2012: With Special Feature on Emergency Care, Table 69, accessed Jan. 13, 2014.
- 31 Youfa Wang et al., Childhood Obesity Prevention Programs: Comparative Effectiveness Review and Meta-Analysis (Rockville, MD: Agency for Healthcare Research and Quality, 2013), ES-1, accessed Jan. 27, 2014, http://www.effectivehealthcare.ahrq.gov/reports/final.cfm.
- 32 Institute of Medicine, Early Childhood Obesity Prevention Policies (Washington: The National Academies Press, 2011), accessed Jan. 16, 2014, http://www.iom.edu/Reports/2011/Early-Childhood-Obesity-Prevention-Policies.aspx.
Prevalence
For state-by-state data please see the tables below.
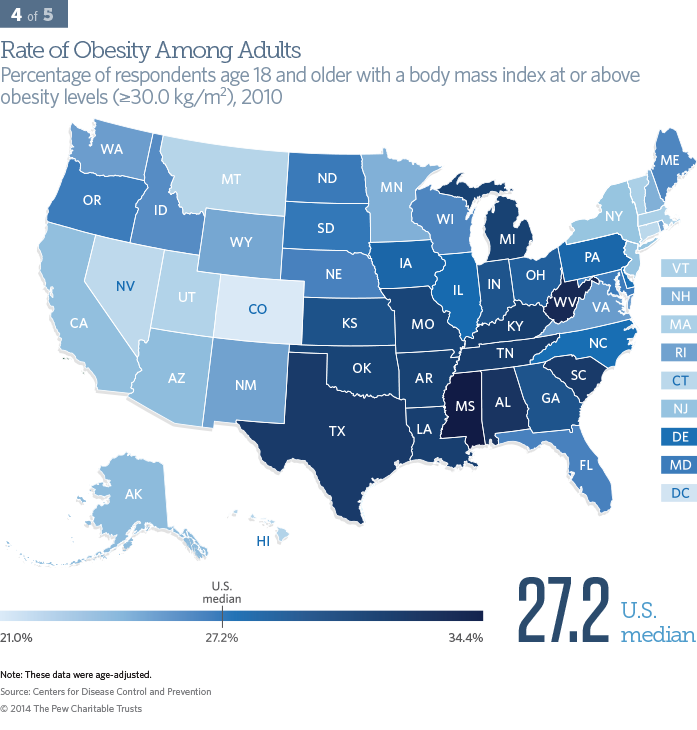
Obesity prevalence among adults
Obesity is a risk factor for chronic diseases, including cardiovascular disease and diabetes.
In 2010, more than 1 in 4 Americans age 18 and older were obese.* Colorado had the lowest proportion of obese adults at 21 percent and Mississippi the greatest at 34.4 percent. Obesity rates were highest among black and Mexican-American women.†,33
State policymakers can combat obesity through multifaceted approaches that include efforts to improve overall health, such as encouraging people to become more active by providing bike lanes, bike parking, and sidewalks, and by supplying more information to make healthy dietary choices. These strategies require states to collaborate with a diverse set of private partners and local communities, and to measure and evaluate progress.
- * Obesity in adults age 18 and older is defined as having a body mass index greater than or equal to 30.0 kg/m2 from self-reported weight and height.
- † The survey cited for racial and ethnic disparities provided estimates only for Mexican-Americans. The results are not representative of all U.S. Hispanics.
- 33 National Center for Health Statistics, Health, United States, 2012: With Special Feature on Emergency Care, Table 68, accessed Jan. 13, 2014.
Prevalence
For state-by-state data please see the tables below.
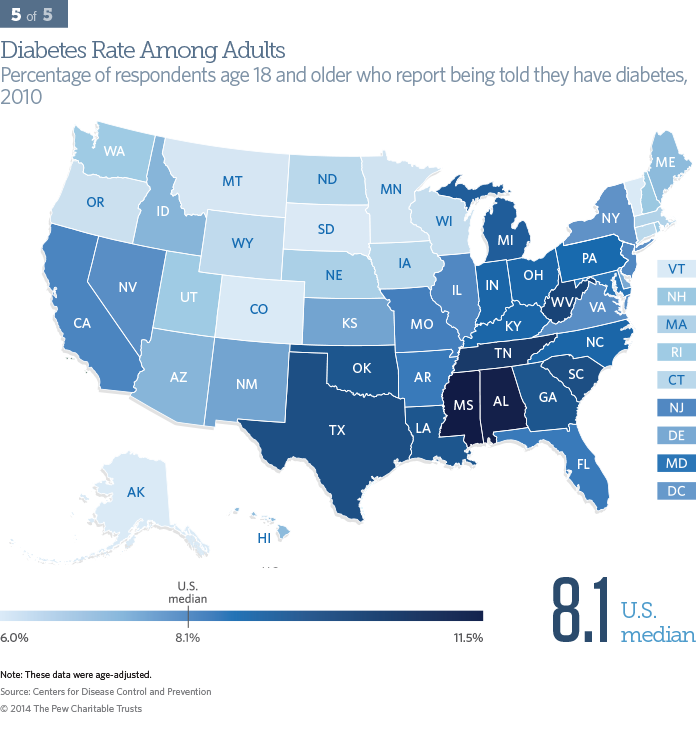
Diabetes prevalence among adults
Diabetes is a leading cause of death and disability in the United States and is a risk factor for heart disease, stroke, and other chronic diseases.
Over 25 million Americans age 18 and older reported living with diabetes in 2010.34 The rate of diabetes ranged from 6.0 to 11.5 percent across the United States. Alaska, Colorado, and Vermont had the lowest prevalence, and Mississippi had the highest. Diabetes tended to affect men more than women, and more people over 65 had the disease than any other age group. Blacks and Mexican-Americans* were more likely than whites to live with diabetes. Rates did not change significantly by income level.35
State policymakers can adopt policies to control diabetes, including monitoring the disease's prevalence, supporting community-based prevention and management programs, increasing access to quality health care, and educating and informing the public about its prevention and control.
- * The survey cited for racial and ethnic disparities provided estimates only for Mexican-Americans. The results are not representative of all U.S. Hispanics.
- 34 Centers for Disease Control and Prevention, "2011 National Diabetes Fact Sheet," accessed Oct. 12, 2013, http://www.cdc.gov/diabetes/pubs/pdf/ndfs_2011.pdf.
- 35 National Center for Health Statistics, Health, United States, 2012: With Special Feature on Emergency Care, Table 45, accessed Jan. 13, 2014.
Prevalence
For state-by-state data please see the tables below.
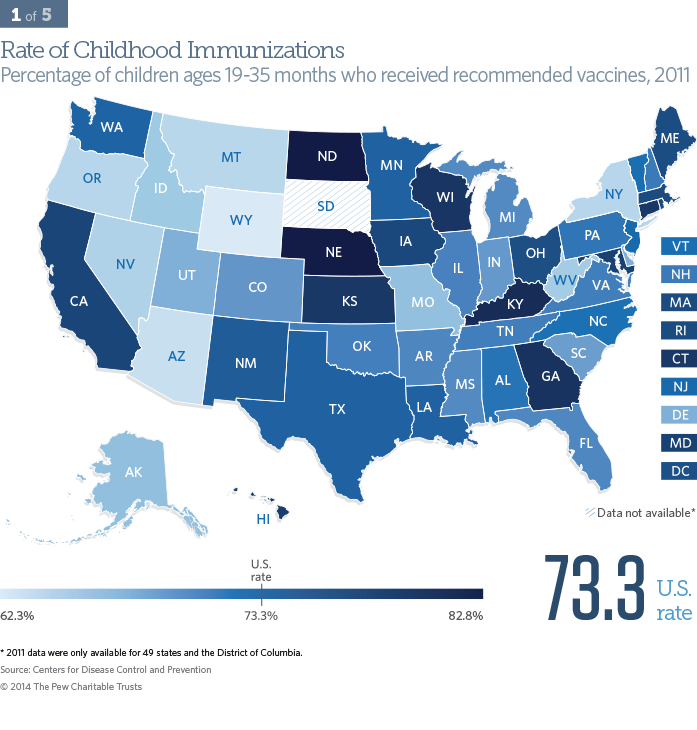
Childhood immunizations
Immunizations are critical to keeping people safe from a number of infectious diseases. Because vaccinations are routinely administered during well-child visits at no cost (subsidized by federal or state governments or private organizations), the immunization rate is a good proxy for looking at whether children 19 to 35 months of age are generally receiving the recommended level of health care.
Nationally, 73.3 percent of children received the recommended vaccines per the U.S. Department of Health and Human Services' effort, Healthy People 2020.* Those least likely to have received the full schedule of recommended vaccines lived in Wyoming (at a rate of 62.3 percent), and those most likely lived in North Dakota (at 82.8 percent). Immunization rates were similar among racial and ethnic groups, as well as among rural and urban areas. But children below the poverty level were less likely to have received the full vaccine schedule, compared with those at or above the poverty level.36
State policymakers can use a number of strategies to improve childhood vaccination rates, including providing free vaccines, adopting initiatives that support better access to vaccines, requiring immunizations for admission to schools and day care centers, encouraging health professionals to educate parents about the safety and benefits of vaccinations, and providing financial incentives to health professionals who improve immunization rates.
- * Recommended vaccinations are defined here as the 4:3:1:3:3:1:4 schedule: 4 doses DTaP (diphtheria, tetanus, and pertussis), 3 polio, 1 MMR (measles, mumps, and rubella), 3 Hib (Haemophilus influenzaetype b), 3 hepatitis B, 1 varicella, and 4 pneumococcal conjugate vaccine.
- 36 National Center for Health Statistics, Health, United States, 2012: With Special Feature on Emergency Care, Table 45, accessed Jan. 13, 2014.
Prevention & treatment
For state-by-state data please see the tables below.
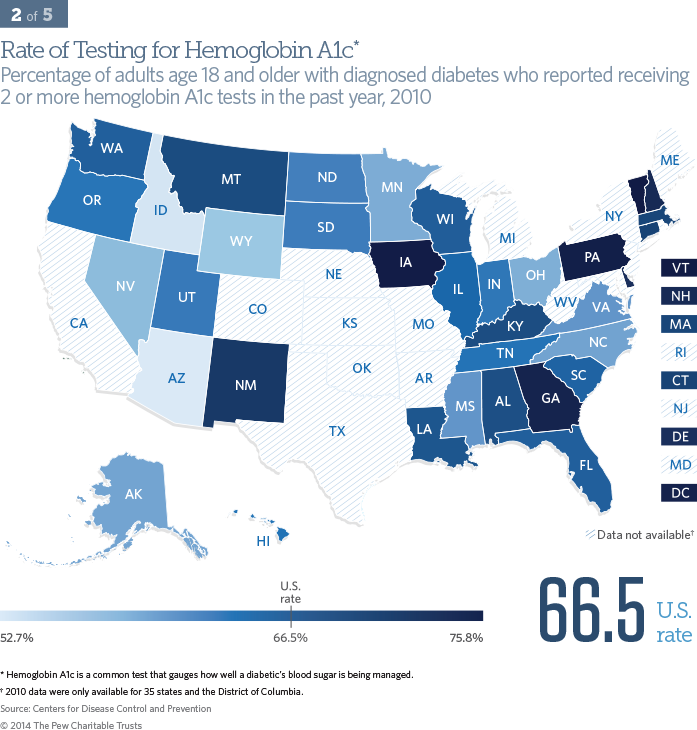
Diabetes care: hemoglobin A1c testing
Diabetes is a leading chronic disease among Americans, and hemoglobin A1c tests are one of the best ways to monitor how well it is being managed. The American Diabetes Association recommends that people with diabetes regularly assess blood sugar levels by having at least two HbA1c tests per year and get treatment based on those results.37 This basic test signifies whether health professionals are following recommended practices and could also suggest how well patients are educated about controlling their blood sugar and whether they access health care services, but it does not reflect diabetes outcomes.
In 2010, 35 states and the District of Columbia reported on the number of diabetics who had received the recommended two or more tests in the past year. The national rate of testing was 66.5 percent among diabetics, ranging from 52.7 percent in Arizona to 75.8 percent in Vermont. Hispanics were less likely to have at least two HbA1c tests a year than non-Hispanic whites.38
Private and public insurers can incentivize health professionals to provide recommended care through a variety of payment models—for example, paying a bonus when more than 90 percent of their diabetic patients receive two or more HbA1c tests.
- 37 American Diabetes Association, "Standards of Medical Care in Diabetes—2013," Diabetes Care 36, Supplement 1 (2013), accessed Jan. 16, 2014, http://care.diabetesjournals.org/content/36/Supplement_1/S11.short.
- 38 Agency for Healthcare Research and Quality, 2012 National Healthcare Disparities Report (Rockville, MD: U.S. Department of Health and Human Services, 2013), 236, accessed Jan. 16, 2014, http://nhqrnet.ahrq.gov/inhqrdr/reports/nhqr.
Prevention & treatment
For state-by-state data please see the tables below.
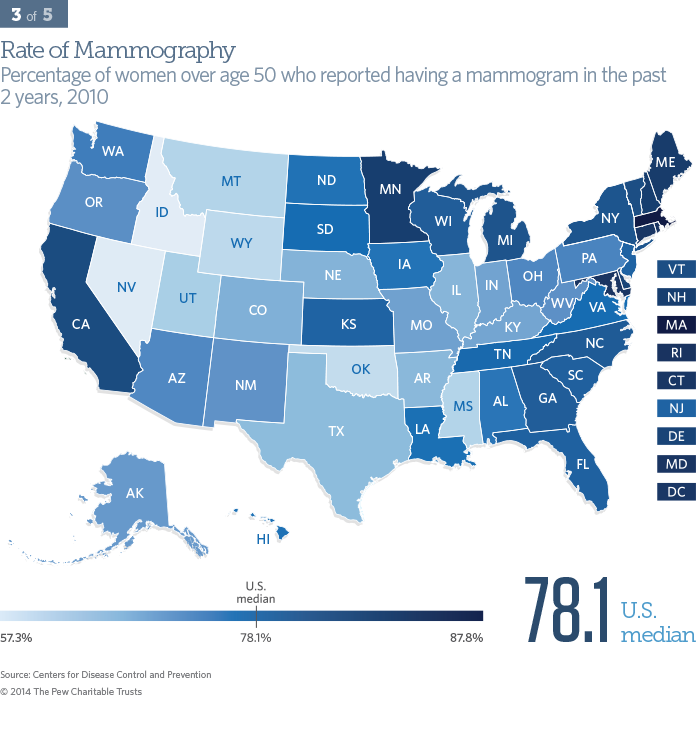
Mammography rate
Mammograms are noninvasive preventive tests to detect breast cancer, the second-leading cause of cancer death among women.39 Over 230,000 men and women are diagnosed each year.40 The U.S. Preventive Services Task Force recommends that women age 50 and older have a mammogram every two years.
Mammography rates indicate how often women in a given population receive the recommended test. Across the United States, Massachusetts had the highest mammography rate at 87.8 percent, and Idaho had the lowest at 67.3 percent. Receiving mammograms at the recommended intervals tended to be associated with women with higher incomes.41 Hispanic women disproportionately received fewer mammograms than women of non-Hispanic origin.42
Most states have already mandated insurance coverage of mammograms.43 State policymakers can further promote increases in mammography rates by enhancing prevention programs and educating women over age 50 about the risks of breast cancer and the importance of early detection. Health care providers can also be encouraged to improve the percentage of people receiving mammograms by, for example, being paid bonuses from insurance plans.
- 39 Centers for Disease Control and Prevention, "Cancer Among Women," accessed Nov. 8, 2013, http://www.cdc.gov/cancer/dcpc/data/ women.htm..
- 40 National Institutes of Health, "Breast Cancer," accessed Jan. 8, 2014, http://www.cancer.gov/cancertopics/types/breast/.
- 41 National Center for Health Statistics, Health, United States, 2012: With Special Feature on Emergency Care, Table 82, accessed Jan. 13, 2014.
- 42 Agency for Healthcare Research and Quality, 2011 National Healthcare Disparities Report (Rockville, MD: U.S. Department of Health and Human Services, 2012), 51, accessed Feb. 26, 2014, http://www.ahrq.gov/research/findings/nhqrdr/nhqr11/index.html
- 43 American Cancer Society, "State Efforts to Ensure Private Health Insurance Coverage of Mammography," accessed Nov. 20, 2013, http://www.cancer.org/cancer/breastcancer/moreinformation/breastcancerearlydetection/breast-cancer-early-detection-paying-for-br-ca-screening.
Prevention & treatment
For state-by-state data please see the tables below.
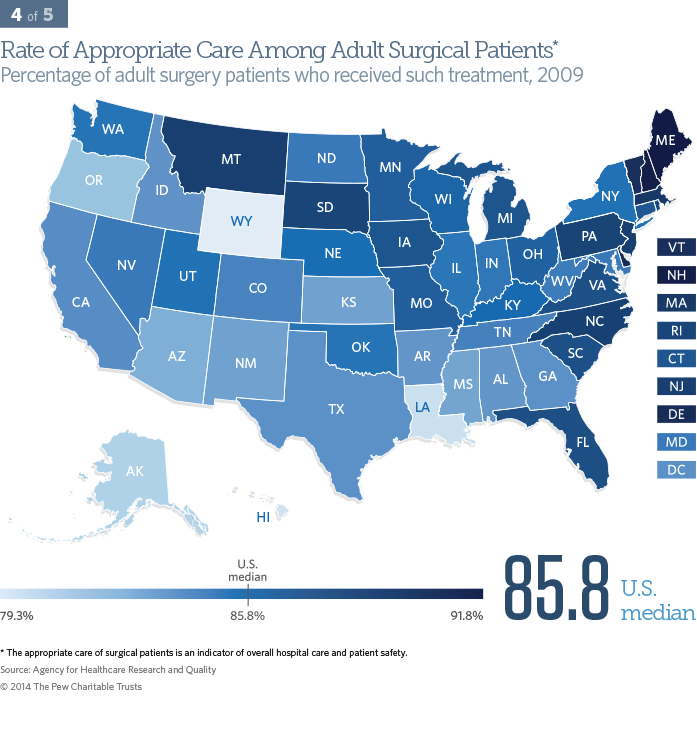
Appropriate surgical care
Surgery is a leading source of health care-associated infections—those that patients acquire while receiving treatment for other conditions. These infections can be devastating or even deadly. Therefore, it is critical that health care professionals practice the recommended safe and appropriate surgical protocols at medical facilities. This indicator identified eight practices to prevent surgery-related complications.*
Appropriate care among surgical patients is an indicator of overall hospital care, and specifically patient safety. In 2009, 85.8 percent of adults received appropriate surgical care. Wyoming had the lowest proportion of surgical patients receiving appropriate care at 79.3 percent, and Maine had the highest at 91.8. The rate was fairly similar among the states and among people regardless of race, ethnicity, and gender.44
The rates of appropriate care for surgical patients can be influenced by private and public insurance programs that pay health professionals more for either improving their performance (such as a 10 percent improvement from the prior year) or reaching a goal (95 percent of surgical patients received appropriate care). After numerous such interventions, the national average exceeded 95 percent in 2012; state-level data are not yet available for 2012.
- * Appropriate surgical care measures include: (1) prophylactic antibiotic received within one hour before surgical incision, (2) recommended prophylactic antibiotic used for surgical patients, (3) prophylactic antibiotics discontinued within 24 hours after the surgery end time, (4) cardiac patients had controlled postoperative blood glucose, (5) surgery patients received appropriate hair removal, (6) surgery patients on beta-blocker therapy before arrival received a beta-blocker during the perioperative period, (7) surgery patients received recommended venous thromboembolism prophylaxis, and (8) surgery patients received appropriate venous thromboembolism prophylaxis within 24 hours prior to surgery to 24 hours after surgery.
- 44 Agency for Healthcare Research and Quality, 2011 National Healthcare Disparities Report, 144, http://www.ahrq.gov/research/findings/nhqrdr/nhdr11/nhdr11.pdf.
Prevention & treatment
For state-by-state data please see the tables below.
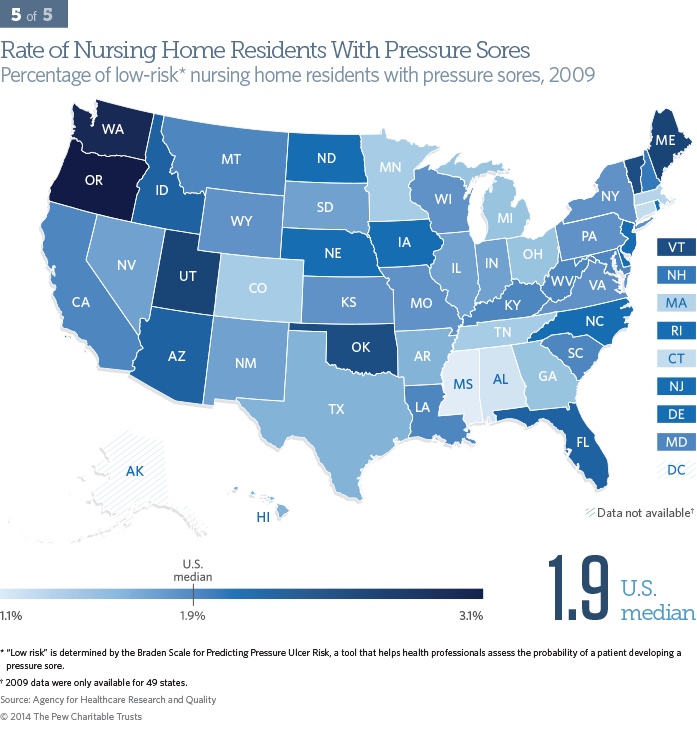
Nursing home pressure sores
Pressure sores are ulcers or open blisters on the skin that occur after long episodes of pressure. Most commonly, they result from lying in bed or sitting in a chair for prolonged periods without changing position. Pressure sores, also known as bedsores or decubitus ulcers, are potentially preventable if patients are tended to regularly. They can cause pain and infection, contribute to lengthened hospital stays, and place patients at greater risk of death. Pressure sores are generally treatable, but the cost of treating them is high. Elevated rates of pressure sores can indicate poor attention to patients, although some are not preventable or treatable.
Of the 49 states reporting on the percent of low-risk* nursing home residents with pressure sores, Mississippi had the lowest rate at 1.1 percent, and Oregon had the highest at 3.1 percent. The U.S. median was 1.9 percent. Rates were highest among black and Hispanic nursing home residents.45
The prevalence of pressure sores has dropped as a result of programs that increase education and prevention efforts by health professionals. Policy strategies to reduce rates for pressure sores include public reporting of a facility’s rate of such sores, bonus payments for decreasing or attaining a specified rate, and employing multi-facility and statewide networks for quality improvement.
- * Risk is determined by the Braden Scale for Predicting Pressure Ulcer Risk, a tool that helps health professionals assess the probability of a patient developing a pressure sore.
- 45 N. Bergstrom and S. D. Horn, "Racial Disparities in Rates of Pressure Ulcers in Nursing Homes and Site of Care," JAMA 306, no. 2 (2011); Agency for Healthcare Research and Quality, 2012 National Healthcare Disparities Report.