The 2014 Voting Experience
Overview
To better understand voters’ experiences in the 2014 midterm elections, The Pew Charitable Trusts conducted analysis to examine both the expectations and the reality of voting practices. Among the most notable findings: many voters spend less time waiting at the polls than they expect, many change their minds about how to cast a ballot, and those who obtain ballots by mail return them in a variety of ways, not always using the U.S. Postal Service.
These findings come from a series of surveys conducted with the same group of individuals in the months leading up to and immediately after the November 2014 midterm election.
Waiting at the polls
The length of time spent in line to vote is one of the most visible metrics in election administration. It was made even more prominent when the Presidential Commission on Election Administration concluded that no voter should wait more than 30 minutes.1 In the month before the 2014 midterm election, likely voters—survey respondents who said that they probably or definitely would vote—were asked how long they expected to wait in line at the polls. Forty-five percent anticipated spending less than 10 minutes in line at their polling places, and the same percentage expected to wait 10 to 30 minutes. Expectations differed significantly however, between likely voters who did vote in November and those who did not. About half (49 percent) of those who reported casting a ballot anticipated waiting less than 10 minutes to vote, while likely voters who ultimately chose not to vote predicted longer lines: Just 31 percent thought waits would be less than 10 minutes.
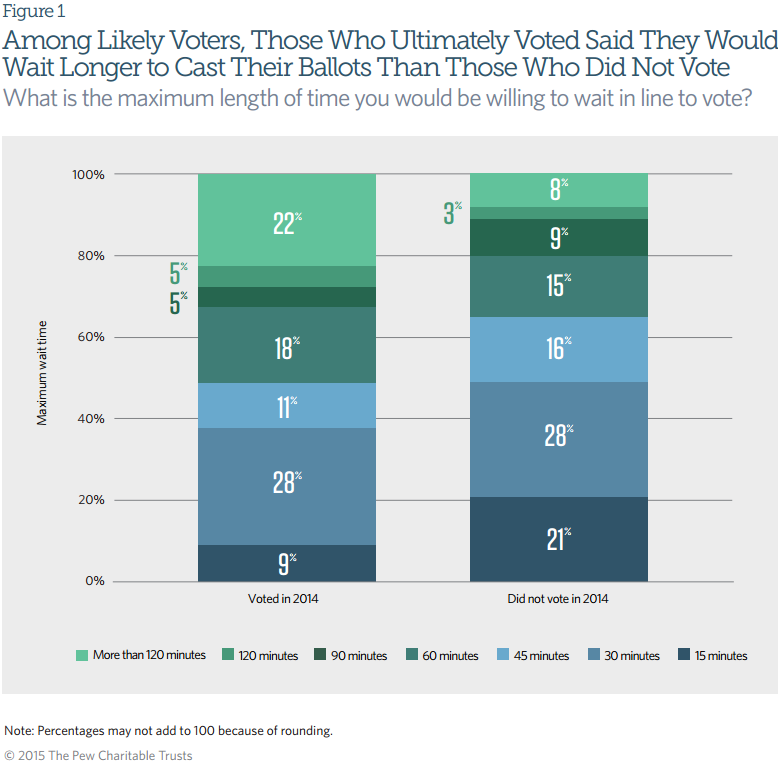
Likely voters were also asked about the maximum amount of time they would be willing to wait to vote. Four in 10 said they would not wait more than 30 minutes, including 12 percent who said that 15 minutes was the longest amount of time they would be willing to spend in line at the polls. Further, likely voters who ultimately voted were willing to wait longer than those who did not: Twenty-one percent of those who did not vote said they would not wait in line for more than 15 minutes, compared with 9 percent of those who did vote. Just 8 percent of nonvoters said they would be willing to wait more than two hours, compared with 22 percent of voters.
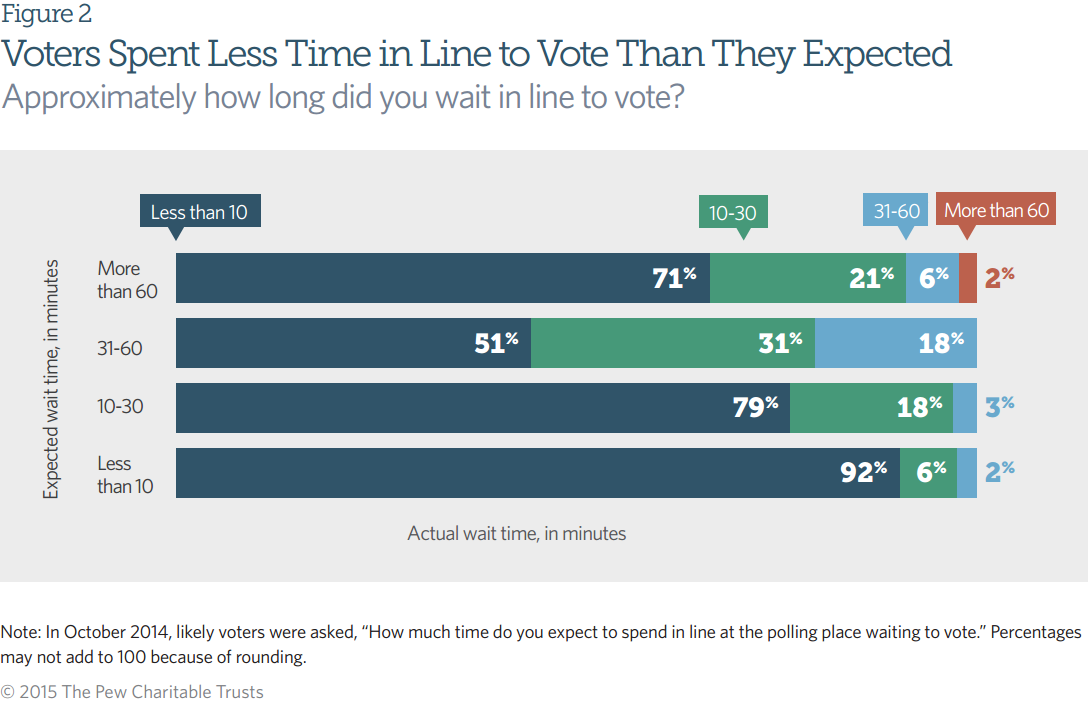
Most voters experienced shorter lines at their polling places than they expected. Eighty-three percent reported waiting less than 10 minutes, and 13 percent waited 10 to 30 minutes. Overall, these wait times either met or were shorter than what voters anticipated:
- 92 percent of people who expected to wait less than 10 minutes to vote actually did so.
- 71 percent of those who expected to wait more than an hour waited less than 10 minutes.
These expectations may be driven in part by voters’ experiences or their memories of media coverage during the 2012 presidential election, when lines were, on average, longer than those in 2014.2
Voting method
Election administrators are responsible for allocating resources such as ballots, voting machines, registration lists, and poll workers to serve voters and process ballots. One of the challenges they face is predicting how many people will vote in an election and, in states where mail voting is an option, whether they will vote in person or cast their ballots by mail. Several times during the months leading up to the 2014 election, respondents were asked whether they intended to vote and how they planned to cast a ballot.
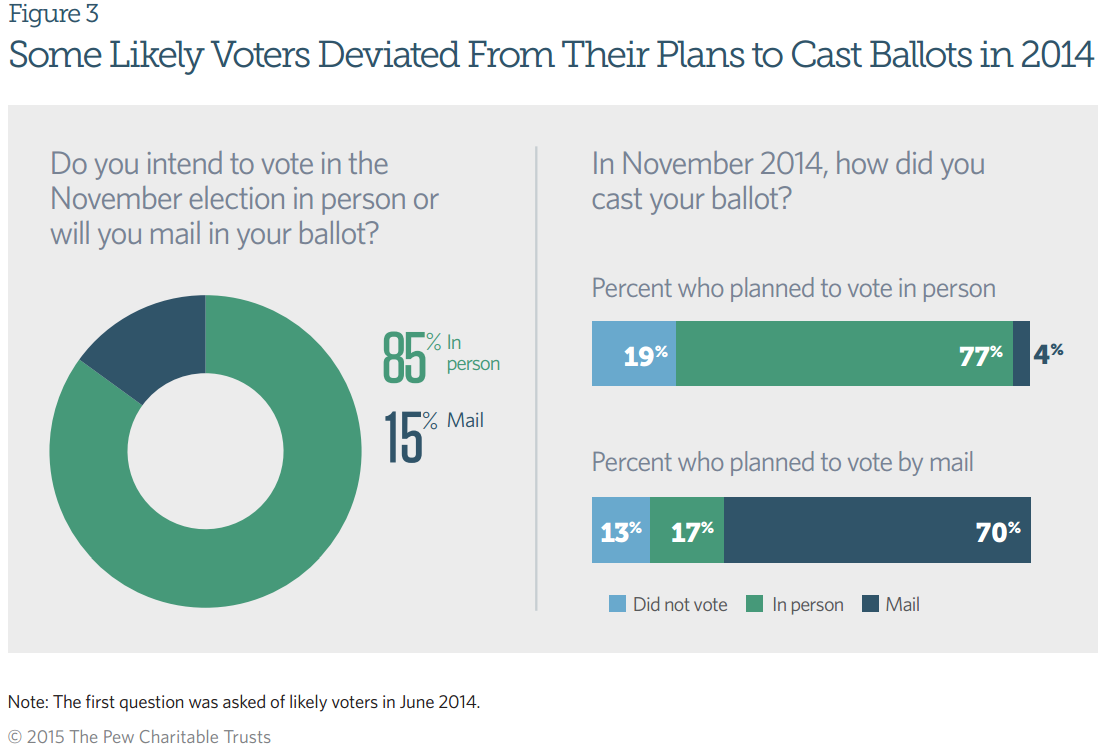
As a group, likely voters are relatively consistent about their plans to vote either in person or by mail. In June 2014, 85 percent of likely voters expected to vote in person and 15 percent expected to cast a ballot by mail. After the election, 80 percent of those who voted reported that they cast a ballot in person, and 20 percent said they voted by mail. Although the aggregate results were consistent, significant individual-level variation was apparent. Among likely voters who said in June that they planned to vote in person, about 4 percent ended up submitting a mail ballot, and 17 percent of those who originally expected to vote by mail went to the polls and voted in person.
Of those who requested absentee ballots in September or October 2014:
- 63 percent cast their ballots by mail.
- 23 percent voted in person, either at an early voting site or at a polling place on Election Day.
- 14 percent did not vote.
Researchers and election administrators often cite mail ballots as a way to reduce the burden of providing resources to accommodate voters at the polls.3 However, when a voter requests a mail ballot and then chooses to vote in person, the election administrator incurs two costs, first for printing and mailing a ballot and then for processing the voter at the polls.
Returning mail ballots
In recent years, mail voting has grown in popularity.4 At the same time, the methods that voters use to return their mail ballots are becoming increasingly diverse,5 compelling election administrators to plan for and manage multiple voting practices.
Among 2014 mail voters:
- 69 percent returned their ballots via the U.S. Postal Service.
- 29 percent returned them in person to an official election location such as a polling place, early voting center, or drop box.
- 85 percent returned their ballots themselves, and 14 percent gave their ballots to someone else to mail or drop off for them.
- Nearly half of mail voters returned their ballots more than a week before Election Day, and another quarter returned them a week before Election Day.

Conclusion
Most voters experienced short waits to vote in 2014, and many found the lines to be substantially shorter than they expected. Voters had more realistic expectations of the wait times than did nonvoters; survey respondents who turned out in the 2014 midterm election anticipated waiting in line for less time than did those who chose not to vote.
Voters’ expectations of themselves were sometimes unrealistic as well. Many people who intended to vote ultimately chose not to. Others changed their minds about their preferred methods for casting a ballot. Mail voting in particular can lead to unexpected outcomes. It introduces flexibility into the voting experience but can add complexity and costs for administrators when voters who request mail ballots ultimately vote by another means. Voters are taking advantage of the extended time during which they can return their ballots and are returning them other ways than via the Postal Service. These patterns are likely to continue as more states offer early and mail voting methods and as voters acclimate to using convenient options that fit their lives.
Methodology
Respondents were recruited to participate in the American Trends Panel, a nationally representative panel survey of randomly selected U.S. adults created by the Pew Research Center and managed by Abt SRBI. Self-administered Web surveys were given to the same group of respondents every month from March to December 2014, and those who do not use the Internet participated by postal mail. Surveys were available in English and Spanish. Data for this issue brief were drawn from wave 4 (May 30-June 30), wave 7 (Sept. 9-Oct. 3), wave 8 (Oct. 9-27), and wave 9 (Nov. 17-Dec. 15) of the panel. More information about the survey methodology can be found in the report Building Pew Research Center’s American Trends Panel.6
Endnotes
- Presidential Commission on Election Administration, The American Voting Experience: Report and Recommendations of the Presidential Commission on Election Administration (January 2014), https://www.supportthevoter.gov/files/2014/01/Amer-Voting-Exper-final-draft-01-09-14-508.pdf.
- Charles Stewart III, “2014 Survey of the Performance of American Elections Final Report,” Harvard DataverseV1 (Feb. 4, 2015), http://dx.doi.org/10.7910/DVN/28979.
- Christopher B. Mann, “Mail Ballots in the United States: Policy Choice and Administrative Challenges,” in The Measure of American Elections, ed. Barry C. Burden and Charles Stewart III (New York: Cambridge University Press, 2014), 113–140.
- John Fortier, Absentee and Early Voting: Trends, Promises, and Perils (Washington: AEI Press, October 2006). The proportion of voters casting ballots by mail in 2014 was almost triple the rate in 1980.
- Sean Green and Kyle Ueyama, “Vote-by-Mail Rates More Than Double Since 2000,” Stateline (April 2015), http://www.pewtrusts.org/en/research-and-analysis/blogs/stateline/2015/4/29/vote-by-mail-practices-more-than-double-since-2000.
- Pew Research Center, Building Pew Research Center’s American Trends Panel (Washington, DC: April 2015), http://www.pewresearch.org/files/2015/04/2015-04-08_building-the-ATP_FINAL.pdf. The sample size and panelist profile for each wave can be found on pages 22–23.


ADDITIONAL RESOURCES

Fact Sheet

Podcast