Household Expenditures and Income
 © Getty Images
Overview
Expenditures are a key but often overlooked element of family balance sheets. In measuring household financial security, significant attention is typically paid to income, but much less to whether those resources are sufficient to cover expenses. To begin addressing this gap in the policy discourse, this chartbook uses the Bureau of Labor Statistics’ Consumer Expenditure Survey to explore household expenditures, examining changes in overall spending and across individual categories from 1996 to 2014.1 It also details the differences in expenditures by income, with a particular focus on the degree to which households have slack in their budgets that could be devoted to savings and other wealth-building efforts.
This analysis focuses on the working-age population, which includes survey respondents or their spouses who are between the ages of 20 and 60. For the purpose of examining differences in spending by income, the sample was divided into thirds.
The analysis shows that both median income and expenditures contracted after the Great Recession, reflecting the economic turmoil of the country. By examining household spending, this research helps to shed light on family financial security over time, and especially in recent years. Key findings include:
- Overall median household expenditures grew by about 25 percent between 1996 and 2014, returning to pre-recession levels.2 After declining during and after the Great Recession, expenditures increased between 2013 and 2014 in particular. In 2014, the typical American household spent $36,800.
- Although expenditures recovered from the downturn, income did not. As the recovery began, median household expenditures returned to pre-crisis levels, but median household income continued to contract. By 2014, median income had fallen by 13 percent from 2004 levels, while expenditures had increased by nearly 14 percent.
- Low-income families spent a far greater share of their income on core needs, such as housing, transportation, and food, than did upper-income families. Households in the lower third spent 40 percent of their income on housing, while renters in that third spent nearly half of their income on housing, as of 2014. Because their core spending absorbed so much of their income, households in the lower income tier spent considerably less than their middle- and upper-income counterparts on discretionary items, such as food away from home and entertainment.
- Although all households had less slack in their budgets in 2014 than in 2004, lower-income households went into the red. In 2004, typical households at the bottom had $1,500 of income left over after expenses. By 2014, this figure had decreased by $3,800, putting them $2,300 in the red. The lack of financial flexibility threatens low-income households’ financial security in the short term and their economic mobility in the long term.
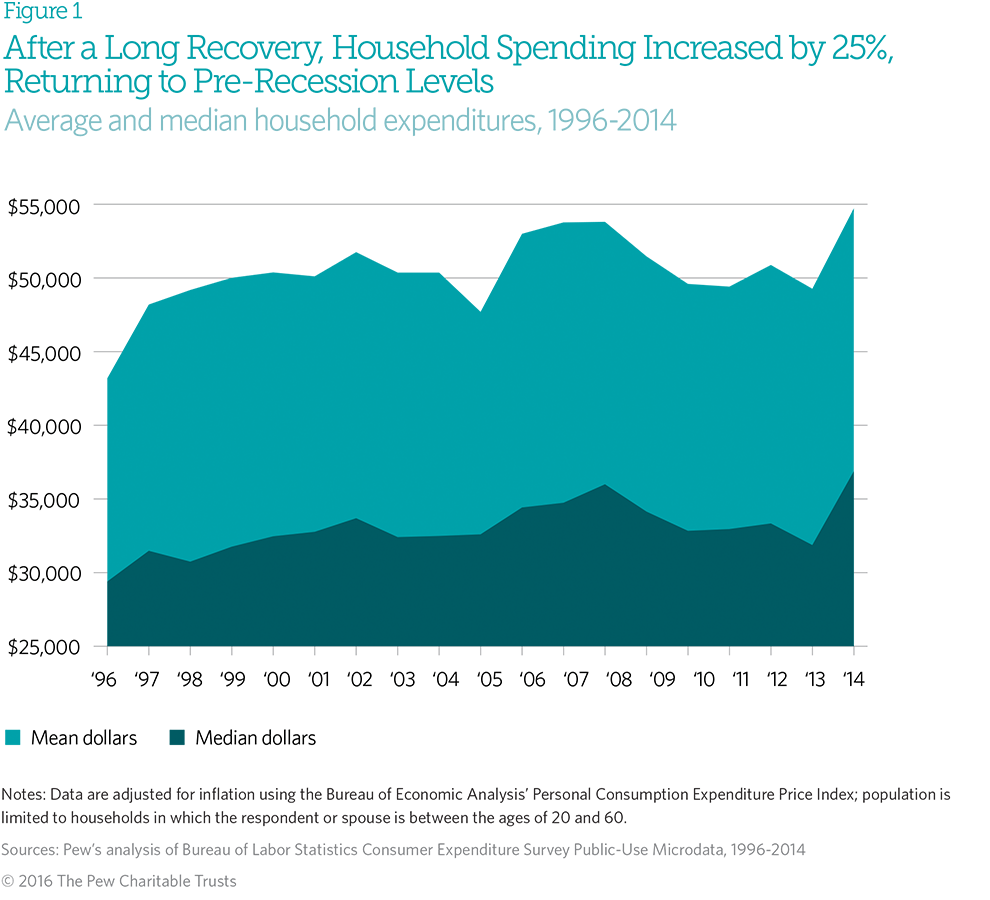
Households spent more in 2014 than they did in 1996, after adjusting for inflation; this holds whether the figures are based on averages (means) or medians. The typical household saw its expenditures grow by more than 25 percent, from $29,400 in 1996 to $36,800 in 2014. Mean expenditures grew 27 percent since 1996, rising from $43,200 to $54,800. Much of the growth occurred between 2012 and 2014, signaling a promising recovery from the Great Recession and the housing crisis.
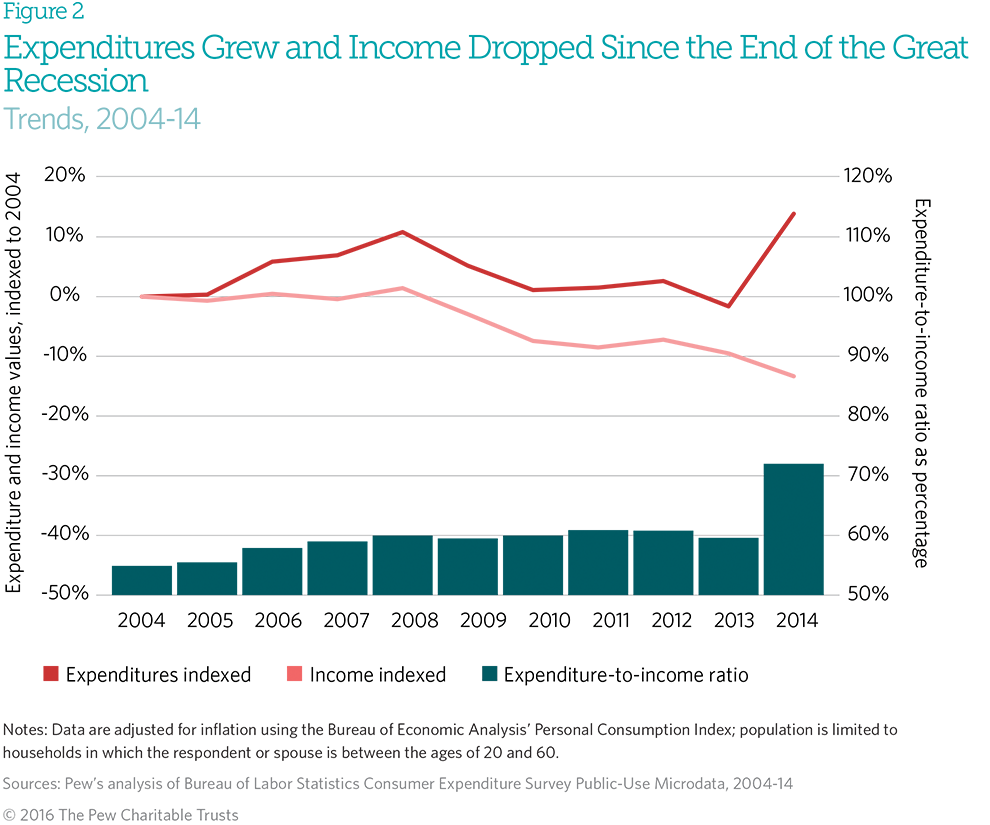
From 2004 to 2008, median household income grew by only 1.5 percent,3 while median expenditures increased by about 11 percent. During that period, the expenditure-to-income ratio (the percentage of a household’s budget used for spending) jumped by 9 percent. As the recovery began, median household expenditures returned to pre-crisis levels, but median household income continued to contract. By 2014, median income had fallen by 13 percent from 2004 levels, while expenditures had increased by nearly 14 percent. This change in the expenditure-to-income ratio in the years following the financial crisis is a clear indication of why and how households feel financially strained.
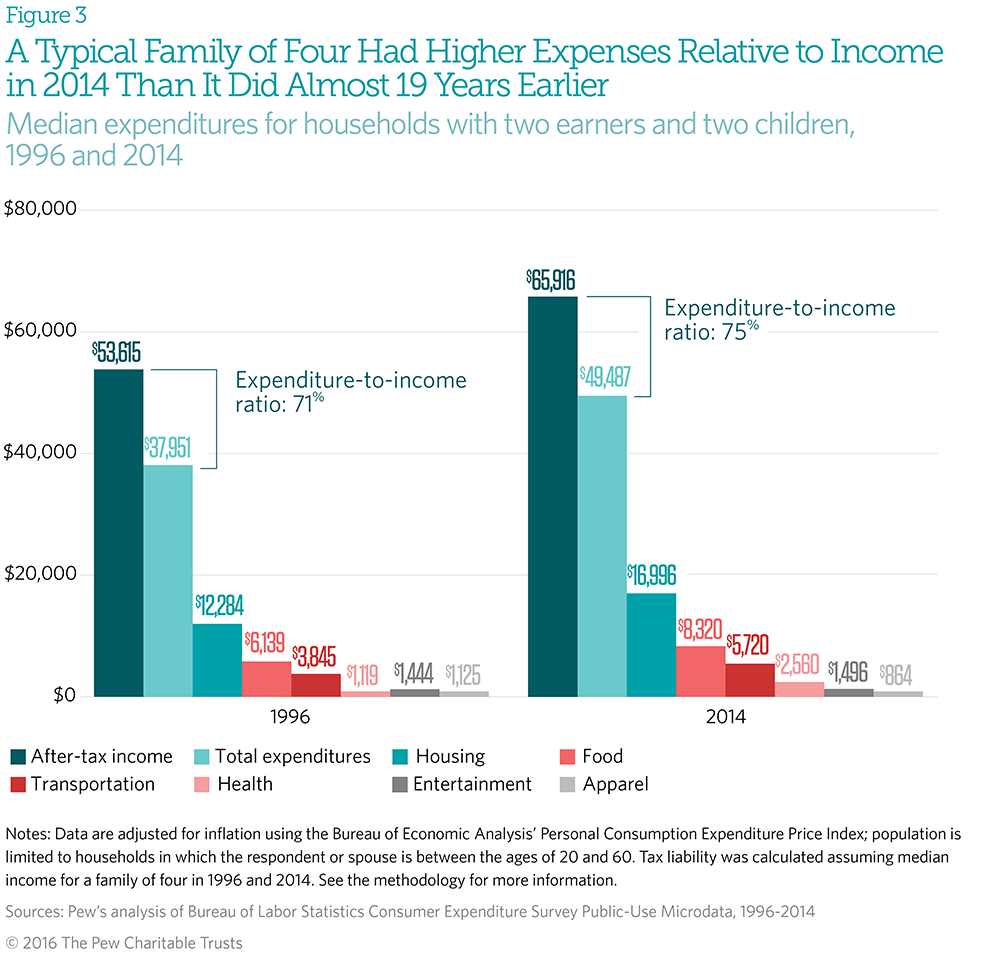
For a typical family of four (two earners and two children), while median household income increased by about $10,000 between 1996 and 2014, annual expenditures also increased by about the same amount, driven largely by higher spending for core needs: housing, food, and transportation. Although the absolute change in income and expenditures was similar, this family had less slack in its budget in 2014 than in 1996, as its expenditure-to-income ratio grew from 71 percent to 75 percent.
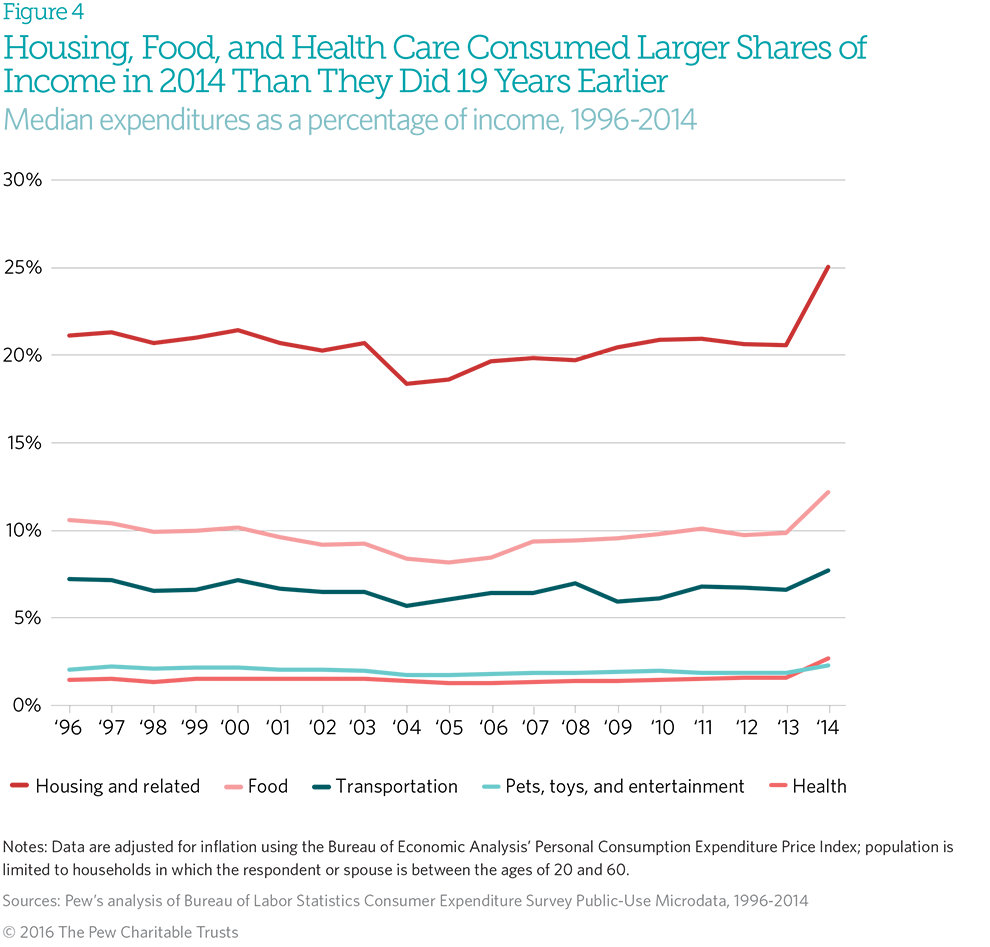
About two-thirds of families’ spending goes to core needs: housing, food, and transportation. In 2014, housing obligations accounted for the largest share of household pretax income, about 25 percent. Over the 19-year study period, aggregate median housing expenditures absorbed 21 percent of families’ pretax income. The second-largest expenditure, food, typically consumed nearly 10 percent of family income, while transportation took 7 percent. The proportion of household spending that these categories account for has shifted very little over the past two decades.
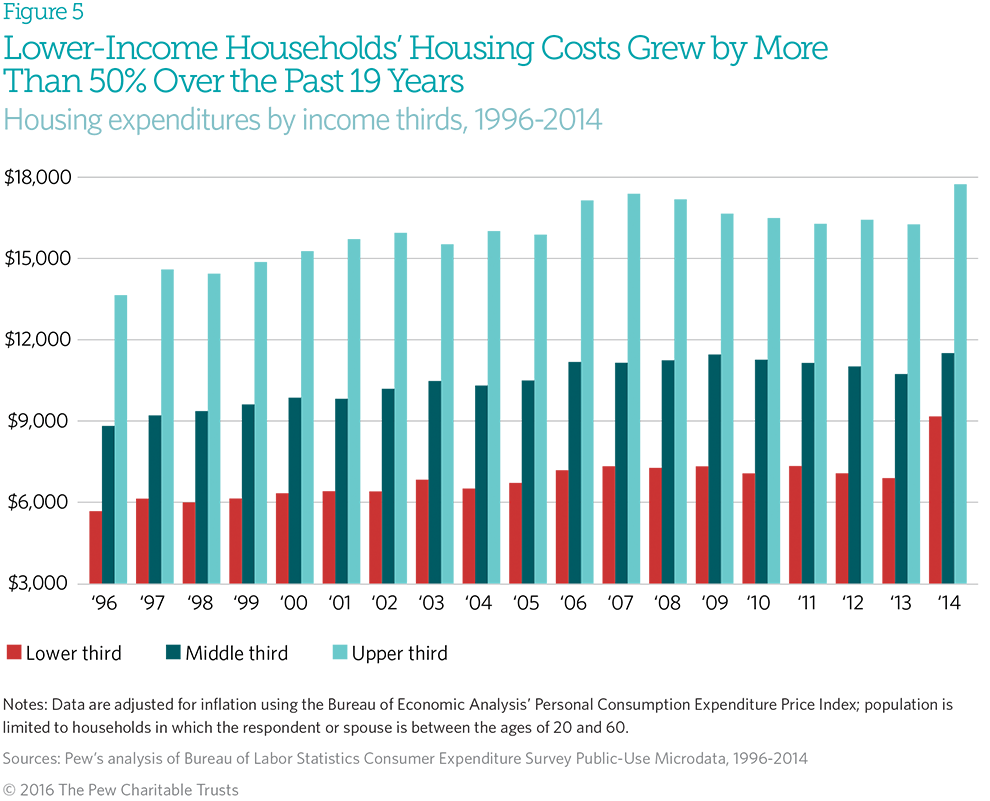
Over the past two decades, spending on housing increased for Americans in all income tiers. In 2014, households in the lower third spent much less in absolute dollar terms (about $9,200) than those in the middle or upper thirds, whose median housing expenditures reached $11,500 and $18,000, respectively. However, the typical lower-income household spent far more on housing as a share of income (40 percent) than those in the middle (25 percent) or at the top (17 percent).
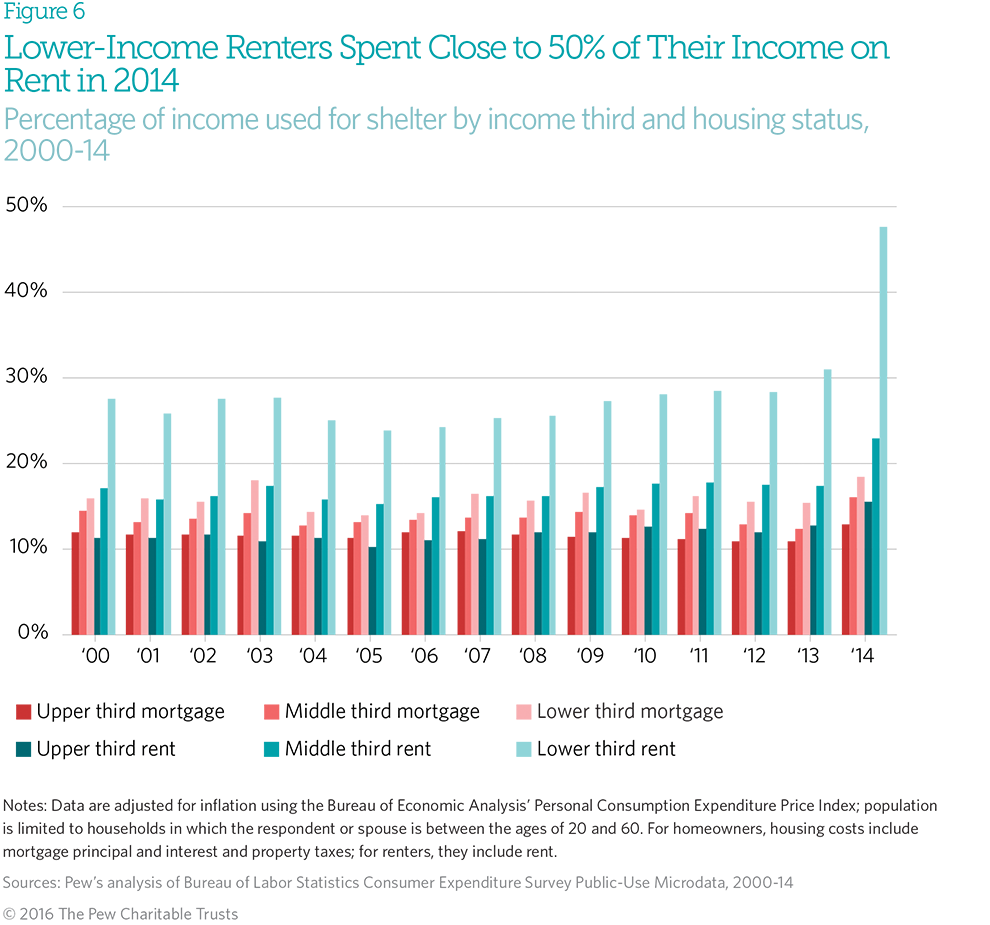
Since the start of the housing crisis in 2007, homeownership rates have declined among households in the middle- and upper-income tiers. These decreases have affected the rental market, as former owners became renters, leading to rental vacancy rates at historical lows below 7 percent.4 The diminished supply of rental properties increased the cost of rental housing dramatically; in 2014, renters at each rung of the income ladder spent a higher share of their income on housing than they had in any year since 2004. Although both renters and homeowners spent more for housing in 2014, notable differences in the proportion of household resources going to shelter were evident across income groups, with lower-income renter households spending close to half of their pretax income on rent.
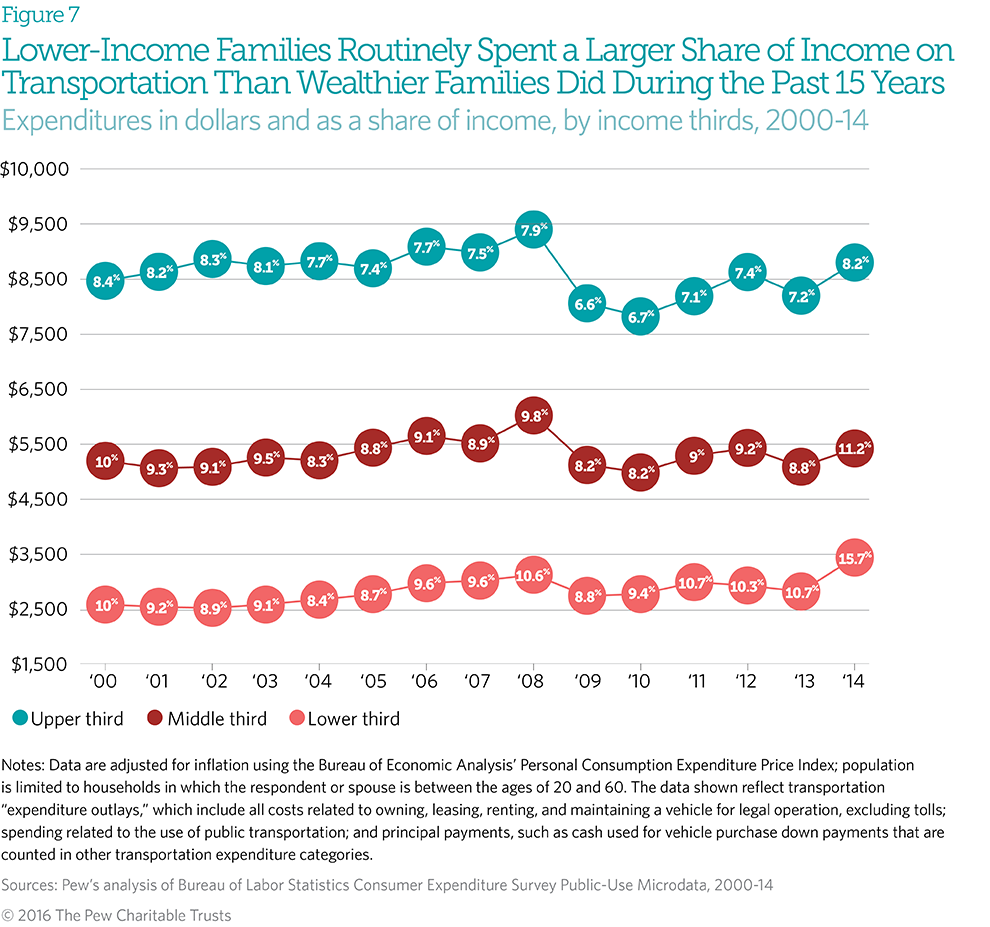
As with housing, households in the lower income group spend significantly less in absolute dollars, but much more as a share of their income, on transportation than did those in the middle- or upper-income groups. Further, transportation costs increased in recent years for households at the bottom, while this spending was more stable for the other income groups. Lower-income households spent nearly 16 percent of their income on transportation in 2014, up from 9 percent four years earlier. In contrast, households in the middle spent about 11 percent of their income on transportation in 2014, while those at the top spent 8 percent.
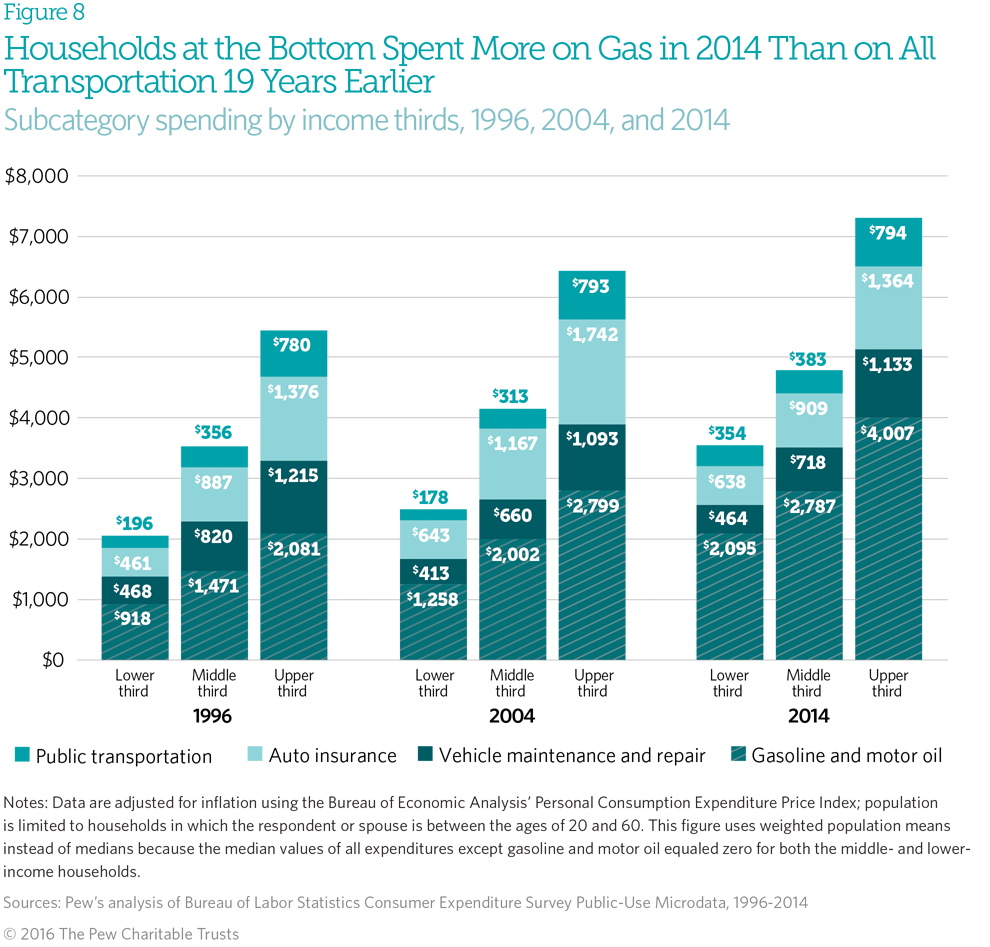
As the share of household income used for transportation increased, the amount going to various subcategories also grew. For all income groups, expenditures for gasoline and motor oil doubled between 1996 and 2014. For households in the lower third, the average annual cost of fuel, auto insurance, vehicle maintenance and repair, and public transportation in 1996 averaged $2,000 a year; by 2014, this group spent nearly $2,100 just on fuel. These extreme cost increases force households to make difficult choices and trade-offs to meet core needs.
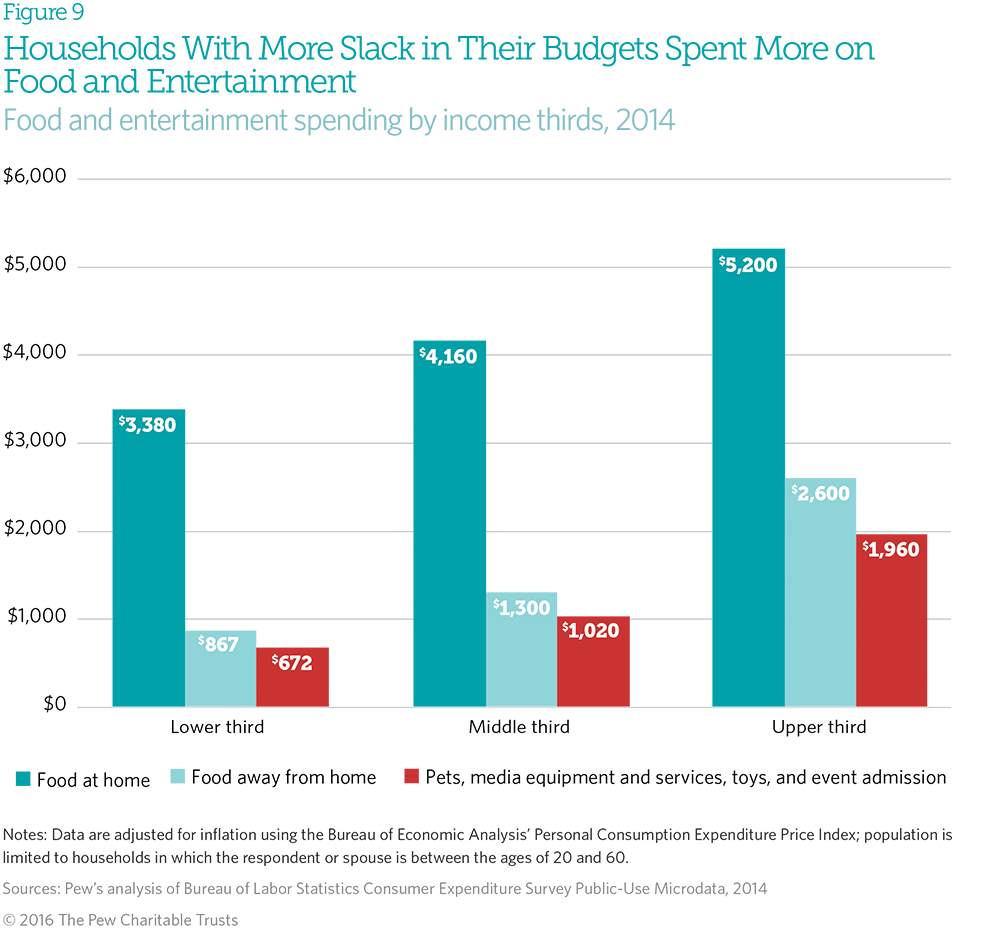
Though systemic economic conditions, such as recessions or stock market changes, affect trends in consumer expenditures, individual households also make decisions about how to spend their discretionary dollars. In 2014, households across the income distribution spent much more on groceries than on eating out, but, predictably, those in the top third spent much more on food away from home than the other groups. Households at the top also spent more than others on entertainment, including pets and pet care, media equipment and services, admission to events such as movies or plays, and toys for children. Typical households at the top spent $380 a month on eating out and entertainment. Conversely, households in the bottom third, which had significantly less slack in their budgets, devoted very few resources to these two categories— about $128 a month.
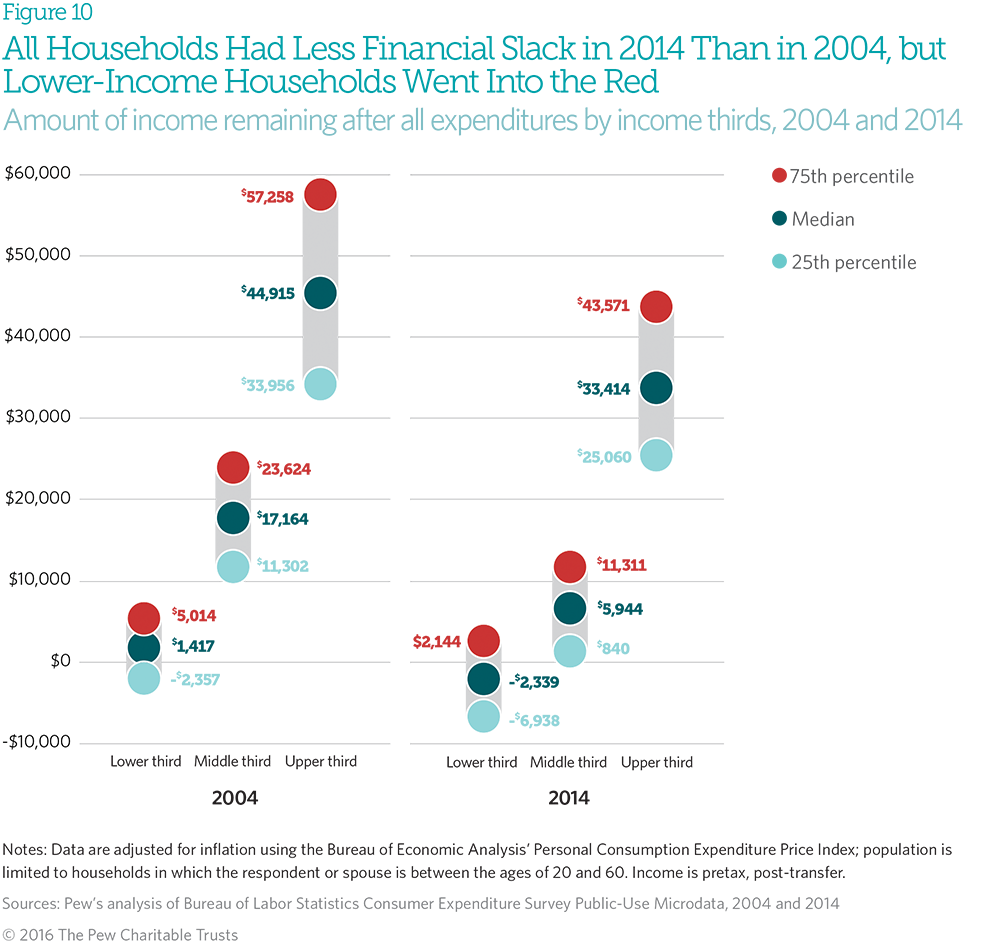
The amount of slack that families had in their budgets declined for all income groups between 2004 and 2014. This means households had less income to devote to wealth-building investments, such as short- and long-term savings, education, and life insurance. In 2004, the typical household in the lower third had a little less than $1,500 left over after accounting for annual outlays. Just 10 years later, this amount had fallen to negative $2,300, a $3,800 decline. These households may have had to use savings, get help from family and friends, or use credit to meet regular annual household expenditures. The typical household in the middle third saw its slack drop from $17,000 in 2004 to $6,000 in 2014. Of note, because income is measured before taxes, some families will have had even less slack in their budgets than this figure implies.
Endnotes
- Walter Lake (2015), Kiwi & Cassava Version 3 [Computer software], Washington, https://github.com/Kiwi-den-den/KIWI.git.
- This chartbook follows the lead of the Bureau of Labor Statistics in referring to consumer units interchangeably as households and families. However, not all consumer units are families. The BLS definition of a consumer unit is: “(1) All members of a particular household who are related by blood, marriage, adoption, or other legal arrangements; (2) a person living alone or sharing a household with others or living as a roomer in a private home or lodging house or in permanent living quarters in a hotel or motel, but who is financially independent; or (3) two or more persons living together who use their incomes to make joint expenditure decisions. Financial independence is determined by spending behavior with regard to the three major expense categories: Housing, food, and other living expenses. To be considered financially independent, the respondent must provide at least two of the three major expenditure categories, either entirely or in part.”
- In 2004, the Consumer Expenditure Survey started to include income data produced using multiple imputations. This change in methodology allowed the BLS to better capture income data when the respondent did not provide or refused to provide information on one or more e sources of income. The result of the methodical change is an increase in household income, which may explain in part the steep increase in income and the a.m. decrease in the expenditure-to-income ratio. Some caution should be exercised when comparing income values before 2004 with those after 2004. However, other nonrelated data sets, such as the U.S. Census Bureau’s Table H-8, Median Household Income by State: 1984 to 2014, also indicate that median household income increased by 2.3 percent from 2003 to 2004 and by 6.9 percent from 2004 to 2005. Therefore, this analysis assumes that median household income did increase but that the magnitude of that growth indicated in the Consumer Expenditur e Survey may reflect a combination of the improved data collection methodology and the actual increase.
- U.S. Census Bureau, “Annual and Quarterly Charts of Rental and Homeowner Vacancy Ratn es and Homeownership Rates,” accessed Oct. 13, 2015, http://www.census.gov/housing/hvs/data/charts.html.


America’s Overdose Crisis
Sign up for our five-email course explaining the overdose crisis in America, the state of treatment access, and ways to improve care
Sign up


The Precarious State of Family Balance Sheets


The Complex Story of American Debt
Liabilities in family balance sheets
Learn More


Extended Family Support and Household Balance Sheets
Getting by with a little help from friends and relatives
ADDITIONAL RESOURCES

Fact Sheet

Podcast


