States Have Weakest Tax Revenue Growth Since Recession
Note: These data have been updated. To see the most recent data and analysis, visit Fiscal 50
Despite the nation’s slow but steady economic recovery, combined state tax collections dropped in 2016, after adjusting for inflation. Flat or falling revenue increased budget pressures in many states. Even so, tax collections as of the fourth quarter were higher nationally and in 32 states than they were before plunging during the Great Recession.
In a rare decline since the end of the recession, quarterly state tax collections fell twice in 2016, after adjusting for inflation and averaging across four quarters to smooth seasonal fluctuations. Since tax revenue started recovering after the downturn, 2016 marked the first year that states took in less money than in the year before.
In the fourth quarter of 2016, states collectively took in 5.9 percent more tax revenue than they did before receipts fell in the first year of the recession. But that was down slightly from 6.0 percent in the previous quarter and from a post-recession high of 6.8 percent in the first quarter.
The only other time that tax revenue fell since the recession was in the first half of 2014, after taxpayers shifted income in response to federal tax changes.
The results mean that the 50 states combined had the equivalent of 5.9 cents more in purchasing power at the end of 2016 for every $1 they collected at their peak in 2008.
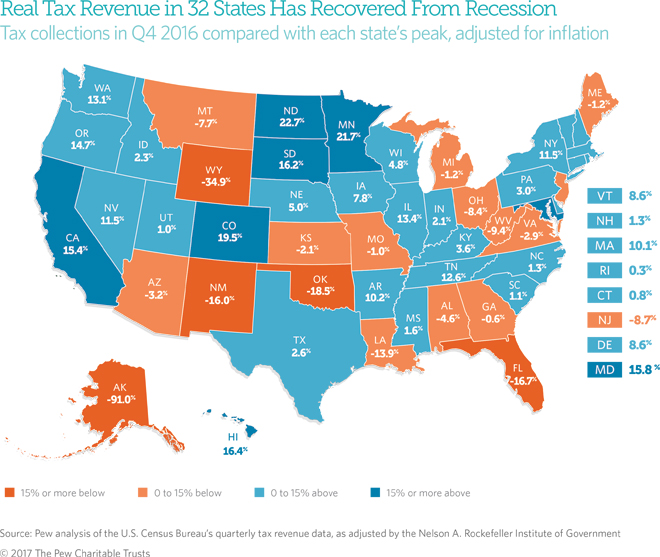
But trends varied widely by state. In seven of the 32 states in which collections had recovered from their losses in the recession by the fourth quarter, tax revenue—and thus purchasing power—was more than 15 percent higher than at its peak before or during the recession. Conversely, collections were down 15 percent or more in five of the 18 states in which tax revenue was still below peak.
State highlights
A comparison of each state’s tax receipts in the fourth quarter of 2016 with its peak quarter of revenue before the end of the recession, averaged across four quarters and adjusted for inflation, shows:
- Seven states posted tax revenue rebounds of 15 percent or more: North Dakota (22.7 percent), Minnesota (21.7 percent), Colorado (19.5 percent), Hawaii (16.4 percent), South Dakota (16.2 percent), Maryland (15.8 percent), and California (15.4 percent).
- North Dakota remained the leader among all states in tax revenue growth since the recession, although its collections have dropped dramatically since the 2014 plunge in oil prices. At the end of that year, receipts hit a high of 124.5 percent above their peak during the recession, compared with 22.7 percent above in the fourth quarter of 2016. Besides the decline in oil-related tax dollars, an income tax cut enacted in 2015 also reduced revenue.
- Alaska (-91.0 percent) was furthest below its peak. This means the state collected only 9 percent as much in inflation-adjusted tax dollars as it did at its short-lived peak in 2008, when a new state oil tax coincided with record-high crude prices. Without personal income or general sales taxes, Alaska is highly dependent on oil-related severance tax revenue, which began falling even before worldwide crude prices declined in 2014 as its oil production waned.
- Four additional states were down more than 15 percent from their previous peaks: New Mexico (-16.0 percent), Florida (-16.7 percent), Oklahoma (-18.5 percent), and Wyoming (-34.9 percent).
- Two states hit a new low in tax collections since the recession amid weakness in coal, oil, and natural gas industries: Wyoming (-34.9 percent) and West Virginia (-9.4 percent).
- Eight states had at least a full year of declining tax revenue: New York, Vermont, and energy-reliant New Mexico, North Dakota, Oklahoma, Texas, West Virginia, and Wyoming. The lengthiest slide—of eight straight quarters—has been in North Dakota.
- South Carolina (1.1 percent) for the first time moved onto the list of states whose tax revenue had recovered.
Latest trends
Drops were widespread in the final quarter of 2016, which was midway through the 2017 fiscal year for all but four states. Collections fell in 25 states, including most of the nation’s top oil producers.
According to preliminary figures from the Nelson A. Rockefeller Institute of Government, state tax collections picked up in 2017’s first quarter but were worse than expected in April tax filings in the final quarter of the fiscal year. Because states must balance their budgets each year, any revenue shortfalls must be covered before a fiscal year ends. According to surveys taken before the end of the fiscal year by both the National Association of State Budget Officers and the National Conference of State Legislatures, the highest number of states since the end of the recession expected to face budget shortfalls before the end of fiscal 2017.
Besides continued low energy prices, the Rockefeller Institute pointed to factors such as modest wage increases and weak consumer spending as contributing to the lackluster growth in tax revenue. The slowest growth in state personal income in three years also helped tamp down revenue growth at the end of 2016. Tax cuts contributed to drops in some states, such as Illinois, North Dakota, and Texas. And in a few, receipts showed declines because they grew more slowly than inflation. Eight had declines for at least a full year.
In addition, state income tax revenue likely also was affected by the possibility of federal tax cuts or other tax policy changes with the election of President Donald Trump, leading some taxpayers—especially high-income earners—to delay income until 2017 or accelerate deductions to try to lower their tax liabilities.
Although drops in total collections are rare, slow growth alone can lead to difficulties in balancing a state budget. Even if revenue increases, states may face higher expenditures due to population growth, changes in Medicaid costs and enrollment, and deferred or new needs for schools, safety-net programs, corrections, employee salaries and pensions, and road maintenance and construction.
Overall, state tax collections have bounced back more slowly after the 2007-09 recession than after the three previous downturns. Nationally, tax revenue recovered from its losses in mid-2013, after accounting for inflation. But individual state results have differed dramatically depending on economic conditions, population changes, and tax policy choices since the recession.
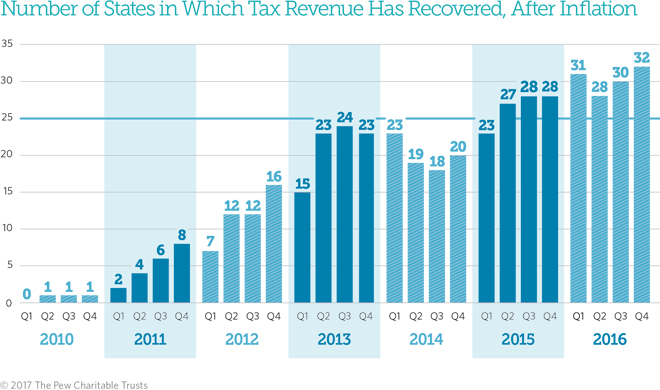
In 2010, North Dakota was the first state to surpass its recession-era peak, followed by Vermont, then Arkansas and New York by mid-2011. Tax receipts were above peak in eight states at the end of calendar 2011; 16 states at the end of 2012; 23 states at the end of 2013; 20 states at the end of 2014; 28 states at the end of 2015; and 32 states at the end of 2016.
Among states in which tax revenue has recovered, some, such as Nevada and Washington, have raised taxes since the recession, contributing to gains. Among states in which receipts remain below their previous peaks, some, such as Florida and Ohio, chose to cut taxes since the recession.
State budgets do not adjust revenue for inflation, so tax revenue totals in states’ own documents will appear higher than or closer to pre-recession totals. Without adjusting for inflation, 50-state tax revenue was 19.4 percent above peak and tax collections had recovered in 44 states—all except Alaska, Florida, Louisiana, New Mexico, Oklahoma, and Wyoming—as of the fourth quarter of 2016. Unadjusted figures do not take into account changes in the price of goods and services.
Adjusting for inflation is just one way to evaluate state tax revenue growth. Different insights would be gained by tracking revenue relative to population growth or state economic output.
Download the data to see individual state trends from the first quarter of 2006 to the fourth quarter of 2016. Visit The Pew Charitable Trusts’ interactive resource Fiscal 50: State Trends and Analysis to sort and analyze data for other indicators of state fiscal health.

Fiscal 50: State Trends and Analysis
Sort and chart data about key fiscal and economic trends in the 50 states, and read Pew's insights.


America’s Overdose Crisis
Sign up for our five-email course explaining the overdose crisis in America, the state of treatment access, and ways to improve care
Sign up
ADDITIONAL RESOURCES

Fact Sheet

Podcast


