For First Time, Tax Revenue Has Recovered in Majority of States
These data have been updated. To see the most recent data and analysis, visit Fiscal 50.
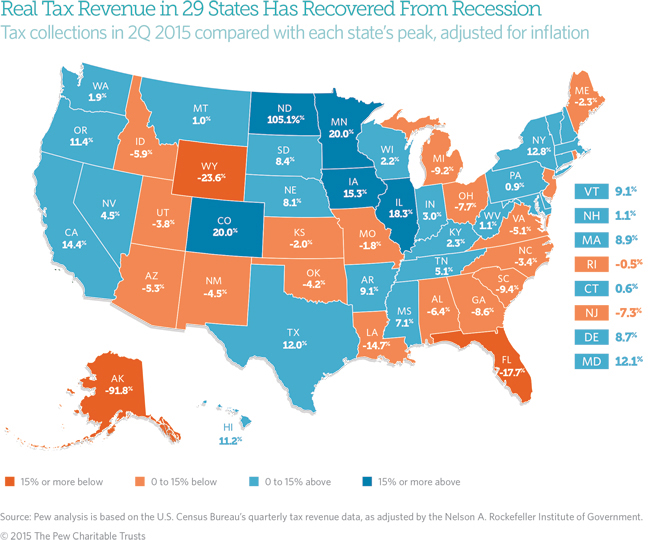
State tax revenue has passed a milestone on the road to recovery. Adjusted for inflation, tax receipts in 29 states had bounced back by the second quarter of 2015 from drops during the Great Recession. This is the first time recovery has widened to a majority of states.
Nationally, total state tax revenue recovered more than two years ago from its plunge in the Great Recession. In mid-2015, states collectively took in 5.6 percent more tax revenue than they did at the 50-state peak in the third quarter of 2008, after accounting for inflation and seasonal fluctuations.
But the total masks how widely recovery has varied across the states. In five of the 29 states in which tax revenue had recovered by the second quarter of 2015, receipts were more than 15 percent higher than at their inflation-adjusted peak before or during the recession. Conversely, collections in three of the 21 states with below-peak tax revenue were down 15 percent or more, after adjusting for inflation.
State results vary dramatically because of differences in economic conditions as well as tax policy choices since the recession. Among states in which tax revenue has recovered, some such as California and Minnesota raised taxes after the recession, contributing to gains spurred by economic growth. Not all states with tax increases have regained their prior revenue peaks. Among states in which receipts remain below their previous peaks, some such as Kansas and Ohio chose to cut taxes since the recession.
State highlights
A comparison of each state’s tax receipts in the second quarter of 2015 with its peak quarter of revenue before the end of the recession, averaged across four quarters and adjusted for inflation, shows:
- For the first time, Montana (1.0 percent), New Hampshire (1.1 percent), and Pennsylvania (0.9 percent) moved onto the list of states in which tax revenue has recovered. Three other states returned to the list after falling off in previous quarters: Connecticut (0.6 percent), Indiana (3.0 percent), and Wisconsin (2.2 percent).
- North Dakota, buoyed by an oil boom, continued to outpace all states, with tax receipts 105.1 percent above their highest point during the recession, although revenue has slipped over the past two quarters as crude prices have fallen.
- The next largest rebounds were in Minnesota (20.0 percent), Colorado (20.0 percent), Illinois (18.3 percent), and Iowa (15.3 percent). Illinois’ level has edged down since the January 2015 expiration of a temporary income tax increase.
- Alaska was furthest from its peak, down 91.8 percent. This was its lowest point since a short-lived windfall in 2008, when a new state oil tax coincided with record-high crude prices. As oil production has waned, the state has seen revenue decline for the past 10 quarters, even before a steep drop in worldwide crude prices.
- Also down more than 15 percent from their prior peaks were Wyoming (-23.6 percent) and Florida (-17.7 percent).
- Amid falling oil prices, six of the top 10 oil-producing states registered a decline from last quarter’s tax revenue levels: Alaska, New Mexico, North Dakota, Oklahoma, Texas, and Wyoming. Two other states also saw declines from last quarter: Illinois and Michigan.
- Two states with receipts well above peak—Colorado (20.0 percent) and Oregon (11.4 percent)—may not keep all of the tax revenue they collected in fiscal year 2015. Both have constitutional caps on tax revenue growth that can trigger refunds to taxpayers.
Trends
The increasing number of states to regain their tax revenue levels shows that the effects of the Great Recession are receding—but slowly. As recently as last quarter, the tax collections of just 23 states were back to prior peak levels. By this time after the 2001 recession, which was shorter and less severe, tax collections had rebounded in all but one state—Michigan.
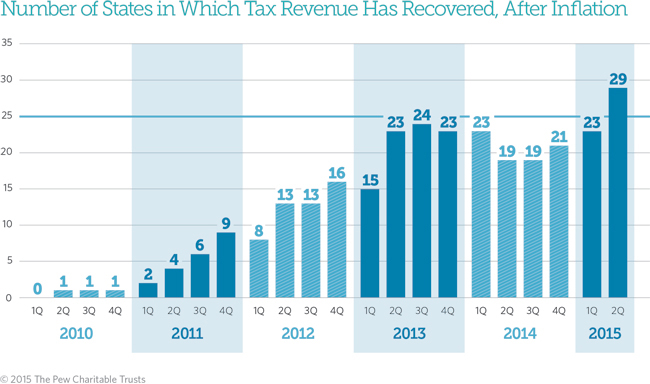
North Dakota in 2010 was the first state to surpass its recession-era peak, followed by Vermont, Arkansas, and New York by mid-2011. Tax receipts were above peak in nine states at the end of calendar year 2011; 16 states at the end of 2012; 23 states at the end of 2013; and 21 states at the end of 2014.
Combined, the 50 states now have the equivalent of about 6 cents more in purchasing power for every $1 they collected at their 2008 peak. For most states, current tax revenue levels are providing less or only a little extra purchasing power than they had more than six years ago, even as they face pressure to catch up on deferred spending or meet new needs for schools, safety-net programs, corrections, employee salaries and pensions, and road maintenance and construction. Since the end of the recession, for example, state populations have grown by more than 12 million people and millions more have enrolled in the state and federally financed Medicaid health care program.
Revenue outlook
Looking ahead, state tax revenue is expected to continue growing, though at a slower pace. Low oil prices and stock market volatility could impinge on growth in certain states. Preliminary figures show a “significant softening” in growth rates for the third quarter of 2015 compared with the first half of 2015, particularly in corporate and personal income tax receipts, according to the Nelson A. Rockefeller Institute of Government. States have also forecast slower growth in sales and personal income taxes this fiscal year compared with last, Rockefeller reported.
State budgets do not adjust revenue for inflation, so states’ own documents may show tax collections closer to pre-recession totals. Without adjusting for inflation, 50-state tax revenue was 16.8 percent above peak and tax collections had recovered in all but four states—Alaska, Florida, Louisiana, and Wyoming¬—as of the second quarter of 2015. Unadjusted figures do not take into account changes in the price of goods and services.
Adjusting for inflation is just one way to evaluate state tax revenue growth. Different insights would be gained by tracking revenue relative to population growth or state economic output.
Download the data to see individual state trends from the first quarter of 2006 to the second quarter of 2015. Visit The Pew Charitable Trusts’ interactive resource Fiscal 50: State Trends and Analysis to sort and analyze data for other indicators of state fiscal health.


America’s Overdose Crisis
Sign up for our five-email course explaining the overdose crisis in America, the state of treatment access, and ways to improve care
Sign up

Fiscal 50: State Trends and Analysis
Sort and chart data about key fiscal and economic trends in the 50 states, and read Pew's insights.
ADDITIONAL RESOURCES

Fact Sheet

Article