Retirement Security for Women
Progress to Date and Policies for Tomorrow
QUICK SUMMARY
As the baby boomers approach retirement, hardly a day passes without reference to concerns — in media outlets, policy discussions, and research circles — about whether households are saving enough to finance adequate living standards in retirement. Most of this discussion, however, focuses on the generation as a whole. In this paper, we explore financial prospects and problems for women and policies that could materially improve their financial security in retirement.
Introduction
First, as has been frequently noted and justly celebrated, women's education, earnings, and employment have risen substantially over time. Nevertheless, because of the demands of child-birth, child-rearing, adult care, and other factors, women still tend to experience shorter and more interrupted careers than men do, and are more likely to work either part-time or in low-paying occupations. The resulting work patterns adversely affect women's ability to save for retirement and to accumulate pension rights.
Because of these differences in work and retirement patterns, the substantial changes over time in the structure of pensions — the shift from defined benefit to defined contribution plans — have differentially affected the ability of men and women to prepare for retirement. Defined contribution (DC) plans tend to have faster vesting schedules and they also place less emphasis on long job tenures than defined benefit (DB) plans — these attributes help women save given their employment patterns. The loss of life annuities through DB plans, however, hurts women more than men because women tend to live longer and benefit more from the protection that guaranteed lifetime income provides against outliving their resources.
Second, marriage patterns and living arrangements have been changing in ways that adversely affect women's economic outcomes. Marriage rates have been falling and, in recent years, most of that decline has been among women with lower educational attainment. Single motherhood has also increased dramatically over the same period. Marital status and economic status are closely linked for women. The decline in marriage rates, particularly among households with lower education attainment, and the rise in single motherhood increase the likelihood that these families will be ill-prepared for retirement.
Third, women are likely to experience longer retirement periods than men because they tend to live longer than men and to stop working at earlier ages in order to retire at the same time as their, typically, older husbands. Not only do elderly women have to fund a longer retirement period, they also face the prospect of transitioning to poverty when their husband dies. This is due, in part, to expenses incurred at their husband's death and, in part, to the loss of his income. As a result, women have a
greater need for retirement saving and for forms of wealth that protect against outliving their assets.
In this paper, we describe the underlying reasons for the differences between men and women's retirement preparedness and the challenges for women from lowerincome families (Section II). In Section III, we delineate a series of specific policies that could materially improve the economic status of women in retirement. These policies include:
- Allowing care-givers to contribute to an Individual Retirement Account (IRA) and providing Social Security credit for episodes of care-giving, so that people who interrupt market work to care for family members are not penalized in terms of retirement saving;
- Establishing automatic 401(k) plans and automatic IRAs, so that almost all workers would be enrolled in a plan where the default was set so that they would participate unless they actively chose to withdraw;
- Expanding, rationalizing, and making refundable the Saver's Credit, so that moderate- and low-income workers would face clear and rewarding incentives to accumulate retirement wealth;
- Reforming the asset tests that accompany federal means-tested benefit programs, so that single mothers are not penalized for accumulating retirement saving;
- Increasing awareness among tax filers and preparers that individual income tax refunds may be directly deposited by the IRS into multiple accounts, so that tax filers have an easy and simple way of saving some portion of their refund.
In Section IV, we highlight a number of other areas where more research and policies are needed, including increased ability to annuitize retirement resources, to access housing equity for retirement consumption purposes, and to pay for long-term care.
The Changing Economic Landscape for Women
A. Employment and Wages
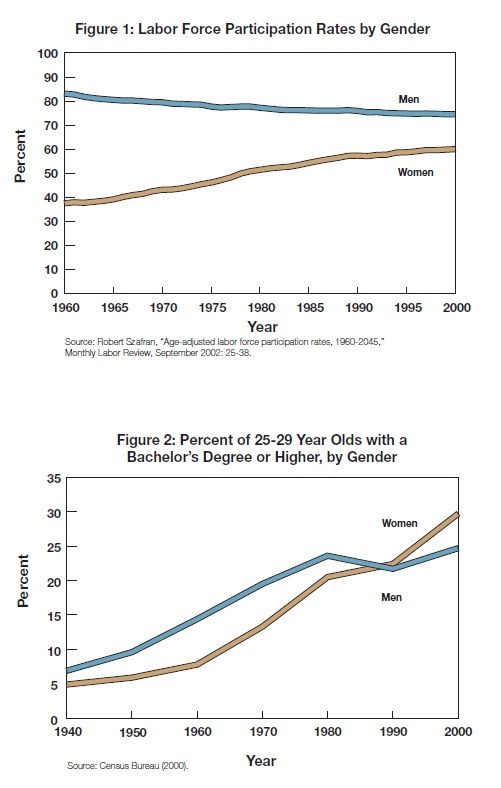
Women have experienced substantial gains in the labor market over the last several decades. The share of women in the labor force has grown from under 38 percent in 1960 to almost 60 percent in 2000 (See Figure 1). Women have also made concomitant gains in educational attainment levels and wage rates. Today, a higher proportion of women than men graduate from college (Figure 2) and women's earnings are approaching the level of men's. These gains made by women have been driven, in part, by institutional changes that created employment opportunities for women and, in part, by changes in social norms that transformed the perception of women's work from a “job” to “career” and galvanized women's participation in the labor force.3
B. Retirement Plans
These gender differences in employment and wages lead to lower overall retirement saving for women compared to men. The last 30 years has seen a shift in employerprovided retirement coverage from DB to DC plans. In a DC plan, which ephasizes accumulating assets, women are able to save less than men because they have shorter careers and lower wages. Comparing retirement accounts of women and men, women near retirement are 5 percentage points less likely than men to have a pension or a retirement plan (such as a 401(k) and IRA). Women also have lower retirement assets than their male counterparts: the median female worker near retirement held $34,000 in a 401(k) plan or IRA whereas her male counterpart held $70,000 (Table 1).8
Marriage, Living Arrangement and Widowhood
Marriage patterns and living arrangements have changed considerable over the last half century. Fewer adults are married, more are choosing to divorce or remain single, or live in cohabiting households. Marriage rates have fallen from 77 per 1,000 unmarried women in 1970 to 41 in 2005.17 In recent years, most of the decline in marriage rates has occurred among households with lower educational attainment.18 The rise in single motherhood is also notable. The percent of all births to unmarried women has increased dramatically, rising from 5 percent in 1960 to 37 percent in 2005 (Figure 7).19
Specific Proposals to Improve Women's Retirement Proposals
For the reasons discussed above, many women will reach retirement age without having prepared adequately for their future. A number of options are available to policy makers to rectify these problems. Many of these options would also have the salutary effect of improving preparation for retirement among males as well.
An important component of a strategy to improve women's retirement preparedness would be to improve labor market opportunities and outcomes for women. These options could include incentives that enable women to continue working while providing care, such as allowing more flexible work arrangements through jobsharing or telecommuting; or shifting caregiving responsibilities to a third party through direct or indirect subsidies for care-giving. After decades of improvement, however, women's advances in earnings and entry into traditionally male-dominated industries appear to have slowed substantially in the 1990s.28 Furthermore, social norms and customs that affect women's employment choices (such as being the primary caregiver) may prove difficult to change.29 In the absence of further policy changes, the current gap, or at least a significant gap, in male-female employment patterns will likely persist in the future.
Hence, while we do not wish to downplay the importance of continued labor market improvement for women, we focus our discussion below on ways to make it easier for women to prepare for retirement, even assuming a wage gap will continue to exist between men and women.
However, one labor market pattern is worth highlighting. As more women claim benefits based on their own work history, the employment choices women make and the age at which they claim benefits will have an increasingly larger impact on their retirement security. Social Security benefits are based on the worker's 35-year average earnings and the benefits are actuarially adjusted if the worker claims at ages other than the normal retirement age (NRA). Benefits are reduced if the worker claims early and increased if the worker claims later.30
Given the way benefits are computed, working longer and delaying Social Security claiming is more beneficial to women than for men for a couple of reasons. First, because women live longer than men and will receive Social Security payments for a longer period of time, the value of increased payments from delayed claiming will be higher for women than for men.31 Second, working beyond age 62 could increase the worker's 35-year average earnings and increase the base over which her benefits are computed, which would lead to higher overall payments. Higher Social Security receipts could alleviate the probability of widowhood poverty for women since the additional resources (through current earnings or additional retirement saving) could help weather shocks arising from their husband's death, such as large out of-pocket medical expenses.
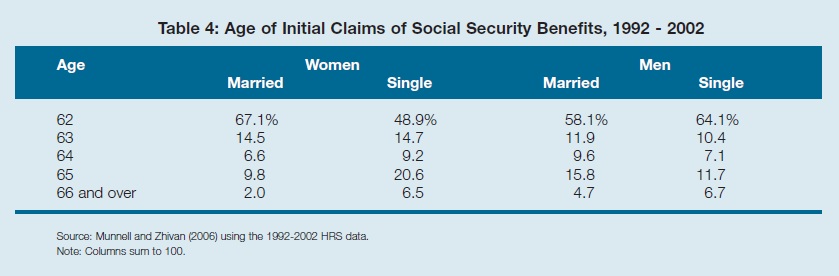
Despite the benefits of delayed claiming for women, the most common claiming age for both men and women is 62 (Table 4). Unmarried women are more likely to work longer than either married women or men. Married women, on the other hand, are more likely to claim at the earliest claiming age than men, partly because married couples usually choose to retire at the same time and women tend to be married to older men.32 Choosing later retirement ages thus could help women navigate retirement more easily.
Additional Areas for Consideration
In addition to the specific policy recommendations above, there are a number of key areas where further policy development could prove extremely helpful for women in retirement.
A. Annuitization
A critical component of retirement security for women would include a strategy to increase annuitization of retirement assets. Guaranteed lifetime income products provide insurance against outliving one's retirement resources, which make them particularly valuable to women because they have longer life spans than men and must fund a longer retirement period.
Despite the benefits, the market for guaranteed lifetime income products in the United States is very thin. In their current form, annuities lock in wealth that may be needed for medical expenses or bequests; they tend to be (or are widely perceived as being) priced too high for an individual with average life expectancy or too complex for ordinary consumers to understand and compare; the product and market structure exposes consumers and suppliers to considerable risks (such as interest rate risks or reinsurance risks); and regulation has limited the attractiveness of purchasing annuities through employersponsored retirement plans.
B. Housing Equity
The most important financial asset for most elderly households is housing equity; yet, the elderly do not appear to be consuming their housing wealth. The proportion of elderly persons who are income-poor but housing equity-rich is sizeable and this group tends to be mostly widows.59 Elderly women's consumption in retirement could be increased by tapping into their housing equity through reverse mortgages. This financial product allows the elderly person to withdraw equity from the home without having to sell or move out of the home. This latter feature appears to be particularly appealing to home-owners.
Despite the possibility of increased consumption in retirement through reverse mortgages, the demand for this financial product is quite low. One possible explanation is that many homeowners want to leave a bequest to their children. Leaving the house to their children (instead of selling it before they die) allows them to benefit from the step-up in basis, which reduces their tax liability. In order to design incentives to encourage homeowners to tap into their housing equity, more work needs to be done to understand why the current market for reverse mortgages is thin.60
C. Medical and Long-Term Care Expenses
A significant proportion of elderly persons will face some out-of-pocket health expenses despite health insurance coverage through the Medicare program. On average, medical out-of pocket (MOOP) expenses in the mid- to late-1990s accounted for about 10 to 20 percent of elderly persons' income. For the elderly living under the poverty line, MOOP spending was as much as 30 percent of income.61
At each age, women are estimated to face higher expected health care costs for their remaining lifetime than men. This result is partly attributable to women's longer life-span; however, even when differences in male-female survival probabilities are accounted for, expected female spending remains higher than men.62 In 2003, among Medicare beneficiaries, MOOP expenses averaged 24 percent of income for females compared to 19 percent for males.63
CONCLUSION
Elderly women today have lower retirement resources than elderly men, and it is projected that these gender differences will persist for future cohorts of retirees, despite secular improvements in women's earning power. Yet, women will have greater need for retirement resources because they tend to outlive their husbands, face a decline in income at widowhood and incur out-of-pocket medical expenses from their husband's death or their own medical needs. These problems can be addressed through a series of policy reforms that will help women save more and secure access to sufficient resources to fund their retirement.
REFERENCES
1 We thank William G. Gale, Melissa Green, Benjamin Harris, J. Mark Iwry and David John for very helpful comments. Andrew Gisselquist, Catherine Lee, Gina Russell, and Spencer Walters provided outstanding research assistance. We are grateful to Karen Holden, Cathleen Zick, Ethan Lewis and Mark Doms for sharing their data. 2 Recent contributions include Jonathan Skinner, “Are You Sure You're Saving Enough for Retirement?,” Journal of Economic Perspectives, Vol. 21, No. 3, Summer 2007; and Shlomo Benartzi and Richard Thaler, “Heuristics and Biases in Retirement Savings Behavior,” Journal of Economic Perspectives, Vol. 21 No. 3, Summer 2007. 3 Some of the major institutional changes over the first half of the 20th century include increases in the demand for office workers and part-time workers, growth in postsecondary institutions and improvements in home technology that reduced the time spent on housework. See Claudia Goldin, “The Quiet Revolution that Transformed Women's Employment, Education, and Family,” NBER Working Paper, 2006, available at www.nber.org. 4 In a given year, women are more than twice as likely as men to work part-time (BLS, 2004). Among those in the baby boom cohort (born between 1946 and 1960), half of women are projected to have 6 or more years with no earnings compared to a third of men (Chad Newcomb, “Distribution of Zero-Earnings Years by Gender, Birth Cohort, and Level of Lifetime Earnings,” Social Security Administration Research and Statistics Note No. 2000-02, 2000, available at www.ssa.gov). 5 See Francine D. Blau and Lawrence M. Kahn, “Gender Differences in Pay,” NBER Working Paper No. 7732, 2000, available at www.nber.org. 6 GAO, October 2003, “Women's Earnings: Work Patterns Partially Explain Difference between Men's and Women's Earnings.” Available at http://www.gao.gov/new.items/d0435.pdf. 7 There is some evidence that the narrowing wage gap is partly due to the selection of women with higher earnings potential entering the labor force in the 1980s. See Mark Doms and Ethan Lewis, “The Narrowing of the Male-Female Wage Gap”, FRBSF Economic Letters, february 2008, for more discussion. 8 Authors' calculation using the 2004 Survey of Consumer Finances (SCF). 9 Craig Copeland, “Employment-Based Retirement Plan Participation: Geographic Differences and Trends, 2004,” EBRI Issue Brief No. 286, 2005, available at www.ebri.org. 10 Vickie L. Bajtelsmit and Nancy A. Jianakoplos, “Women and Pensions: A Decade of Progress?,” Employee Benefit Research Institute Issue Brief No. 227, 2000, available at www.ebri.org; Peggy D. Dwyer, James H. Gilkenson, John A. List, “Gender Differences in Revealed Risk Taking: Evidence from Mutual Fund Investors,” Economic Letters, pp. 151-58, 2002; Annika E. Sunden, and Brian J. Surette, “Gender Differences in the Allocation of Assets in Retirement Savings Plans,” The American Economic Review, Vol. 88, No. 2, pp. 207-211, 1998; Leslie E. Papke, “How Are participants Investing Their Accounts in Participant Directed Individual Account Pension Plans?,” The American Economic Review, Vol. 88, No. 2, pp. 212-216, 1998; Leslie E. Papke, “Individual financial decision in retirement saving plans: the role of participant-direction,” Journal of Public Economics, Vol. 88, pp. 39-61, 2003. 11 When employee contributions are made to DB plans (which is far less common than employee contributions to 401(k)s), those are immediately vested as well. Employer contributions to DC plans must vest at least as fast as either 100 percent (“cliff vesting”) after 3 years of service or ratably beginning at 2 years and reaching 100 percent vesting after 6 years of service. Employer contributions to DB plans must vest at least as fast as either 100 percent after 5 years of service or ratably beginning at 3 years and reaching 100 percent vesting after 7 years of service. Internal Revenue Code Section 411(a)(2). 12 Hewitt, “Survey Findings: Trends and Experiences in 401(k) Plans”, 2005. 13 Life expectancy from birth is taken from Elizabeth Arias, “United States Life Tables, 2003,” National Center for Health Statistics, 2006, available at www.cdc.gov/nchs. 14 Women fare poorly relative to men if annuity rates are based on age and gender. Currently, not all private annuity contracts use gender in computing annuity rates. If, instead, gender-neutral annuity rates are used, women will fare better than men because of their longer life-span. 401(k) plans are required to use gender-neutral pricing to compute annuity values and this may partly explain the higher annuitization rates among female TIAA-CREF participants than male participants. See John Ameriks, “The Retirement Patterns and Annuitization Decisions of a Cohort of TIAA-CREF Participants,” TIAA-CREF Research Dialogues, No. 60, 1999, available at www.tiaa-crefinstitute.org. 15 401(k) plans have rules that protect the spouse as a beneficiary. If the married worker chooses to take distributions as an annuity, the spouse is protected under ERISA rules regarding spousal annuity. If the worker dies before receiving benefits, the assets automatically go to the surviving spouse. Spousal consent is also required if the married worker decides to select a beneficiary other than the spouse (U.S. Department of Labor). 16 Karen Holden and Sean Nicholson, “Selection of a Joint-and-Survivor Pension,” Discussion Paper No. 1175-98, University of Wisconsin, Institute for Research on Poverty, 1998. 17 Divorce rates more than doubled between 1960 and 1980 and have been gradually declining since 1980. For additional discussion, see The National Marriage Project, The State of our Unions, 2007: Social Health of Marriage in America, Rutgers, The State University of New Jersey, New Jersey, July 2007. 18 As opposed to earlier decades, college-educated women have been marrying at higher rates than their peers since the 1980s. 19 Data for 1960 through 1994: Office of the Assistant Secretary for Planning and Evaluation, U.S. Department of Health and Human Services, 1997, “Trends in the Well-Being of America's Children & Youth.” PF2.2: Percentage of All Births to Unmarried Mothers. Available at http://aspe.hhs.gov/hsp/97trends/PF2-2.htm. Data through 2005: Federal Interagency Forum on Child and Family Statistics, 2007, “America's Children: Key National Indicators of Well-Being, 2007.” Table FAM2.B: Births to Unmarried Women: Percentage of All Births to Unmarried Women by Age of Mother, 1980-2005. Available at http://www.childstats.gov/americaschildren. 20 Allen Dupree and Wendell Primus, Declining Share of Children Lived with Single Mothers in the Late 1990s: Substantial Differences by Race and Income, Center of Budget and Policy Priorities, June 2001, http://www.cbpp.org/6-15-01wel.htm 21 One reason is that unmarried women do not benefit from the economies of scale that make living as a married couple less expensive than living as two separate individuals. 22 Data from Census Bureau at http://www.census.gov/population/socdemo/hh-fam/fm1.xls 23 Kathleen McGarry and Robert F. Schoeni. "Widow(er) poverty and out-of-pocket medical expenditures at the end of life." Journals of Gerontology Series B: Psychological Sciences and Social Sciences, 60(3): S160-S168. 2005. 24 Nadia Karamcheva and Alicia H. Munnell “Why Are Widows So Poor?,” Center for Retirement Research, 2007, available at www.crr.bc.edu. 25 McGarry and Schoeni (2005). 26 Karamcheva and Munnell (2007). Purvi Sevak, David R. Weir and Robert J. Willis, “The Economics of a Husband's Death: Evidence from the HRS and AHEAD,” Social Security Bulletin Vol. 65, No. 3, 2003, available at www.ssa.gov and McGarry and Schoeni (2005) find similar results. Sevak, Weir and Willis (2003) find that among non-poor married couples aged 70 or more, 12 percent became poor after losing a husband. Similarly, Johnson, Mermin, and Uccello (2006) find that a husband's death increases a women’s risk of transitioning into poverty by 36 percent. 27 Figure from Karen Holden and Cathleen Zick (1998), “Insuring against the Consequences of Widowhood in a Reformed Social Security System,” in Framing the Social Security Debate edited by R. Douglas Arnold, Michael Graetz, and Alicia Munnell, Brookings Institution Press and the National Academy of Social Insurance: 165-7, 1998. 28 Blau and Kahn (2000). 29 Timothy M. Smeeding, “Social Security Reform: Improving Benefit Adequacy and Economic Security for Women,” Aging Studies Program Policy Brief, Center for Policy Research, Maxwell School of Citizenship and Public Affairs, 1999, available at cpr.maxwell.syr.edu. 30 The normal retirement age is 65 for those born in 1937 and earlier. It will increase gradually over time. For cohorts born in 1960 and later, the normal retirement age is 67. 31 A 65 year old woman in 2004 could expect to live another 20 years whereas a 65 year old man could expect to live another 17 years (CDC, National Center for Health Statistics, 2006, available at www.cdc.gov/nchs). 32 Courtney Coile, “Retirement Incentives and Couples' Retirement Decisions,” Topics in Economic Analysis and Policy, Vol. 4, Issue 1, 2004. 33 IRA earnings rules are based on household earnings. If the non-caregiving spouse continues to work, the caregiver may continue to be eligible to contribute. 34 The current IRA contribution limits are $4,000 ($5,000 if age 50 and older) for 2007 and $5,000 ($6,000 for age 50 and older) for 2008. After 2008, the contribution limit will be annually indexed in $500 increments, adjusted for the cost-of-living (COL). See http://www.law.cornell.edu/uscode/html/uscode26/usc_sec_26_00000219----000-.html#b_1_A. and Internal Revenue Service publication, http://www.irs.gov/pub/irs-pdf/p590.pdf, for the details of current IRA law. 35 The United Kingdom provides a Carer's Allowance for care-givers who meet certain requirements. 36 Under current Medicaid rules, transfers made within 60 months of applying for Medicaid assistance will delay or disqualify eligibility. The delay varies with the value of the transfer (assuming the applicant also meets the income and needs criteria). 37 See Pamela Herd, “Crediting Care of Marriage? Reforming Social Security Family Benefits,” Journal of Gerontology: Social Sciences, Vol. 61B no. 1, pp. S24-S34, 2000; and Howard Iams and Steven Sandell. “Changing Social Security Benefits to Reflect Child-Care Years: A Policy Proposal Whose Time has Passed?,” Social Security Bulletin, Vol. 57, no. 4, pp. 10-24, 1994. 38 See J. Mark Iwry, William G. Gale, and Peter R. Orszag, "The Potential Effects of Retirement Security Project Proposals on Private and National Savings: Exploratory Calculations," (Retirement Security Project Policy Brief No. 2006-2, November 2006; available at www.retirementsecurityproject.org). The study estimates that the automatic 401(k) could bring about a net increase of $44 billion a year in national saving. 39 Brigitte Madrian and Dennis Shea, "The Power of Suggestion: Inertia in 401(k) Participation and Savings Behavior," Quarterly Journal of Economics 116, no. 4 (November 2001):1149-87; and James Choi and others, "Defined Contribution Pensions: Plan Rules, Participant Decisions, and the Path of Least Resistance," in Tax Policy and the Economy, Vol. 16, edited by James Poterba (MIT Press, 2002), pp. 67-113. Related approaches have also proven effective, but generally are less powerful. One such approach is to require employees to make an explicit election so that inertia does not prevent employees from participating or lead them to contribute less than they would if they were required to choose. Another approach presents employees with a presumptive contribution rate packaged together with an investment option - not as a default, but as an easy choice employees can make by checking a single box. 40 Hewitt Associates, Trends and Experiences in 401(k) Plans 2005 survey. In 2005, the proportion was 75 percent. More recent data are available from the 2007 Hewitt survey. 41 Between 65-87 percent of new plan participants save at the default contribution rate. This percentage declines slowly to 40-54 percent after two years and to about 45 percent after three years (James Choi, David Laibson, Brigitte Madrian and Andrew Metrick, "For Better or For Worse: Default Effects and 401(k) Savings Behavior," in Perspectives on the Economics of Aging, edited by D. Wise, University of Chicago Press, 2004, pp. 81-121). 42 Richard Thaler and Shlomo Benartzi, "Save More Tomorrow: Using Behavioral Economics to Increase Employee Saving," Journal of Political Economy 112, no. 1, pt. 2 (2004), S164-S187. 43 William G. Gale and J. Mark Iwry, "Automatic Investment: Improving 401(k) Portfolio Investment Choices," (Retirement Security Project Policy Brief No. 2005-4, May 2005; available at www.retirementsecurityproject.org); William G. Gale, J. Mark Iwry, Alicia H. Munnell, and Richard H. Thaler, "Improving 401(k) Investment Performance," (Center for Retirement Research Issue Brief No. 2004-26, December 2004; available at www.bc.edu/crr); and J. Mark Iwry, "Promoting 401(k) Security," (Urban-Brookings Tax Policy Center, September 2003; available at www.taxpolicycenter.org). 44 William G. Gale and Michael Dworsky, "Effects of Public Policies on the Disposition of Lump-Sum Distributions: Rational and Behavioral Influences," (Center for Retirement Research Working Paper No. 2006-15, August 2006; available at www.bc.edu/crr). 45 See William G. Gale, J. Mark Iwry and Spencer Walters, “Retirement Saving for Middle- and Lower-Income Households: The Pension Protection Act of 2006 and the Unfinished Agenda” (Retirement Security Project Policy Brief No. 2007-1, January 2007) for additional details. 46 Wells Fargo, “Strategic Initiatives in Retirement Plans” 2007 Survey Analysis. 47 According to the 2007 Wells Fargo Survey, 21 percent of employers that offer automatic enrollment also automatically escalate contributions. According to the Hewitt Trends and Experience in 401(k) Plans 2007 Survey, 28 percent of employers that automatically enroll participants also automatically escalate contributions. 48 Gale, Iwry and Walters (2006) set out the “first generation” - “second generation” automatic 401(k) concepts and discusses them more fully. 49 Among wage and salary workers ages 18-64, an estimated 60.5 workers do not have access to employer-sponsored retirement plans. Authors' calculation using the March 2006 CPS data. 50 Craig Copeland, "Employment-Based Retirement Plan Participation: Geographic Differences and Trends, 2005: Employee Benefit Research Institute Issue Brief No. 299," November 2006, Figure 1, p. 7. An additional 16 million workers either are not eligible for their employer's plan or are eligible but fail to participate. Quantitatively similar but updated figures for 2006 are available in the Employee Benefit Research Institute Issue Brief 311. 51 See J. Mark Iwry and David C. John, "Pursuing Universal Retirement Security Through Automatic IRAs," (Retirement Security Project Policy Brief No. 2007-2, April 2007); J. Mark Iwry and David C. John, "Pursuing Universal Retirement Security Through Automatic IRAs," Testimony before the Senate Finance Committee, June 29, 2006. These and related publications are available at www.retirementsecurityproject.org. 52 S. 1141 and H.R. 2167. 53 For a detailed description of the automatic IRA, see J. Mark Iwry and David C. John, "Pursuing Universal Retirement Security Through Automatic IRAs," (Retirement Security Project Policy Brief No. 2007-2, April 2007). 54 J. Mark Iwry, William G. Gale, and Peter R. Orszag, "The Saver's Credit," (Retirement Security Project Policy Brief No. 2005-2, March 2005; available at www.retirementsecurityproject.org); and J. Mark Iwry, William G. Gale, and Peter R. Orszag, "The Saver's Credit: Issues and Options," (Tax Policy Center Tax Notes, May 3, 2004; available at www.taxpolicycenter.org). 535 The explicit 50 percent credit is an implicit 100 percent match. For an example, consider a couple earning $30,000 who contributes $2,000 to a 401(k) plan. The Saver's Credit reduces that couple's federal income tax liability by $1,000 (50 percent of $2,000). The net result is a $2,000 account balance that costs the couple only $1,000 after taxes (the $2,000 contribution minus the $1,000 tax credit). This is the same result that would occur if the net after-tax contribution of $1,000 were matched at a 100 percent rate: the couple and the government each effectively contribute $1,000 to the account. While taxpayers should respond the same to equivalent implicit and explicit matches, empirical research provides evidence to the contrary. For a detailed discussion, see Esther Duflo, William Gale, Jeffrey Liebman, Peter Orszag, and Emmanuel Saez, "Saving Incentives for Low- and Middle-Income Families: Evidence from a Field Experiment with H&R Block," Quarterly Journal of Economics, Volume 121, Issue 4, 2006. 56 For a detailed discussion of this issue, see Zoë Neuberger, Robert Greenstein, and Eileen P. Sweeney, "Protecting Low-Income Families' Retirement Savings: How Retirement Accounts Are Treated in Means-Tested Programs and Steps to Remove Barriers to Retirement Saving," (Retirement Security Project Policy Brief No. 2005-6, June 2005; available at www.retirementsecurityproject.org). 57 In fiscal year 2004, individual income tax refunds amounted to $228 billion and went to 106 million out of a total of 131 million individual income tax returns (IRS Databook FY 2004, publication 55b, tables 1,2,8,9). 58 Hersh M. Shefrin and Richard H. Thaler, “Mental Accounting, Saving, and Self-Control,” in Choice Over Time, edited by G. Lowenstein and J. Elster (New York City: Sage Foundation, 1992). 59 Steven Venti and David Wise, “Aging and Housing Equity: Another Look,” National Bureau of Economic Research Working Paper No. 8606 (November, 2001). 60 Although the market for reverse mortgages has grown rapidly over the last few years, it still remains quite small. Davidoff and Welke (2005) estimate that less than one percent of eligible homeowners purchase reverse mortgages, even though there are a large number of older homeowners who are housing-rich and income-poor (Thomas Davidoff and Gerd Welke, “Selection and Moral Hazard in the Reverse Mortgage Market,” Haas School of Business, University of California Berkeley working paper, October, 2005). There is mixed evidence of adverse selection and moral hazard in the market. Potentially, the presence of Medicaid may undermine demand. Andrew Caplin, “Turning Assets into Cash: Problems and Prospects in the Reverse Mortgage Industry,” in Innovations in Retirement Financing, edited by Olivia S. Mitchell, Zvi Bodie, P. Brett Hammond, and Stephen Zeldes. (University of Pennsylvania Press, 2000) chapter 11. 61 David S. Johnson and Timothy M. Smeeding, “Who are the Poor Elderly? An Examination Using Alternative Poverty Measures,” Unpublished manuscript, 2000. The Census Bureau also calculates an adjusted poverty rate by age and finds that, in 2005, overall elderly poverty would have risen from 10.2 percent to 16.4 percent if MOOP spending were deducted from family income (Census Bureau, Poverty Measurement Studies and Alternative Measures, 2007). 62 Berhanu Alemayehu and Kenneth E. Warner, “The Lifetime Distribution of Health Care Costs,” Health Services Research, Vol. 39, Issue 3, pp. 627-642, 2004. 63 Craig Caplan and Normandy Brangan, “Out-of-Pocket Spending on Health Care by Medicare Beneficiaries Age 65 and Older in 2003,” AARP Research Report, 2004, available at www.aarp.org. 64 Peter Kemper and Christopher Murtaugh, “Lifetime Use of Nursing Home Care,” New England Journal of Medicine, Vol. 324, pp. 595-600, 1991. 65 Unmarried women include never married, divorced, and widows. William D. Spector, John A. Fleishman, Liliana E. Pezzin, Brenda C. Spillman, “The Characteristics of Long-Term Care Users”, AHRQ Research Report. AHRQ Publication No. 00-0049, 2001, available at www.ahrq.gov. 66 The average cost for a private room was $75,000 annually, while an average semi-private room cost $67,000 (“The Metlife Market Survey of Nursing Home & Home Care Costs”, MetLife Mature Market Institute, 2006, available at www.metlife.com). Length of stay data are from the 1997 National Nursing Home Survey (National Center for Health Statistics, 1997, available at www.cdc.gov/nchs). 67 Among full-year residents in 1996, Medicaid financed 58 percent of expenses and 33 percent was paid out of pocket (total expenses for this group amounted to $36,368). Medical Expenditure Panel Survey Research Findings #13: Expenses and Sources of Payment for Nursing Home Residents, 1996, available at www.meps.ahrq.gov. 68 Individuals ages 70 and older are observed between 1993 and 2002 and median wealth for unmarried and married women are measured in 1993. During the same period, real median wealth increased by 19.7 percent for individuals who did not receive nursing home care. See Richard W. Johnson, Gordon B.T. Mermin, and Cori E. Uccello, “When the Nest Egg Cracks: Financial Consequences of Health Problems, Marital Status Changes, and Job Layoffs at Older Ages,” Urban Institute, 2006, available at www.urban.org. 69 The statutory asset limits for eligibility are $2,000 for a single individual and $3,000 for a couple. At these levels, individuals must virtually deplete their resources before they can qualify for Medicaid nursing home assistance. Some states have exceptions that disregard certain assets (such as, assets used to purchase an irrevocable Medicaid annuity) and these exceptions raise the effective asset limits. Although the effective asset limits are substantially higher in a small number of states, even with the exceptions, the effective asset limits are still relatively low for the majority of states. 70 Evidence suggests that more risk-averse individuals or individuals who are at greater risk of needing nursing home care are more likely to buy LTC insurance. See Amy Finkelstein and Kathleen McGarry, “Multiple dimensions of private information: evidence from the long-term care insurance market,” American Economic Review, Vol. 96 No. 4, pp. 938-958, 2006. 71 Jeffrey Brown and Amy Finkelstein, “Why is the Market for Long-Term Care Insurance so Small?,” Massachusetts Institute of TechnologyWorking Paper (February 2007). - See more at: http://www.pewhealth.org/reports-analysis/reports/retirement-security-for-women-85899368779/5#sthash.eWRx9EW3.dpuf


ADDITIONAL RESOURCES

Fact Sheet

Article