Pew Poll Shows Philadelphians Feeling Good About Their City
Residents proud to have hosted big events, approving of new mayor
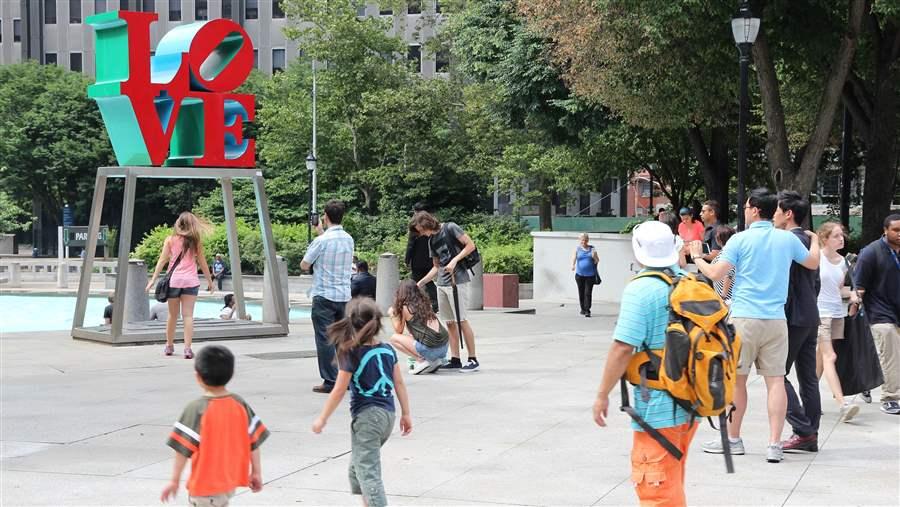
© Shutterstock
A new poll from The Pew Charitable Trusts shows Philadelphians with a generally upbeat outlook about their city—happy to have hosted major events in the past year, pleased with their new mayor, and accepting of a new tax imposed by city leaders.
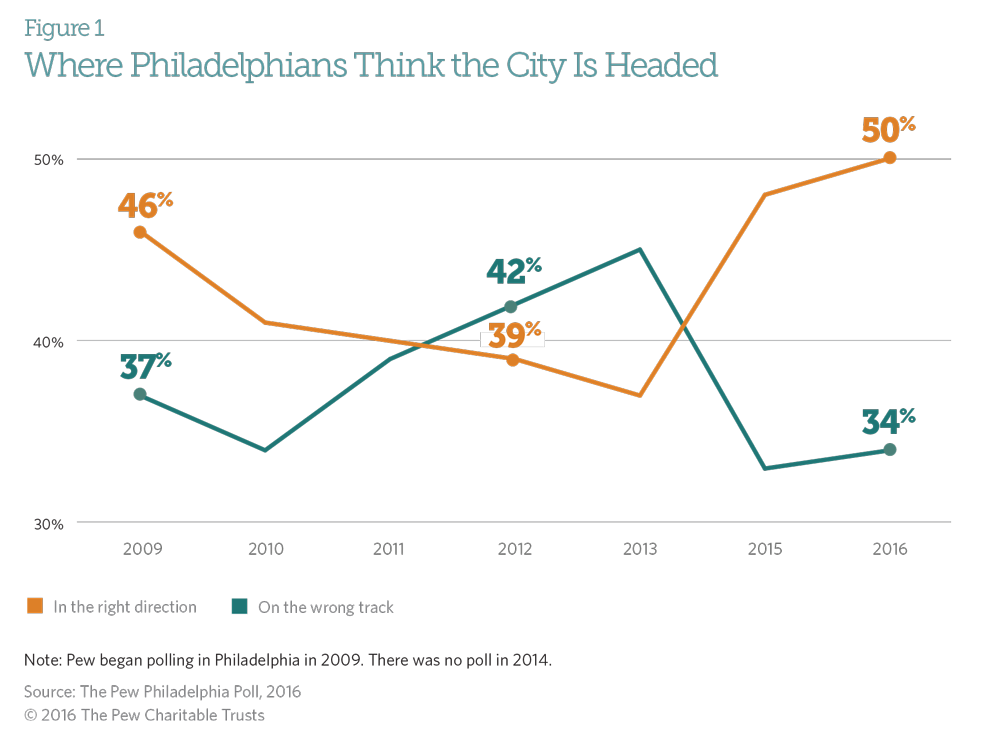
In the August 2016 survey, which covered a wide range of topics, half of those questioned said they see Philadelphia heading in the right direction, while only a third said it is on the wrong track. The results are among the most positive registered in the seven polls Pew has conducted in the city since 2009.
By more than a 3-1 ratio, Philadelphians said that hosting Pope Francis in September 2015 and the Democratic National Convention in July made them feel proud of their city. They also voiced enthusiasm about the prospect of the city seeking to attract similar events in the future.
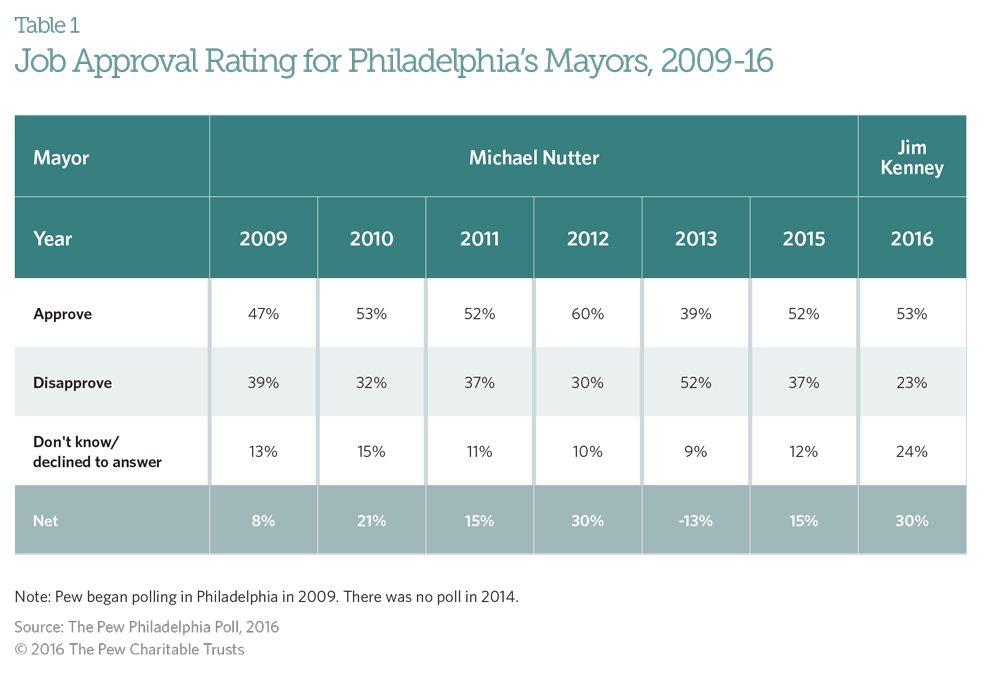
The job approval rate for Mayor Jim Kenney, who took office in January, stands at 53 percent, with 23 percent disapproving. That 30-point gap between approval and disapproval matches the biggest recorded during the administration of Kenney’s predecessor, Michael Nutter.
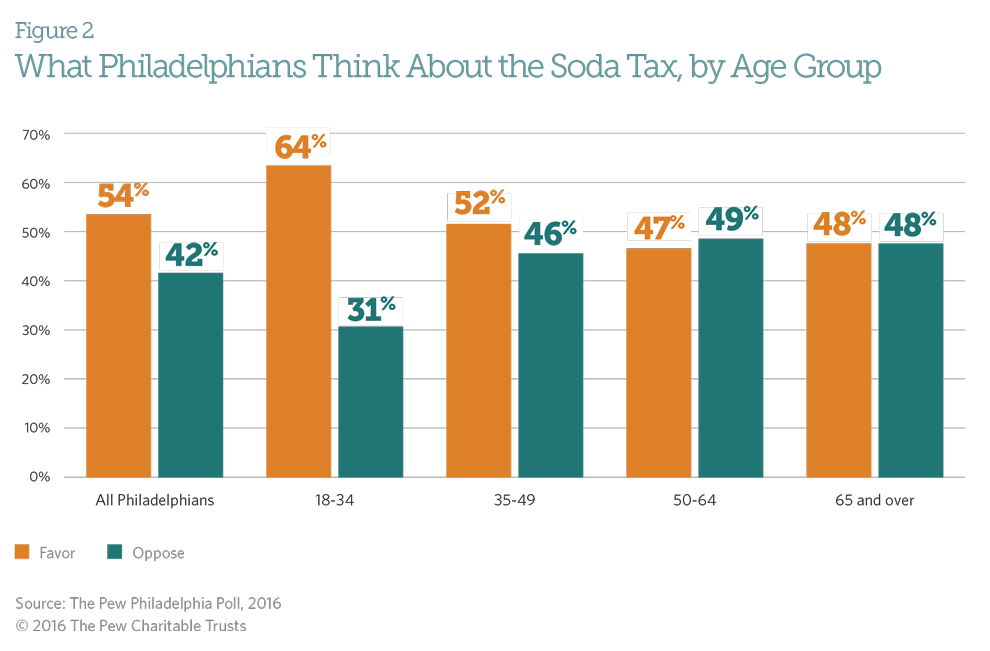
By 54 percent to 42 percent, residents also endorsed City Council’s decision in June to impose a new tax of 1.5 cents per ounce on sugar-sweetened and diet beverages, in part to fund early childhood education. Philadelphia is the first major U.S. city to enact such a tax, which has yet to take effect.
The poll also revealed at least one element of potential concern. Only 48 percent of young adults, a key element in the city’s recent population increase, see themselves likely to build their futures in Philadelphia, down from 59 percent in 2015.
The direction of the city
Over the past seven years, Pew has regularly asked Philadelphians whether they think their community is headed in the right direction or on the wrong track. In the new survey, 50 percent of residents chose “right direction,” while 34 percent opted for “wrong track.” The gap between the two figures, 16 percentage points, is as large as the poll has ever recorded. (See Figure 1.) While the results are little changed from 2015, they are quite different from those in 2012 and 2013, when “wrong track” answers prevailed.
Among the groups that opted most heavily for “right direction” were non-Hispanic whites, people 65 and older, college graduates, Center City residents, people with household incomes over $100,000, and those who have lived in Philadelphia 10 years or less. Most prone to see the city on the wrong track were Hispanics, African-Americans, residents of Northeast Philadelphia, and individuals living below the poverty line.
Hosting big events
Philadelphia hosted Pope Francis in September 2015 and the Democratic National Convention in July 2016. Both events generated mostly positive publicity for the city and varying degrees of inconvenience for some residents.
In the survey, 72 percent of respondents said the two events made them feel “proud” of their city and 21 percent said they did not. Seventy-three percent said the city should seek to host more big events, while 22 percent said that doing so was “not worth the trouble.”
Attitudes toward leaders and institutions
Fifty-three percent of Philadelphians said they approve of the job performance of first-year mayor Jim Kenney, while 23 percent disapprove. The disapproval number is the lowest recorded in the seven-year history of the poll, and the undecided figure, 24 percent, is the highest, perhaps reflecting Kenney’s brief tenure in office. (See Table 1.) Pew did not poll in 2008, the first year of Michael Nutter’s term.
Kenney’s approval ratings show little variation by racial or ethnic group. He has the support of 53 percent of non-Hispanic whites, 54 percent of blacks, and 58 percent of Hispanics. Geographically, his lowest approval ratings came in the River Wards and Northeast Philadelphia, while he won his most positive reviews from residents of North Philadelphia, West Philadelphia, and Center City.
As for City Council, which welcomed five new members in 2016, 44 percent of residents approve of its job performance and 37 percent disapprove. That rating is better than in most previous Pew polls.
There has been a slight improvement in the perception of the Philadelphia public schools. Twenty-two percent of residents rate the schools excellent or good, while 73 percent graded them only fair or poor. In 2015, 19 percent rated the schools excellent or good.
The tax on soda and other drinks
In June 2016, after a heated and highly public debate, Philadelphia became the first major U.S. city to adopt a tax on sugar-sweetened and diet beverages. The 1.5-cent-per-ounce levy was designed to help fund early childhood education and several other city programs.
By 54 percent to 42 percent, Philadelphians support the tax, which takes effect in January 2017. Opinions varied widely by age. People ages 18-34 endorse the tax by a 2-1 ratio, while those age 50 and over are evenly split on the issue. (See Figure 2.)
Views on this topic are not lightly held. Three-quarters of those in favor of the tax say they “strongly favor” the idea, and four-fifths of those on the other side “strongly oppose” it.
Planning a future in Philadelphia
Since the summer of 2013, Pew has asked 18-to-34-year-olds whether they expected to still be living in Philadelphia five to 10 years in the future. The influx of young adults has been a central element in the city’s recent population increase, and leaders have expressed concern about how many of them will stay and for how long.
In 2013, 50 percent of respondents in that age group said they would “probably” or “definitely” be staying. In 2015, the figure rose to 59 percent. In the current poll, it dropped back to 48 percent. (See Figure 3.)
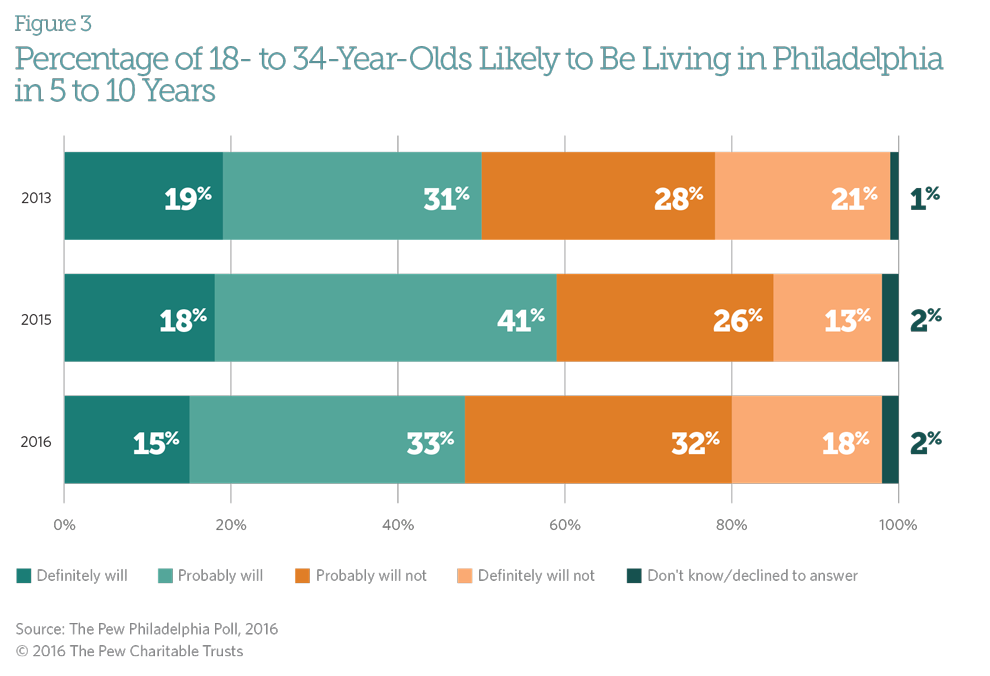
Those who said they would or might leave gave a wide variety of reasons, starting with job and career concerns, at 23 percent; education and child rearing, at 21 percent; and public safety, at 18 percent. These were followed by family issues and preference for a suburban lifestyle, at 10 percent each.
Methodology
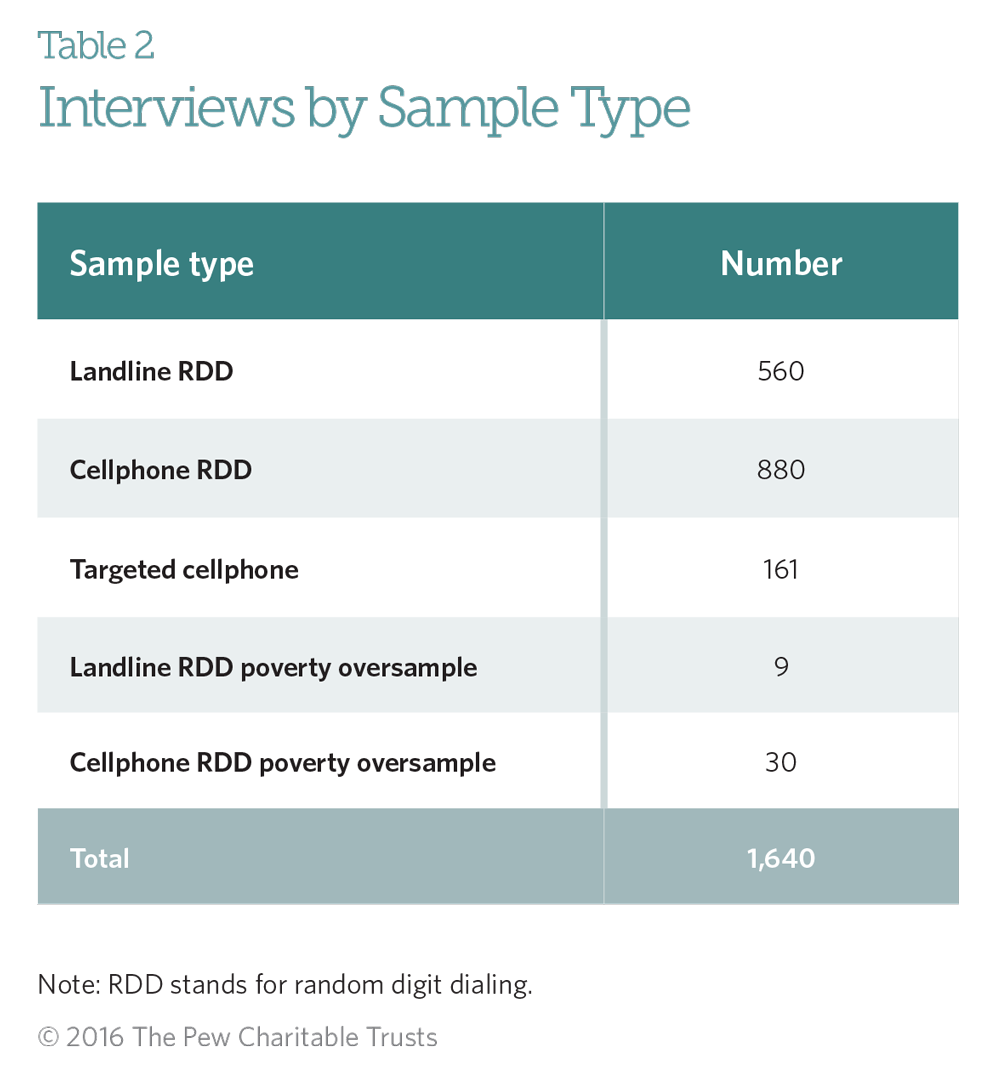
The 2016 Pew Philadelphia Poll was designed by Cliff Zukin, a veteran pollster and professor of public policy and political science at Rutgers University, and fielded by Abt SRBI. Telephone interviews were conducted with a representative sample of 1,601 adults living throughout Philadelphia (560 respondents were interviewed on a landline telephone and 1,041 were interviewed on a cellphone) and an oversample of 39 respondents at or below 100 percent of the federal poverty threshold (nine on a landline telephone and 30 on a cellphone). Interviews were conducted Aug. 3-19 in English and in Spanish. Respondents in the landline sample were selected by randomly asking for the youngest adult male or female who was home at the time. Interviews in the cell sample were conducted with the person who answered the phone, if that person was 18 or older.
Samples were drawn from landline and cellphone random digit dialing (RDD) frames as well as from a supplemental sample of Philadelphia residents who have out-of-area cellphone numbers. The combined sample was weighted to match demographic parameters from the American Community Survey of the U.S. Census Bureau—including gender, education, income, race, and ethnicity—and telephone status parameters from the National Health Interview Survey. The weighting procedure also accounts for the fact that respondents with both landlines and cellphones had a greater probability of selection.
The target population for the study was adults 18 and older living in the city of Philadelphia. The survey featured a dual-frame landline and cellphone RDD design containing a supplemental sample of Philadelphia residents with out-of-area cellphone numbers. Table 1 shows the distribution of completed interviews by sample type. The RDD samples were provided by Survey Sampling International LLC according to Abt SRBI specifications. Numbers for the landline RDD sample were drawn with equal probabilities from active blocks (area code + exchange + two-digit block number) in Philadelphia that contained one or more residential directory listings. The cellular sample was drawn by Survey Sampling International through a systematic sampling from 100‐blocks in Philadelphia County dedicated to cellular service according to the Telcordia database.
Sampling error is the expected probable difference between interviewing everyone in a population versus a random sample drawn from that population. Considering the sampling frame and design effect, the margin of sampling error for weighted estimates based on the full sample is ± 3 percentage points at a confidence interval of 95 percent. Sampling error is larger for population subgroups. Sample sizes and sampling errors for subgroups are available upon request. In addition to sampling error, one should bear in mind that question wording and practical difficulties in conducting surveys can introduce error or bias into the findings of opinion polls.
View the topline poll results.
About this analysis
This analysis was written by Larry Eichel, director of Pew’s Philadelphia research initiative. It was edited by Elizabeth Lowe, Daniel LeDuc, and Erika Compart.


ADDITIONAL RESOURCES

Article

Article


