State Employee Health Plan Spending
In September 2014, this report was updated to include revised data for Alabama, Florida, Illinois, Maine, Nevada, New Jersey, North Dakota, and Wisconsin, as well as affected national averages. Further, language was added to the report to clarify states’ total annual employee health plan expenditures. In 2013, states and their employees paid $30.7 billion to insure 2.7 million employee households. States paid $25.1 billion of this total.
This report provides a first-of-its kind analysis of the costs and characteristics of state employee health plans, and offers a nationwide benchmark against which states can be compared.
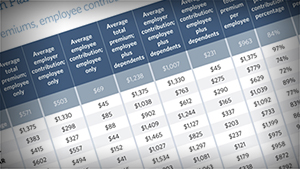
Collectively, states and their employees spent about $31 billion to insure 2.7 million employee households in 2013, a slight uptick in spending from 2011 and 2012 after adjusting for inflation. States paid $25 billion of this total. The average per-employee per-month premium for employees’ and dependents’ coverage was $959. States paid $805 (84 percent) of the total on average, and employees covered the remaining $154 (16 percent). However, this average masks sharp differences across the states, due to factors such as plan richness, average household size, provider price and physician practice patterns, as well as the age and health status of enrollees.
The report discusses each of these factors and finds that even after controlling for differences among states in average health plan richness and enrollee households size, a large range in premiums across the states remains. The report also reviews several policy approaches available to states to influence their costs.
Download the State Employee Health Plan Spending Report (PDF)
Frequently Asked Questions About the Report Methodology (PDF)
OVERVIEW
In 2012, $865 billion was spent in the United States to insure 169 million people through employer-sponsored health insurance, which represented 31 percent of all health care spending. Public and private employers contributed $630 billion, or 73 percent, toward this total; employees picked up the difference.1 Employer sponsored insurance is a vital element of the American health care landscape, and an important component of employee compensation. It helps provide people with access to affordable care, protects workers and their families from unaffordable medical costs, and serves as a critical funding source for virtually every medical institution.
The cost of health insurance has become a leading budget driver for employers of all sizes and in all sectors. From 1992 to 2012, the average cost of insuring each employee and dependent doubled, after adjusting for inflation.2 This increase has led many employers—including states—to review the benefits they provide, benchmark their offerings to comparable employers, and seek ways to control costs.
Health insurance costs have become a significant portion of states’ overall health care spending, second only to Medicaid.3 Nevertheless, little has been known about how states’ employee health plans and costs compare with one another and with those of large, private sector employers.
To provide policymakers and other stakeholders with information on state employee health care expenditures, as well as the factors underlying this spending, researchers from the State Health Care Spending Project—a collaboration between The Pew Charitable Trusts and the John D. and Catherine T. MacArthur Foundation—worked with actuaries from Milliman Inc. to produce a first-of-its kind analysis of the costs and characteristics of state employee health plans.^ Although meaningful state-to-state comparisons are complicated by a number of factors, including who is covered (i.e., the number, age, and health of enrollees) and differences in health plan benefit design, this analysis offers a nationwide benchmark against which states can be compared.
The project found that in 2013:*
- States and their employees spent $30.7 billion to insure 2.7 million employee households,† a slight uptick in spending from 2011 and 2012—the earliest years for which Milliman compiled data—after adjusting for inflation.‡ States paid $25.1 billion of this total.
- The average per-employee per-month premium for coverage of employees and dependents was $959. States paid $805 (84 percent) of the total, and employees covered the remaining $154 (16 percent). Employees paid an additional $70 per month, on average, in cost-sharing elements such as deductibles, copayments, and coinsurance.
- The average per-employee premium masks sharp differences across the states. Arkansas, Mississippi, New Mexico, South Carolina, and South Dakota, for example, had relatively low per-employee premiums, whereas the average per-employee premiums for Alaska, New Hampshire, New Jersey, Vermont, and Wisconsin were comparatively high.
- One factor underlying differences in per-employee premiums is variation in "plan richness," a commonly used term of art within the actuarial community. Richness reflects the relative cost sharing between a health plan and enrollees based on the required deductibles, copayments, and coinsurance. State health plans were generally "rich," paying on average§ 92 percent of the typical enrollees' health care costs. By way of context, these plans would be designated "platinum" plans within the new health insurance marketplaces.¶, 4
- Annual deductibles—the amount employees must pay for covered health care services before the health plan begins to pay—are a significant determinant of plan richness. A common cost-containment strategy among many private sector employers in recent years has been the introduction of high-deductible health plans, which result in lower premiums. States have been relatively slower to offer such plans, and in those where they were offered, relatively few employees chose to enroll in them. Nineteen states offered at least one plan with an annual deductible of $1,500 or more, up from 16 states in 2011. Among those 19 states, a median of 7 percent of state employees enrolled in them. Nationwide, only 5 percent of state employees enrolled in such a plan. Forty-eight percent were enrolled in plans with no deductible.
- Even after controlling for differences among states in average health plan richness and enrollee household size,a large range in premiums across the states remains. This suggests that other factors also have a substantial effect on premiums, such as variation in provider prices and physician practice patterns,** as well as age and health status of employees. Because of the range of variables that influence spending, higher spending is not necessarily an indication of waste, and lower spending is not necessarily a sign of efficiency.
How states manage their employee benefits—as well as other elements of their employee compensation package—affects their fiscal health; their ability to recruit and retain qualified staff to deliver critical public services; and their employees’ physical, mental, and financial well-being. In addition, as states try to reform the health care payment and delivery systems within their borders, how they structure the health insurance of their employees can serve as a model for other employers.
This report examines the project’s findings on state employee health care spending, explores the factors driving costs and states’ ability to influence these factors, and surveys a range of cost-containment strategies. These data and analysis offer important information as policymakers seek the best way to make their employee benefit systems effective, affordable, and sustainable.
FOOTNOTES AND ENDNOTES
Footnotes
- ^ Data for Pennsylvania were not available.
- * Most state plan years extend from either January to December or July to June.
- † This analysis includes every state employee health plan and excludes local government employees, even if they were in the plan (i.e., had the same benefit design and premiums). Milliman excluded school district employees on this basis, even in states that considered local school employees to be state employees, and it included only those public university employees who were in a primary state employee plan. These totals do not include Pennsylvania, as its data were not available.
- ‡ Data for fiscal years 2011 to 2012 were converted to 2013 dollars using the Implicit Price Deflator for Gross Domestic Product included in the Bureau of Economic Analysis’ National Income and Product Accounts.
- § Each state’s average actuarial value across plans was weighted by enrollment. This figure represents a nationwide numerical average.
- ¶ The Affordable Care Act created health insurance marketplaces that individuals and small businesses may use to shop for and compare health insurance plans. Plans in the marketplace are separated into four categories—bronze, silver, gold, or platinum—based on the percentage of an average enrollee’s overall costs for which the health plans pay. The percentages are roughly 60 percent, 70 percent, 80 percent, and 90 percent, respectively. A tax credit applied immediately upon enrollment offsets the cost of some enrollees’ premiums.Enrollees whose incomes are between 100 percent and 400 percent of the applicable federal poverty threshold may use advance premium tax credits.
- ** Variation in physician practice patterns refers to the differences in treatment approaches physicians take when treating patients with similar conditions. This variation commonly involves the frequency that tests and diagnostic imaging are ordered, how often patients are referred to specialists, physicians’ pharmaceutical prescribing patterns, and other treatment decisions.
Endnotes
- 1 U.S. Centers for Medicare & Medicaid Services, “National Health Expenditure Accounts, Sponsor Highlights,” Table 4, http://www.cms.gov/Research-Statistics-Data-and-Systems/Statistics-Trends-and-Reports/NationalHealthExpendData/NationalHealthAccountsHistorical.html.
- 2 Ibid.
- 3 The Pew Charitable Trusts, “State, Local Government Spending on Health Care Grew Faster Than National Rate in 2012” (January 2014), http://www.pewtrusts.org/en/research-and-analysis/reports/0001/01/01/state-local-government-spending-on-health-care-grew-faster-than-national-rate-in-2012.
- 4 U.S. Centers for Medicare & Medicaid Services, "Health Plan Categories," https://www.healthcare.gov/glossary/health-plan-categories.
$959
The average per-employee per-month premium for coverage of employees and dependents.
Learn More

ADDITIONAL RESOURCES

Video

Fact Sheet