What New Voting Data Mean
Q&A with Thom File from the U.S. Census Bureau
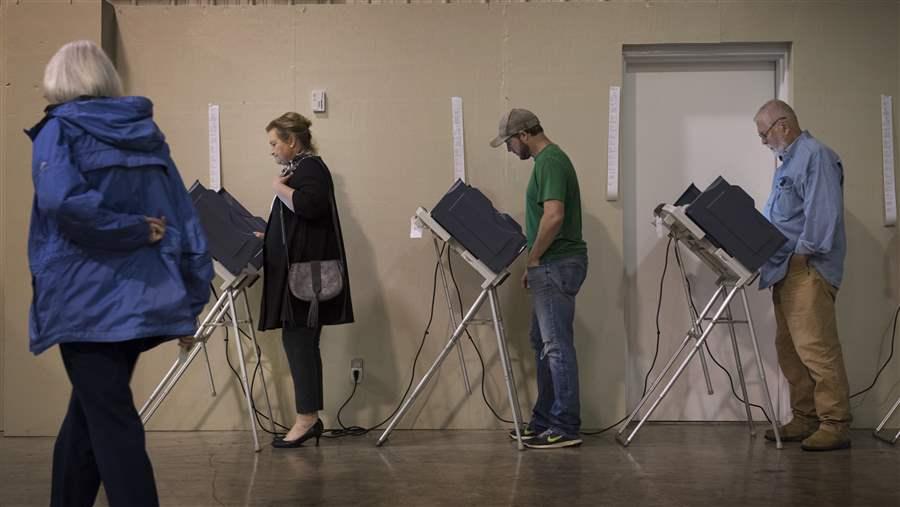
© Linda Davidson/The Washington Post/Getty Images
Last month, the U.S. Census Bureau released its biennial Voting and Registration Supplement in response to the November 2016 federal elections. These data have been compiled and analyzed every two years since 1964, and the new numbers offer insight into the voting behaviors of an expanding American electorate.
Understanding trends in voting rates and behaviors over time offers numerous practical benefits to state and local election administrators. For example, if citizens are reporting consistent reasons for not voting, election officials can adjust staffing to improve how elections are run as well as the voting experience. If more citizens are registering online rather than on paper, these data can help administrators justify investing in more efficient technologies or diverting resources to the most popular modes of registration and voting.
To learn more about what the new numbers mean, we talked with Thom File, senior sociologist with the U.S. Census Bureau and author of the Voting and Registration Supplement, for his input on the survey data.
Q: What were the key takeaways from this year’s data?
A: In most presidential elections since 1980, we have seen declines in the share of voters who are white, and increases in the share of voters who are black and Hispanic. In 2016, we see evidence that the 2008 and 2012 elections may have been exceptions to normal turnout patterns. Last November, the black voting rate actually decreased by about 7 percentage points, which is a rather dramatic drop-off. Meanwhile, turnout for non-Hispanic whites actually increased by about a percentage point, so the 2016 election definitely looked different from 2008 and 2012 in terms of race and turnout.
In general, older Americans vote at higher rates than younger Americans, and in 2016 this was again the case. The older the group the higher the voting rate, with the highest being about 71 percent for those 65 and older. However, even though young people reported the lowest overall turnout of any age group, 18- to 29-year-olds were the only group to see their turnout increase relative to 2012. Here, turnout increased by about a percentage point for this youngest age group, whereas older age groups had rates either slightly lower than or the same as in 2012.
In any given presidential election, the number of reported voters typically increases relative to the previous presidential election, largely as a product of increases in the size of the citizen voting-age population. Overall, in 2016, there were about 4.6 million more reported voters than in 2012. A majority of these additional voters (3.7 million) were 65 years and older, while a majority of these older voters (2.8 million) were non-Hispanic whites.
Q: What trends are expected to change, or continue, in the future?
A: We have recently been looking at how population projections will be reflected in the composition of the electorate in the years to come, and we hope to continue that work. As for our data collection, we are confronted by the fact that accurately measuring voter turnout in surveys is incredibly difficult, not only in the Current Population Survey (CPS) [the Census Bureau’s standard monthly surveys] but in all election studies. With that in mind, we are actively exploring ways to improve or enhance the supplement, with the main goal always being to measure the American electorate as timely and accurately as possible.
Q: What is the value of the data to elections administrators across the country?
A: The primary utility of the CPS voting numbers is that they allow for the exploration of turnout by a host of demographic, social, and economic characteristics, something researchers and administrators cannot do with official results alone. Across the elections studies discipline, we feel that we do this as well as anyone. I believe that an election administrator is always going to be best served by using whatever data they have access to. This can include not only the CPS numbers, but also official voting tallies, registered voter files, and exit polls.
Alexis Schuler is the senior director and Keara Castaldo is a senior associate for election initiatives at The Pew Charitable Trusts.
Follow us on Twitter using #electiondata and get the latest data dispatches, research, and news by subscribing today.
ADDITIONAL RESOURCES

Fact Sheet

Podcast