Retirement Plan Access and Participation Across Generations
How younger workers in the private sector differ from older colleagues

Overview
Americans do most of their saving for retirement at their jobs, though many private sector workers lack access to a workplace plan. In addition, many workers whose employers do offer these plans face obstacles to participation, such as more immediate financial needs, other savings priorities such as children’s education or a down payment for a house, or ineligibility. Thus, less than half of nongovernment workers in the United States participated in an employer-sponsored retirement plan in 2012, the most recent year for which detailed data were available.1
To help more people save for their later years, lawmakers in Congress and statehouses across the country have introduced retirement savings initiatives.2 More than 30 states have considered or passed legislation focused on this goal. Policymakers at all levels seek to increase retirement security, reduce poverty, and lessen reliance on federal and state social assistance. Many of these initiatives would help more workers save by taking regular contributions from their paychecks.
Many Americans have opportunities to save throughout their careers, but their actions tend to change as they age. Earlier research by The Pew Charitable Trusts looked at indicators of financial health by generation, such as overall wealth and how prepared each generation was for retirement.3 This chartbook examines data from the 2012 Census Bureau Survey of Income and Program Participation to look for differences among millennials, Generation Xers, and baby boomers in how many participate in employer-sponsored retirement plans. Then it explores some key reasons for those differences and notes similarities in access rates, participation rates, and reasons for not taking part.
Among the findings:
- Participation in retirement plans increases with age: Millennials have the lowest rates, and baby boomers the highest. Access to plans and the percentage that chooses to take part drive the participation rate.
- Access to plans also increases with age: As workers gain expertise and experience, they more often qualify for higher-paid jobs that are more likely to offer retirement benefits. Older workers also may be more likely than younger ones to stay in jobs long enough to become eligible for workplace plans.
- Takeup of retirement plans when offered increases with age, education, and income. Millennials were most likely to cite ineligibility as the reason for not participating. Gen Xers most frequently pointed to affordability. Baby boomers noted, about equally, problems with eligibility and affordability.
- Employer matches to employee contributions can be an important motivator for all age groups. When a match is offered, takeup rises by 15 to 15.5 percentage points in each generation.
The Generations
This chartbook defines the age groups this way:
- Millennials were born from 1981 through 1997. In this study, we included only millennials 22 and older—born through 1990—to focus the analysis on those who are likely to have finished their schooling.
- Gen Xers were born from 1965 through 1980.
- Baby boomers were born from 1946 through 1964.
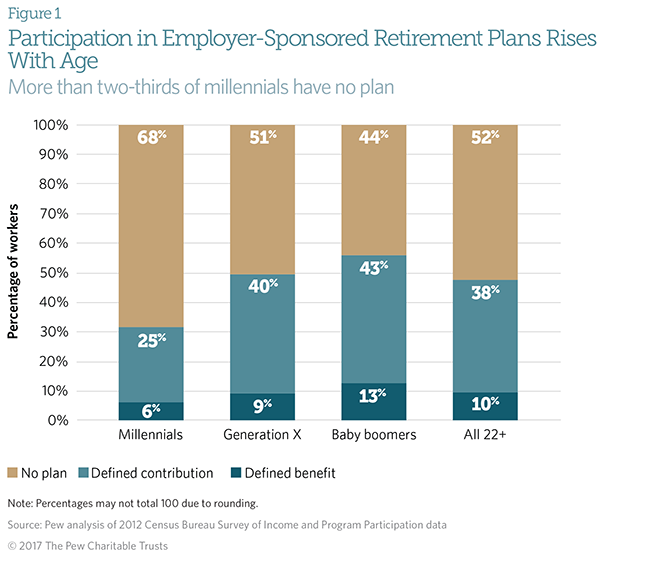
Participation rates rise with age. Older workers have greater access to retirement plans and higher takeup rates.
In 2012, 31 percent of millennials participated in an employer-sponsored program, whether a defined benefit plan such as a pension or a defined contribution plan such as a 401(k).4 About half of Gen Xers participated in a plan that year, while 56 percent of baby boomers took part in one. Though traditional pensions were once the more typical way to build retirement income, participation rates for defined benefit plans varied in a relatively narrow range, rising from 6 percent for millennials to 13 percent for boomers. Participation rates in defined contribution plans rose more dramatically by generation, from 25 percent for millennials to 40 percent for Gen Xers and 43 percent for boomers.5
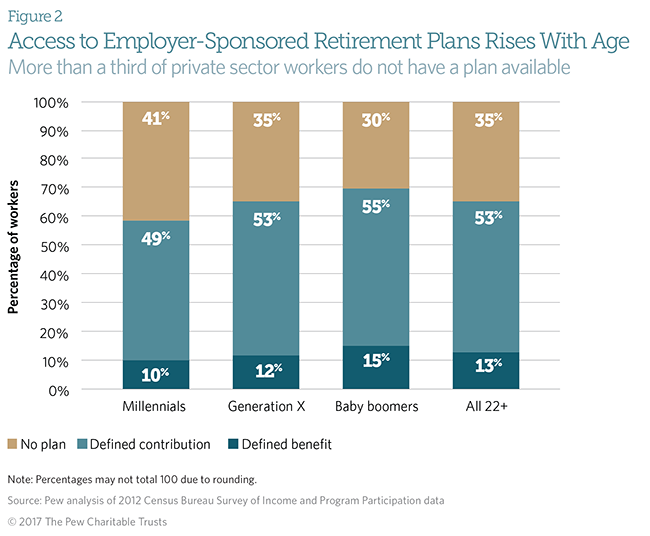
One important reason for low participation rates is lack of access. Thirty-five percent of private sector workers 22 and older do not work for an employer that offers a defined contribution plan or a traditional defined benefit plan.
Forty-one percent of millennials who are at least 22 have no access to either type of plan through their employers, compared with 35 percent of Gen Xers and 30 percent of baby boomers.6 Part of that can be attributed to the type of work. Millennials have faced challenges finding jobs that offer retirement and other benefits, while lower-wage jobs are less likely to come with retirement benefits.7 In early 2016, unemployment among recent college graduates stood at 5.6 percent, and underemployment— working fewer hours than desired—was at 12.6 percent.8 The share of young adults with degrees working in jobs that do not require one, another measure of underemployment, has risen over the past decade with more of these workers in lower-wage, lower-skilled jobs now than in 2000.9
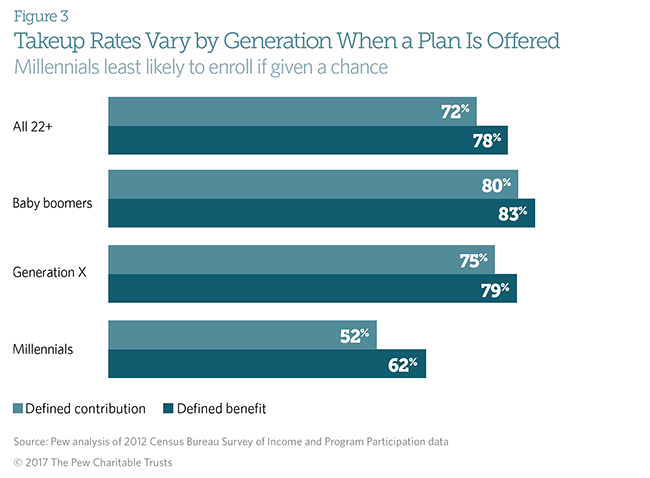
The takeup rates among workers of different generations also affect participation. When an employer offers a retirement plan, millennials are less likely than their older coworkers to participate. Fifty-two percent of these younger workers take up defined contribution plans when offered, compared with 75 percent of Gen Xers and 80 percent of baby boomers. Millennials are just starting out in their careers and are likely to earn less, as well as to have unsecured debt.10 They also may have other financial priorities, such as buying first homes, marrying, or starting families.
For every generation, takeup rates are higher for traditional defined benefit plans than for defined contribution plans when available. Sixty-two percent of millennials, 79 percent of Gen Xers, and 83 percent of baby boomers join a defined benefit plan when offered.11
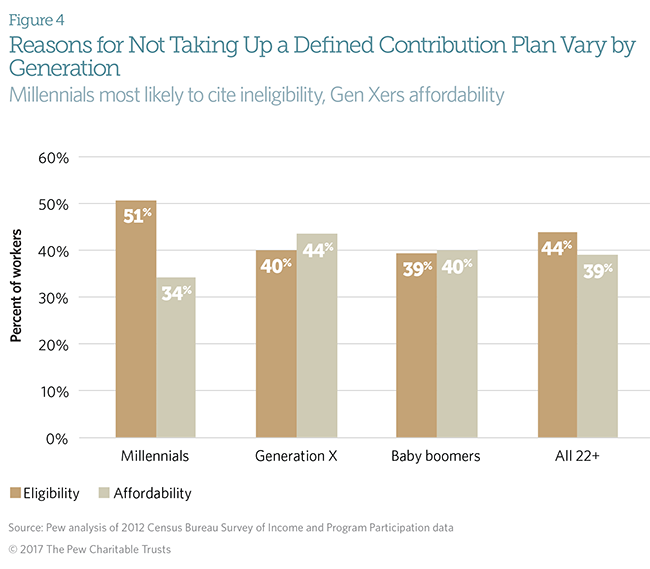
Among the factors that affect takeup rates are ineligibility, whether workers feel they can afford to save, and how high a priority building retirement savings is.
Even if an employer offers a retirement plan, certain workers still may not be eligible. Millennials, for example, are more likely than older employees to work too few hours, making them ineligible.12 Millennials also may not have been with their employers long enough to become eligible.13 Among millennials who had access to defined contribution plans but did not enroll, 51 percent gave ineligibility as the main reason, while 34 percent cited affordability.
For those in Generation X, affordability was most often cited as a reason for nonparticipation, followed closely by eligibility. For Gen Xers, the expenses of raising a family may crowd out saving. Baby boomers cited eligibility and affordability in roughly equal shares.
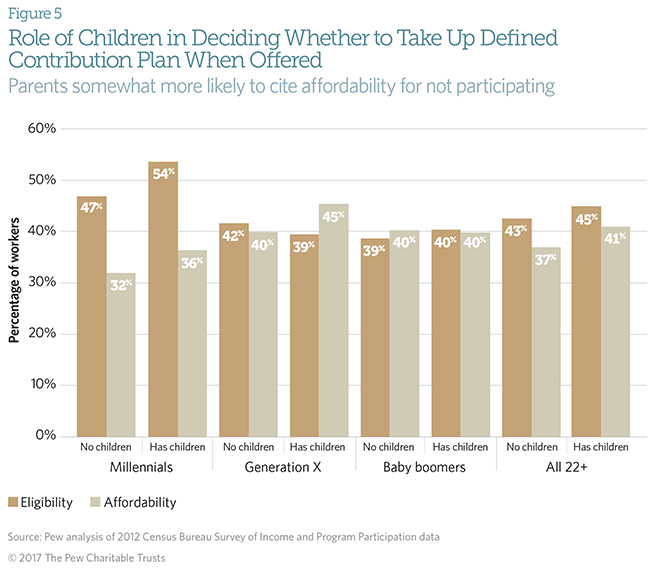
Parenthood may have offsetting effects on retirement saving. Having children may motivate workers to find jobs with benefits, including retirement plans. But raising children is expensive and may increase concerns about whether retirement savings are affordable.
Parenthood increases concerns about affordability among millennials and Gen Xers. Still, even for millennials with children, eligibility concerns trump affordability as a reason for not taking up a retirement plan.
Affordability is a more important reason than eligibility for Gen Xers with children. For baby boomers, there is little difference between those with and without children in citing affordability as a factor in participating in a defined contribution plan. That could be attributed to the ages of any children. The youngest boomers, born in 1964, were 48 in 2012 when the survey was conducted; for the older members of this generation, children may have already left home.
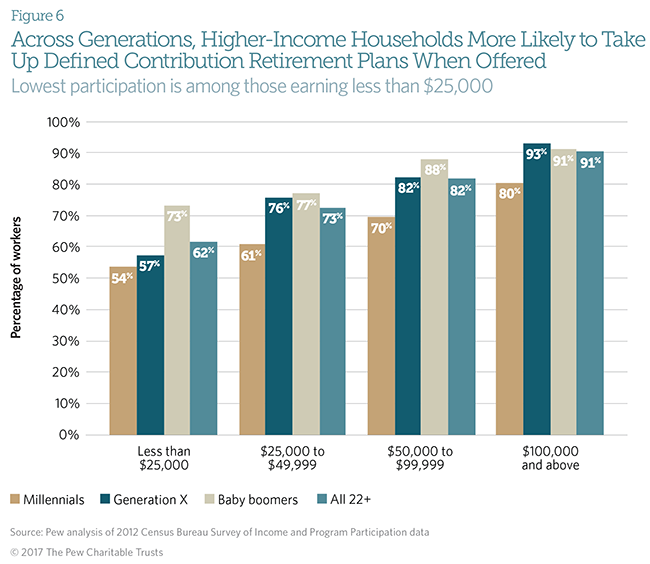
Examining the defined contribution takeup rate by household income sheds light on whether workers see the plan offered as affordable.
Takeup of defined contribution plans when offered and when workers meet eligibility requirements rises with household income and age. The one exception involves the highest earners. Among those with household incomes of $100,000 or more, baby boomers are slightly less likely than Gen Xers to join a retirement savings plan if offered.14
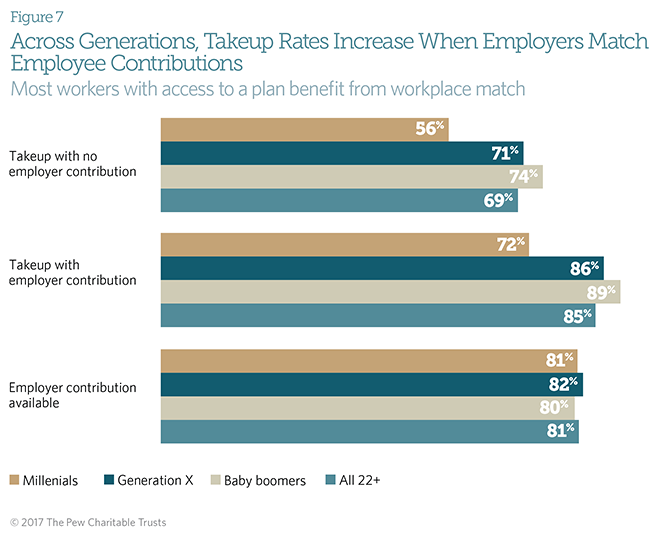
Employer contributions are an important motivator for workers to participate in plans. Many employers who offer defined contribution retirement plans make automatic contributions or match their workers’ saving. About 8 in 10 workers with access to a plan benefit from an employer contribution or match. This rate does not vary much across generations.15
When an employer contributes, about 85 percent of all workers 22 and older and eligible to participate join the plan, compared with 69 percent of workers who take up the plan when the employer does not contribute.16 Takeup rates rose 15 to 16 percentage points across generations when employers matched worker contributions.
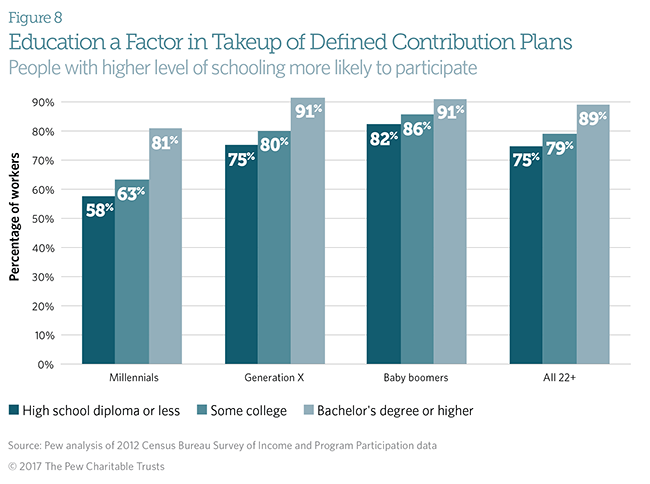
Having some college education or a college degree increases the likelihood that an eligible worker will participate in a workplace retirement plan. Education typically contributes to economic outcomes such as income and job quality, which can be defined in various ways but often includes elements such as health and retirement benefits.17 The level of schooling influences where an individual can find work as well as the type of industry and occupation.18 These factors, in turn, translate into differences in access and takeup rates.19
Education affects takeup rates through financial literacy, income, and affordability. In addition, many workers with less education may not have a basic understanding of how to prepare for retirement.20
Some 75 percent of eligible workers 22 or older with a high school diploma or less took up the plan when offered. By comparison, 89 percent of workers with a bachelor’s degree or higher joined a defined contribution plan if available.
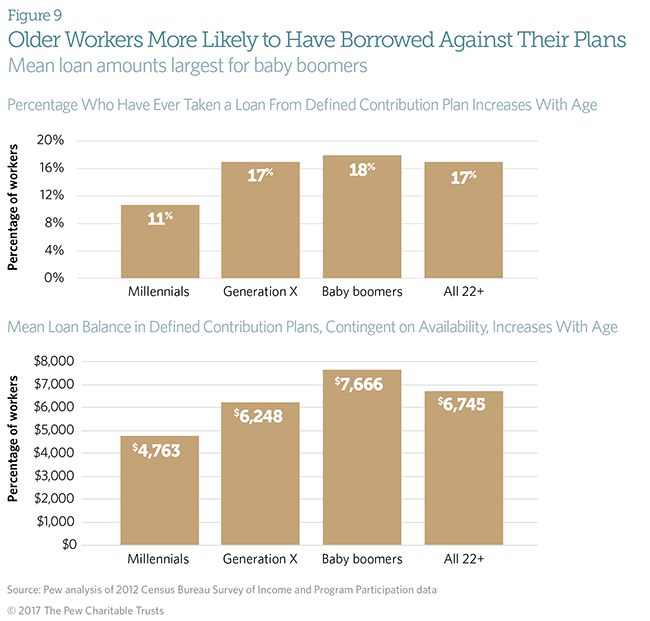
The availability of loans and other opportunities to withdraw savings before retirement may encourage some workers to participate in a workplace retirement plan. About 11 percent of millennials have taken loans from their defined contribution plans, compared with 17 percent of Gen Xers and 18 percent of baby boomers.21 The differences may simply reflect the length of time over which need arises.
Mean loan balances also increased with age: $4,763 for millennials, $6,248 for Gen Xers, and $7,666 for baby boomers. Boomers have the ability to take out larger loans, on average, because their account balances are greater than the other age groups’.
But taking out a loan means the worker will forgo returns on the borrowed money. This may affect younger workers more dramatically because of the impact on compound returns over longer accumulation.
Conclusion
Analysts and policymakers often talk about average participants, but averages often hide significant differences among elements of the population. A policy that helps the average worker may not help all workers. As federal and state legislators look at ways to increase retirement security for private sector workers, they will want to be aware of demographic differences in access and participation. Pew has examined some of these differences in earlier publications.22
The data show that younger workers are less likely than older workers to be offered retirement plans by their employers. And when they are, younger workers are less likely to take part. Millennials often cite a lack of eligibility as a reason for not taking up workplace retirement plans when they are offered. Many in this age group are new to the workforce or have recently changed jobs and may not meet employer requirements for participation. Gen Xers are more likely to cite affordability—balancing other claims on their paychecks—as a barrier to participating. Within each generation, higher household income and education increase the likelihood that a worker will take part in a retirement plan.
Methodology
This analysis relies on data from the 2008 Survey of Income and Program Participation, Wave II; the topical module focused on retirement savings plans was collected in 2012. Data were weighted using the Census Bureau Survey of Income and Program Participation’s person-level weights. The analysis includes private sector workers who are at least age 22 and are employed full time, part time, or seasonally. Agricultural, government, selfemployed, and armed forces workers were not included in the analysis.
Key Terms: Participation, Access, and Takeup
- Participation refers to the share of all employees actually taking part in employer-sponsored retirement plans; the population includes employees who were not offered a retirement plan.
- Access to a plan means an employee works for an employer that offers a plan, although the employee may or may not be eligible to participate.
- Takeup refers to the employee’s decision to participate in the employer’s plan if one is offered.
Endnotes
- The Pew Charitable Trusts, “Employer-Sponsored Retirement Plan Access, Uptake, and Savings” (September 2016), http://www.pewtrusts.org/en/research-and-analysis/issue-briefs/2016/09/employer-sponsored-retirement-plan-access-uptake-and-savings.
- In the 114th Congress, Senator Susan Collins (R-ME) introduced S. 266, the Retirement Security Act of 2014; Senator Sheldon Whitehouse (D-RI) introduced S. 245, the Automatic IRA Act of 2015; and Representative Richard Neal (D-MA) introduced the companion bill in the House, H.R. 506. Representative Joseph Crowley (D-NY) introduced H.R. 4491, the Making Your Retirement Accessible (MyRA) Act of 2016; H.R. 4045, USAccounts: Investing in America's Future Act of 2015; and H.R. 5731, the Secure, Accessible, Valuable, Efficient Universal Pension Accounts (SAVE UP) Act. In the 113th Congress, Senator Orrin Hatch (R-UT) introduced S. 1270, the Secure Annuities for Employee (SAFE) Retirement Act of 2013. For an up-to-date summary of state legislation, including bill numbers and legislative histories, see Pension Rights Center, State-Based Retirement Plans for the Private Sector, last modified May 2016, http://www.pensionrights.org/issues/legislation/state-based-retirement-plans-private-sector.
- The Pew Charitable Trusts, Retirement Security Across Generations: Are Americans Prepared for Their Golden Years? (May 2013), http://www.pewtrusts.org/~/media/legacy/uploadedfiles/pcs_assets/2013/ empretirementv4051013finalforwebpdf.pdf.
- Pew determined the defined benefit (DB) and defined contribution (DC) categories based on a number of characteristics surrounding respondents’ primary pension plan. As part of the survey, respondents were asked about plan type. “Plan based on earnings and years on the job” and “cash balance plan” were initially coded as DB plans, and “individual account plan” was coded as a DC plan. Additionally, plan type was coded as a DB plan if it was reported that participation in Social Security would affect the plan benefit. Plans were coded as DC plans if the primary plan allowed tax-deferred contributions as well as one of the following: employer’s contributions depended on the participant’s own contributions, the participant could choose how money was invested, or the participant could borrow from the plan. We additionally coded plan type as DC if the respondent said the plan was like a 401(k) or tax-deferred. Finally, respondents were asked further clarifying questions to determine that they did not actually have access to employer-sponsored plans. Because of these two lines of questions, takeup was determined based on whether respondents said they participated in the primary plan and their answers to the applicable follow-up questions. If answers to the primary and follow-up questions were inconsistent, we used answers to the primary questions.
- A chi square test of significance indicated significant differences in participation rates across generations at p < 0.001.
- A chi square test of significance indicated significant differences in access rates across generations at p < 0.001.
- About 32 percent of workers earning less than $25,000 have access to a retirement plan, compared with 75 percent of those earning $100,000 or more. See The Pew Charitable Trusts, Who’s In, Who’s Out (January 2016), http://www.pewtrusts.org/~/media/assets/2016/01/ retirement_savings_report_jan16.pdf.
- Teresa Kroeger, Tanyell Cooke, and Elise Gould, The Class of 2016: The Labor Market Is Still Far From Ideal for Young Graduates, Economic Policy Institute (April 21, 2016), http://www.epi.org/files/pdf/103124.pdf.
- Jaison R. Abel, Richard Deitz, and Yaqin Su, “Are Recent College Graduates Finding Good Jobs?” Current Issues in Economics and Finance 20, no. 1 (2014), https://www.newyorkfed.org/medialibrary/media/research/current_issues/ci20-1.pdf.
- Marina Vornovytskyy, Alfred Gottschalck, and Adam Smith, “Household Debt in the U.S.: 2000 to 2011,” Census Bureau, https://www.census.gov/people/wealth/files/Debt Highlights 2011.pdf. See also The Pew Charitable Trusts, The Complex Story of American Debt (2015), http://www.pewtrusts.org/~/media/assets/2015/07/reach-of-debt-report_artfinal.pdf.
- Chi square tests of significance indicated significant differences in takeup rates among generations of defined benefit and defined contribution plans at p < 0.001.
- Nineteen percent of millennials 22 and older reported working less than 35 hours a week, compared with 10 percent of Gen Xers and 11 percent of baby boomers, according to the authors’ analysis of 2012 Survey of Income and Program Participation data. Chi square tests found significant differences across generations at p < 0.001.
- Authors’ analysis of 2012 Survey of Income and Program Participation. Twenty-eight percent of millennials have been at their jobs for less than one year, and 46 percent of millennials 22 and older have been at their jobs less than two years.
- Chi square tests indicated significant differences across generations within each income category at p < 0.001.
- A chi square test showed that differences across generations in the availability of employer contributions to a defined contribution plan, contingent on the employer offering a plan, were not statistically significant at p = 0.2787.
- A chi square test on differences across generations in takeup rates for defined contribution plans, contingent on the employer contributing, was significant at p < 0.001.
- See Bureau of Labor Statistics, “Earnings and Unemployment Rates by Educational Attainment, 2015,” http://www.bls.gov/emp/ep_chart_001.htm; and Anthony P. Carnevale, Stephen J. Rose, and Ban Cheah, The College Payoff: Education, Occupations, Lifetime Earnings, Georgetown University Center on Education and the Workforce (2011), https://cew.georgetown.edu/cew-reports/the-college-payoff. Note that the differences in lifetime earnings may in part reflect the underlying capabilities and characteristics of those individuals obtaining additional formal education and cannot be wholly attributed to the degree itself.
- Bureau of Labor Statistics, “Educational Attainment for Workers 25 Years and Older by Detailed Occupation,” accessed Dec. 16, 2016, http://www.bls.gov/emp/ep_table_111.htm.
- Less-educated workers are far less likely to have access to employer-based retirement savings or pension plans. Among workers of all ages who had not graduated from high school or who had a high school or GED diploma, about 54 percent reported having access to a defined benefit or defined contribution plan. By contrast, many more of those with at least a bachelor’s degree—about 77 percent—had access to a workplace retirement plan, according to the authors’ analysis of 2012 Survey of Income and Program Participation data.
- Annamaria Lusardi and Olivia S. Mitchell, “Baby Boomer Retirement Security: The Roles of Planning, Financial Literacy, and Housing Wealth,” National Bureau of Economic Research (2009), http://www.nber.org/papers/w15350. See also Julie R. Agnew et al., “Do Financial Literacy and Mistrust Affect 401(k) Participation?” Center for Retirement Research at Boston College (2007), http://crr.bc.edu/wp-content/uploads/2007/11/IB_7-17.pdf.
- Chi square tests found significant differences across generations at p < 0.001.
- The Pew Charitable Trusts, Who’s In, Who’s Out. Forthcoming Pew publications will address differences in retirement plan participation by industry, gender, and race.


ADDITIONAL RESOURCES

Fact Sheet

Podcast


