Analytics Help Boost College Applications
Delaware initiatives use data to promote postsecondary education

This is the second in a series of briefs on how states are using data for decision-making.
© Maxim Chuvashov / Getty Images
Overview
How can states help ensure that students equipped to succeed in college actually enroll? Encouraged by the U.S. Department of Education’s Race to the Top (RTTT) grant program, which aimed to advance education reforms and prepare students to succeed in college, Delaware’s Department of Education (DOE) used data it had already collected to find an answer to that question.
In 2012, the Delaware DOE began rigorously analyzing its data, revealing that nearly 2 out of 10 students considered to be highly qualified for college—those who received combined mathematics, critical reading, and writing SAT scores equal to or higher than 1550 (on a scale of 2400)—were not pursuing a postsecondary education.1 This finding prompted a statewide campaign to educate students about how to apply for college and financial aid, accompanied by targeted outreach and support to facilitate enrollment.
“Delaware focused on providing students and families with deep, ongoing supports around college access and enhancing the state’s college-going culture,” said Michael Watson, chief academic officer for the Delaware DOE. “The data informed our strategy and gave us confidence. We not only knew that our efforts would be successful but that we were doing what was right for our students as well.”
2016 was the third consecutive year in which every graduating Delaware high school senior who was highly qualified for college applied to at least one postsecondary institution.2 Former Governor Jack Markell, who made college access efforts one of his priorities during his eight years in office, recognized the significance of this work, saying in his January 2016 State of the State address, “Education is the great equalizer, providing the ladder from poverty to opportunity.”3
Background
In 2009, the U.S. Department of Education implemented the RTTT grant program, which supported building data systems that measure student growth and success and preparing students to succeed in college and the workplace.4 As one of the first two states awarded a grant, Delaware received five years of funding starting in 2010.5
The department’s RTTT grant proposal set a goal of significantly increasing the state’s college enrollment rate by 2014.6 But the DOE first needed a better understanding of Delaware’s education system—particularly college readiness, which would require high-quality education data in addition to well-constructed analyses.
Moving forward
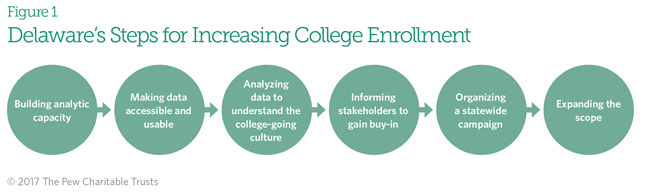
Building analytic capacity. Since 1994, the Delaware DOE has collected a substantial amount of longitudinal student data—the same type of information on the same person at different points in time—but lacked the analytic capacity to effectively use most of the information.7 That changed in 2011, when Delaware applied to join the Strategic Data Project (SDP) at Harvard University’s Center for Education Policy Research (CEPR). The project supported three fellows, including a data strategist, Atnre Alleyne, who would work specifically with Delaware’s educational data and generate a set of analyses that would highlight key information the DOE could use to achieve its goals.8
Making data accessible and usable. Once the analytic capacity had been secured, Delaware’s DOE could begin working with the data itself. Challenges with data accessibility emerged almost immediately, largely because of an ongoing transition from multiple old and disparate data systems to a longitudinal data warehouse capable of housing all student information in one place.9 As a result, the data system’s infrastructure did not allow for efficient or timely access, a factor that slowed the analytic work.10
To determine what data existed and how to access it, the SDP conducted interviews with “data owners,”— individuals responsible for managing education records—asking them about the format in which their information was stored, the history of the software, their impression of the data quality, and their plans for the information.11 Once the data was obtained, its poor quality was readily apparent, and it became clear that the information was not formatted in a way that lent itself to timely and accurate analysis.12 Stakeholders from the SDP estimated that at least 60 percent of their work consisted of cleaning the data to make it usable:13 an iterative process of pulling, cleaning, merging, and, finally, analyzing the data.14 The transition to the longitudinal data system reduced but did not eliminate the need for extensive manual data pulling and maintenance.15
Analyzing data to understand the college-going culture. After multiple modifications, the newly improved data on high school performance, high school graduation, college enrollment rates, and the percentage of students continuing college after the first year was analyzed to show students’ access to and success in college.16 The analysis provided insight into Delaware’s college-going culture: the environment, attitudes, and practices in schools and communities that encourage students and their families to obtain the information, tools, and perspective needed to enhance access to—and success in—postsecondary education. Delaware officials were surprised by the results, particularly that many students whose grades and SAT scores qualified them to go to college were not applying.17 This was especially true in schools with a high proportion of students from low-income families.18
Shana Payne, director of the Delaware DOE’s Higher Education Office, summarized the state’s reaction to these findings: “We knew we had a problem, but how to solve a problem that required a complete shift in thinking was difficult. We needed to change behavior. Ultimately, having the data to support this need became our biggest advantage.”19
Findings showed that:
- Only 30 percent of first-time ninth-grade students completed high school on time, seamlessly enrolled in college in the fall after graduation, and continued to their second university year.20
- 51 percent of recent Delaware high school graduates enrolled in college the following fall, compared with a national average of 68 percent of high school graduates.21
- 55 percent of highly qualified students from low-income families enrolled in a selective four-year college—one that is more difficult to get into—compared with 71 percent of highly qualified students statewide.22
- 18 percent of the state’s highly qualified students, and 27 percent of the state’s highly qualified low-income students, did not enroll in college.23
Informing stakeholders to gain buy-in. Equipped with analyses and their related findings, the Delaware DOE began working toward its RTTT goals, and, as Meg Nipson from the SDP explained, the state “went to town on the college-going initiative.”24 To create buy-in on the need to enroll more students in college and to show the potential success of such efforts, the DOE held a series of meetings with political and community-based stakeholders. These meetings served as a collaborative outlet for SDP, the fellows, and the DOE to present the findings to stakeholders for feedback on effective ways to illustrate the information and enact changes to address it.25 The meetings also helped leadership see how the use of data in decision-making could directly elevate student outcomes.26 This information cultivated a greater demand for data-driven decisions. Nipson described it as “a genie that can’t be put back in the bottle,” signaling a cultural shift in the DOE.27
“The moment we were able to show that our work had real impact on our students and the state—and that this impact was driven not by luck or a gut feeling but by sound, logical data—was the moment we were able to really move forward, ” said Watson. “Having extensive stakeholder buy-in provided us with additional resources and supports, and a number of influential advocates that furthered our mission of having all students engage in postsecondary education.”
Organizing a statewide campaign. Delaware has undertaken a variety of initiatives—collectively referred to as the Getting to Zero campaign—to encourage graduating high school students to apply to college and to provide them with the support they need to succeed in higher education or a career. The aim was to ensure that every qualified student applied to college. The campaign:
- Improved the ability of school counselors to assist families and students in applying for and receiving financial aid. Counselors received professional development opportunities to improve their knowledge of financial aid, particularly how to complete the Free Application for Federal Student Aid (FAFSA).
- Instituted a statewide FAFSA completion campaign with a state partner agency to ensure that students have access to workshops and one-on-one counseling for FAFSA completion.28
- Prompted then-Gov. Markell to proclaim October and November as College Application Months to encourage first-generation and low-income students (identified through the department’s analysis as less likely to apply to college) to submit a college application. The state’s DOE, in partnership with the University of Delaware, provides volunteers and technical assistance to support the application process.29 Payne identified College Application Months as the most helpful strategy of the Getting to Zero campaign.30
- Facilitated partnerships with the state and the College Board to hold celebrations that acknowledged students for their acceptance to college and also helped raise awareness among younger students about the importance of postsecondary education. Celebrations included school assemblies and displays exhibiting the colleges that students will attend.31
After these early initiatives, the DOE’s Higher Education Office, the University of Delaware, and the CEPR (the SDP’s parent research center) collaborated to develop a texting campaign for students and their parents to provide real-time access to college information. Under this campaign, families receive tips on the college application and enrollment process and can text questions and receive real-time answers from Payne and her team at the Higher Education Office and the University of Delaware’s Institute for Public Administration.32 Semimonthly texts are sent to high school seniors on the subjects of FAFSA completion, access to additional financial aid sources, and tips on how to prepare for college. Younger students can receive monthly texts with suggestions on how to prepare for their postsecondary education.33 According to Payne, districts and schools supported the Getting to Zero campaign and joined the department in prioritizing this issue.34
These changes were part of a broader college access effort that included offering the PSAT and SAT for free during the school day, expansion of dual-enrollment and Advanced Placement offerings in high school, a new senior math course to reduce college remediation, and a summer residency program to support would-be first-generation college students.
For the Class of 2015, 100 percent of the 1,466 highly qualified seniors applied to college or other postsecondary education programs through the Getting to Zero campaign.35 For the Class of 2014, the first year of Getting to Zero and the only year with available college enrollment data, all highly qualified seniors applied and 98 percent subsequently enrolled in college.36
Expanding the scope. Before 2016, Getting to Zero focused on students receiving a 1550 or higher on the SAT. Based on feedback from schools and districts, the DOE expanded its definition of highly qualified to include students who score a 3 on Smarter English language arts or Smarter math—assessments that measure students’ mastery of the Common Core State Standards—a 3 or higher on an AP exam, or a C or better in a dual-enrollment class. Consequently, the Delaware DOE reported that 100 percent of the Class of 2016’s 1,887 highly qualified seniors applied to college or other postsecondary education programs.
Key strategies
Leveraging partnerships. Delaware didn’t have the internal capacity to undertake the necessary data analysis, so it formed close working relationships with the SDP, which conducted the analytic work. Strategist Alleyne worked with a wide variety of staff throughout Delaware’s DOE. This diverse engagement helped to familiarize him with the language used between the data silos and provided him with a more comprehensive understanding of where communication breakdowns occurred.37
Developing actionable data. The DOE presented reports each month to school and district leadership that showed aggregate student completion rates for college applications and the FAFSA, as well as data on postsecondary decisions. This created informal accountability so that schools could monitor the program’s effectiveness and continue to build buy-in from counselors, principals, and district leaders as they saw students achieving their targets. Reports were also integrated with the student information system to enable schools to access the data in real time and target students for follow-up.
Involving political leadership. The agency’s leadership saw great value in improving data access and was supported in this work by then-Gov. Markell.38 The SDP’s Nipson noted that the presence of influential community stakeholders at meetings encouraged political leadership to “speak truth to power.”39 This multi-perspective stakeholder collaboration was significant in moving the state’s college-going culture forward.40
Delaware’s small size has helped the department to quickly convene stakeholders and collaborate with them.41 Leaders of community-based organizations and the DOE have greater opportunity to directly communicate than do their counterparts in larger states. This allowed community-based organizations to offer their expertise and have a more influential role in decision-making.42
Providing college-focused counseling. To promote the use of data at the school level, Delaware updated its counseling support by adapting the latest American School Counselor Association model, which utilizes a framework for a comprehensive, data-driven approach to school counseling.43 School counselors were trained to incorporate data into their annual plans to promote college and career readiness by identifying supports that would be most effective for students based on their individual needs.44 They are encouraged to use program data to understand the impact the services have on students and to identify which services students will receive in the future.45
Conclusion
By implementing data-driven strategies to address educational concerns, Delaware identified a variety of factors to be considered to produce the most relevant and effective approaches:
- What is the problem that needs to be addressed?
- Is there available capacity to work with data systems, conduct analyses, and effectively communicate results to a variety of stakeholders?
- Who will lead mobilization efforts to identify and implement solutions?
- Which stakeholders should be involved, and how?
- How will this work be evaluated, and how will improvements be identified?
By using data to increase understanding of its college-going culture, Delaware was able to identify specific problem areas where the state could focus its work to improve the college enrollment rate. Through partnerships and political support, the DOE gathered the necessary education data to produce the appropriate analyses and create a comprehensive overview of its college-going culture. The state developed initiatives to specifically target groups of students who were academically prepared but more likely to encounter challenges in accessing postsecondary education, and to help them find a path to college.
Endnotes
- Strategic Data Project, “SDP: College-Going Diagnostic” (July 2014), http://cepr.harvard.edu/files/cepr/files/sdp-de-cg.pdf?m=1430516420.
- Shana Payne, Delaware Department of Education’s Higher Education Office, pers. comm., Dec. 5, 2016.
- Delaware Governor Jack Markell, State of the State message, “January 21, 2016: Expecting More,” http://governor.delaware.gov/speeches/2016StateOfTheState.
- U.S. Department of Education, “Race to the Top Program: Executive Summary” (November 2009), http://www2.ed.gov/programs/racetothetop/executive-summary.pdf.
- U.S. Department of Education, “Race to the Top: Delaware Executive Summary,” accessed Dec. 8, 2016, https://www2.ed.gov/programs/racetothetop/state-reported-sharing/deexsumm.pdf.
- U.S. Department of Education, “Race to the Top: Application for Initial Funding” (January 2010), https://www2.ed.gov/programs/racetothetop/phase1-applications/delaware.pdf.
- Ibid.
- The Pew Charitable Trusts, interview with Miriam Greenberg and Meg Nipson, Strategic Data Project, Center for Education Policy Research at Harvard University, March 16, 2016.
- Ibid.
- Strategic Data Project, “Changing the Culture of Data Use in Delaware: How State Leaders Used Analytics to Create Education Policies That Matter” (March 2014), http://sdp.cepr.harvard.edu/files/cepr-sdp/files/sdp-case-study-dedoe.pdf?m=1432061682.
- Greenberg and Nipson interview.
- Strategic Data Project, “Changing the Culture.”
- Greenberg and Nipson interview.
- Ibid.
- Ibid.
- Strategic Data Project, “SDP: College-Going Diagnostic,” http://sdp.cepr.harvard.edu/college-going.
- The Pew Charitable Trusts, interview with Atnre Alleyne, Strategic Data Project, March 9, 2016; The Pew Charitable Trusts, interview with Shana Payne, Delaware Department of Education’s Higher Education Office, March 31, 2016; The Pew Charitable Trusts, interview with Christopher Ruszkowski and Michael Watson, Delaware Department of Education, March 11, 2016.
- Greenberg and Nipson interview; Alleyne interview; Ruszkowski and Watson interview.
- Strategic Data Project, “SDP: College-Going Diagnostic.”
- Ibid.
- Ibid.
- Ibid.
- Payne interview.
- Greenberg and Nipson interview.
- Greenberg and Nipson interview; Alleyne interview; Ruszkowski and Watson interview.
- Greenberg and Nipson interview.
- Greenberg and Nipson interview; Alleyne interview; Ruszkowski and Watson interview.
- Delaware Goes to College, “About: Our Strategy,” http://delawaregoestocollege.org/strategies.
- Ibid.
- Payne interview.
- Delaware Goes to College, “About: Our Strategy.”
- Delaware Goes to College, “Family Resources: Texting Campaign,” http://delawaregoestocollege.org/texting-campaign; Payne interview.
- Delaware Goes to College, “Family Resources: Texting Campaign.”
- Payne interview.
- Delaware Department of Education, “Every College-Ready Student in Delaware’s 2015 Graduating Class Applies for Postsecondary Learning Opportunities,” accessed Dec. 8, 2016, http://www.doe.k12.de.us/site/Default.aspx?PageType=3&DomainID=4&PageID=1&Vie wID=047e6be3-6d87-4130-8424-d8e4e9ed6c2a&FlexDataID=13748.
- Delaware Department of Education, “Every College-Ready Student.”
- Ruszkowski and Watson interview.
- The Pew Charitable Trusts, interview with Antoniya Owens, the Boston Foundation, May 26, 2016; Alleyne interview; Ruszkowski and Watson interview; Greenberg and Nipson interview.
- Greenberg and Nipson interview.
- Ibid.
- U.S. Department of Education, “Race to the Top: Application for Initial Funding”; Greenberg and Nipson interview.
- Greenberg and Nipson interview.
- Payne interview; American School Counselor Association, “ASCA National Model,” https://www.schoolcounselor.org/school-counselors-members/asca-national-model.
- American School Counselor Association, “ASCA National Model: A Framework for School Counseling Programs” (2012), http://schoolcounselor.org/Ascanationalmodel/media/ANM-templates/ANMExecSumm.pdf.
- Payne interview; American School Counselor Association, “ASCA National Model: A Framework.”
ADDITIONAL RESOURCES

Fact Sheet

Podcast


