Employer-Sponsored Retirement Plan Access, Uptake and Savings
Workers report barriers and opportunities
 © Ricardo Reitmeyer/Shutterstock
Merely participating in a workplace defined contribution plan doesn’t guarantee retirement security; the amount contributed matters greatly, and most Americans have not saved enough.
Overview
Most Americans will rely, in part, on personal savings during retirement. However, many households face substantial challenges in building their retirement nest egg. U.S. workers accumulate most of their retirement savings through their jobs, but more than one-third of full-time employees lack access to a workplace retirement plan. Even for workers who have access to a plan, obstacles—such as their debt, other savings priorities like children’s college funds or a house down payment, immediate financial needs, or a lack of confidence in their ability to choose investments wisely—can discourage participation.1 And among those who participate, savings are generally modest.
Many states and the federal government are looking at ways to increase retirement savings. The aim is to reduce poverty and the need for social assistance—spending that strains state budgets. Some of these efforts are already underway, including President Barack Obama’s myRA initiative, Washington state’s marketplace exchange, and Illinois’ Secure Choice program.2
This chartbook examines data from the U.S. Census Survey of Income and Program Participation. In this analysis, “workers” refers to 18- to 64-year-old private sector full-time and part-time employees who were not self-employed, agricultural workers, or in the armed forces at the time of the survey.
Among the key findings:
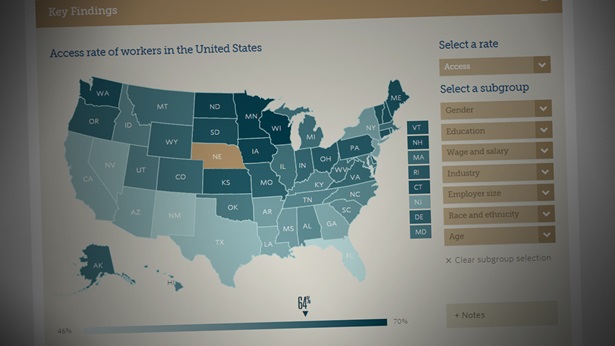
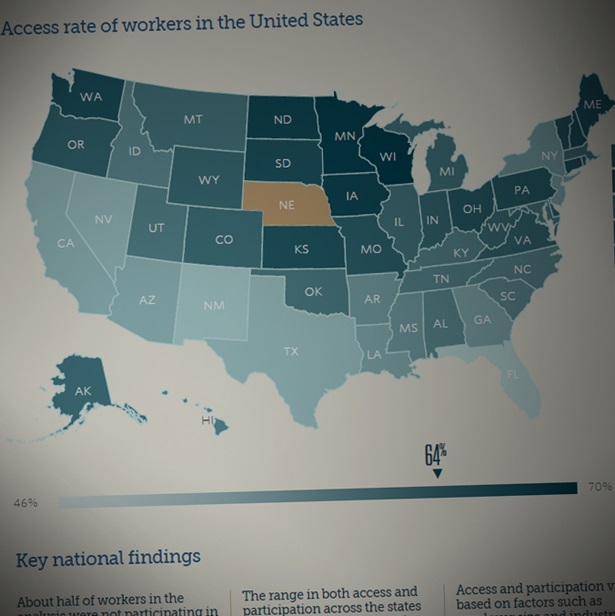
- Over one-third of all workers do not have access to either a defined benefit or defined contribution plan sponsored by their employers.
- Access varies by employment status. Two-thirds of full-time workers have access to a plan compared with only 44 percent of part-time workers.
- Workers in certain industries, millennials, and Hispanics are particularly disadvantaged in terms of access to employer-sponsored retirement savings plans.
- Workers cited eligibility and affordability as key reasons for not participating in available employer-sponsored defined contribution plans: Approximately two-thirds of part-time workers cited eligibility, and almost half of full-time workers mentioned affordability.
- Employer contributions encourage participation. Approximately 73 percent of workers participate when their employer contributes, compared with only 55 percent when the employer does not.
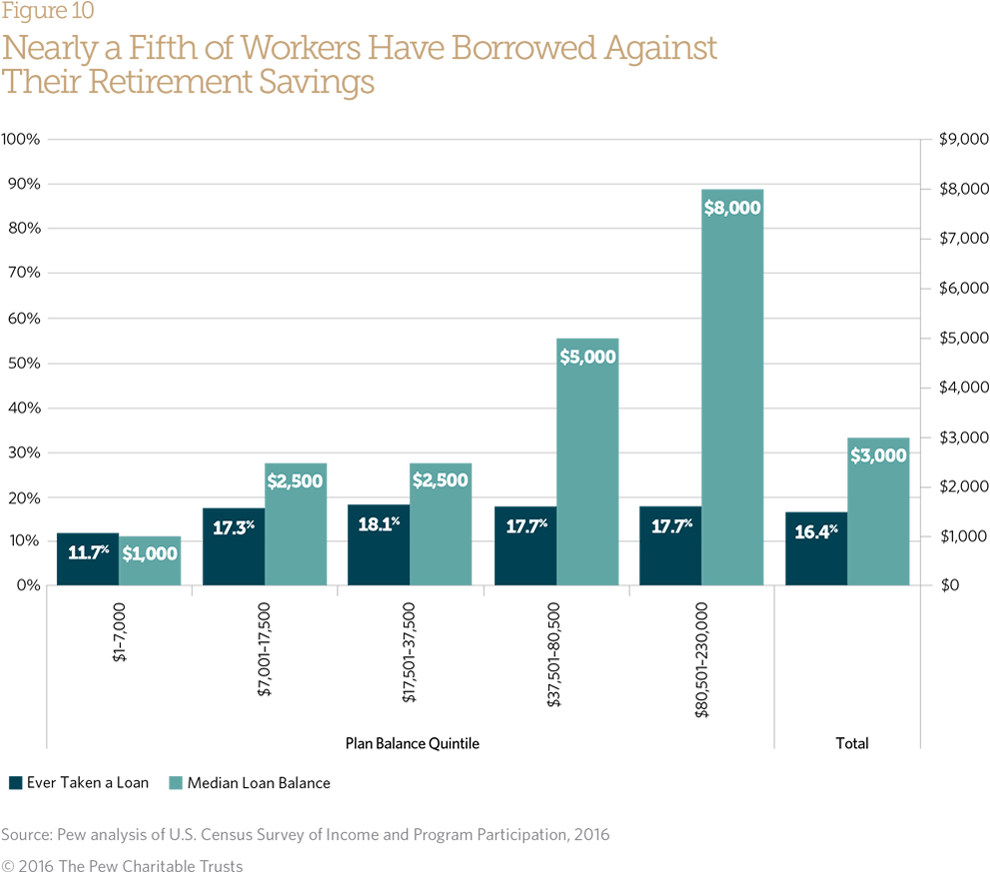
- Approximately 1 in 5 workers who participate in an employer-sponsored defined contribution plan has taken a loan from the plan’s balance.
- The median amount in a retirement savings account is only $22,000, just$6,000 more than the median annual Social Security retirement benefit ($16,146).
This chartbook is the first in a series of publications that will examine the challenges of retirement savings.
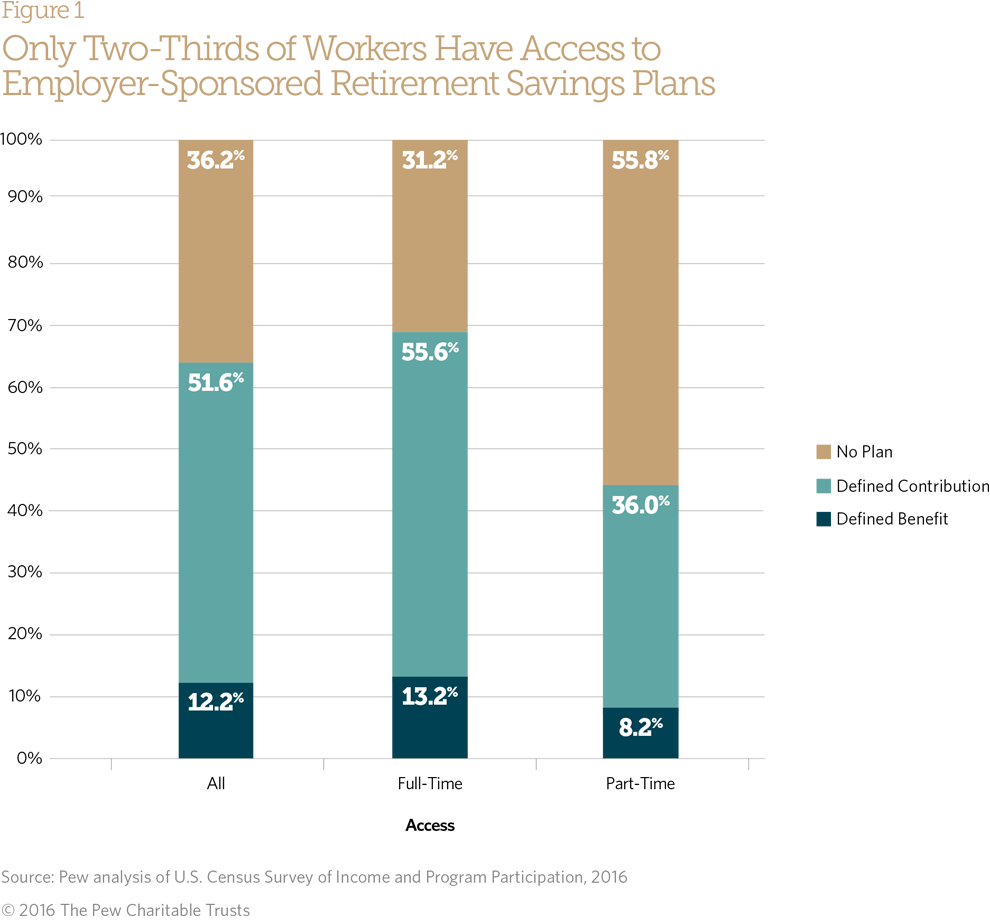
Over one-third of private sector workers do not have access to an employer-sponsored retirement savings plan. For those who do, most—51.6 percent—reported having access to a defined contribution plan, such as a 401(k) or 403(b). Just 12.2 percent said they had access to a defined benefit plan, such as a traditional pension. Most full-time workers (68.8 percent) have access to a plan, compared with only 44.2 percent of part-time workers.3
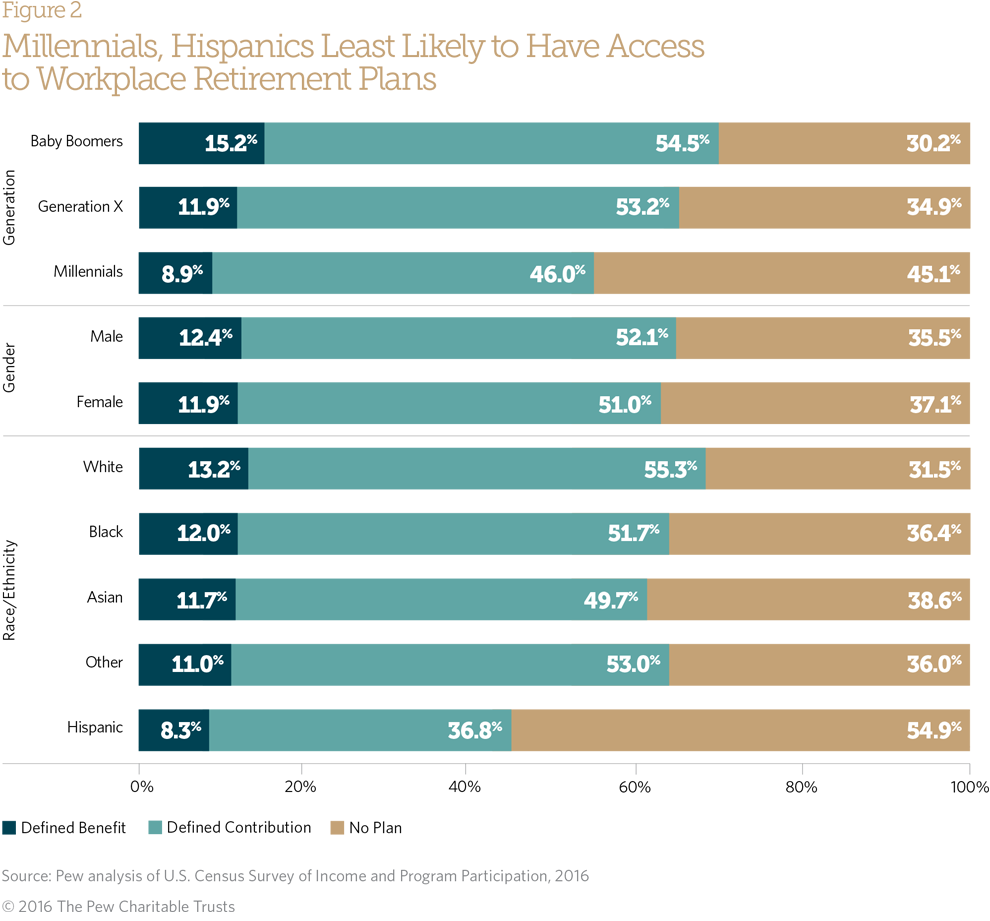
Access to employer-sponsored retirement savings also differs by generation, gender, and race/ethnicity.4 Millennials are most likely to work for employers who do not offer plans; 45.1 percent of millennials lack access versus 30.2 percent of baby boomers and 34.9 percent of Generation Xers.5 Comparing racial and ethnic groups, Hispanics fare worst and are 40 percent more likely than Asians and 72 percent more likely than whites to report working for employers without plans.6
Men and women report similar rates of access to employer-sponsored plans. Future publications in this series will look more broadly at outcomes, such as participation and individual plan balances, comparing men and women.
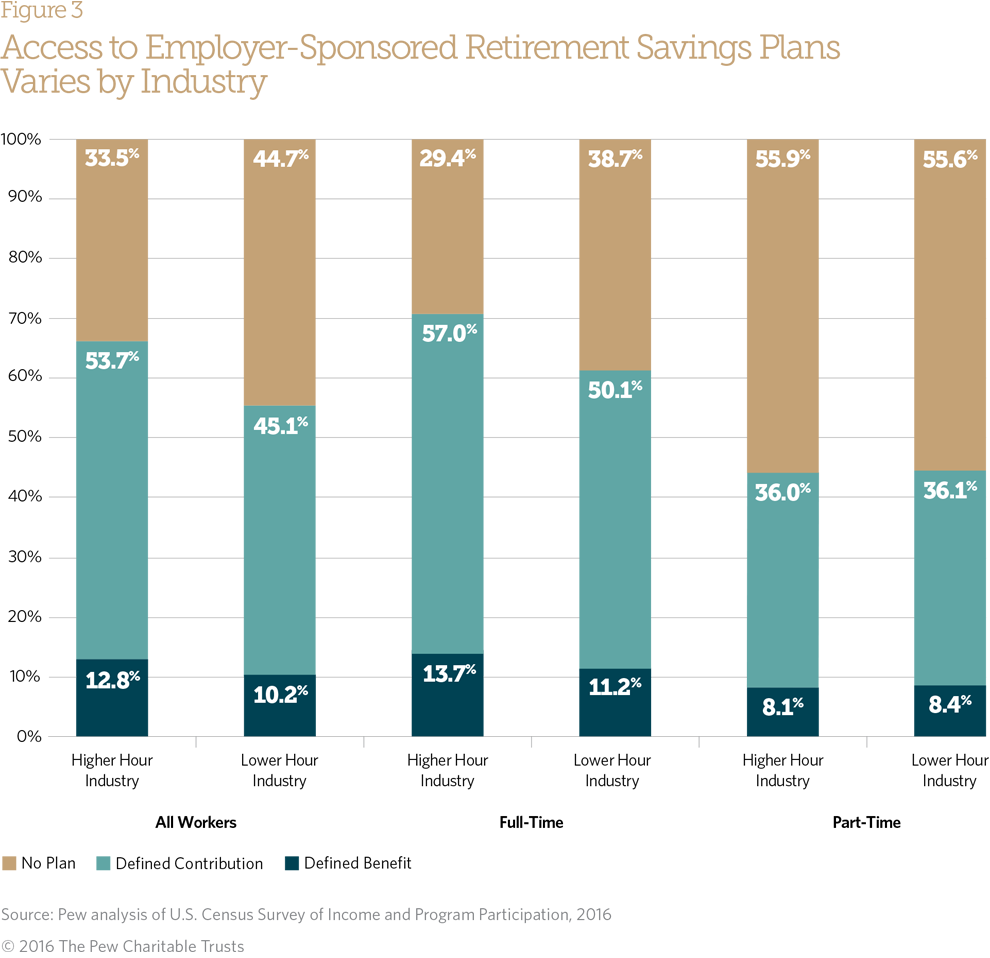
The Bureau of Labor Statistics identified three industries—retail trade; arts, entertainment, and recreation; and accommodation and food services—as “lower-hour industries” where part-time work is more prevalent than full-time work. Workers in these industries have less access to various benefits, including retirement plans, health coverage, and paid leave.7
Lower-hour industry workers have significantly less access to workplace retirement plans; 44.7 percent of workers in lower-hour industries lack access compared with 33.5 percent in higher-hour industries.8 Part-time workers are uniformly disadvantaged, but a strong disparity exists among full-time workers and shows that holding a full-time position does not guarantee a worker access to retirement benefits.

Retirement plan takeup measures participation among those with access to a plan. The analysis of takeup shows significant differences between full- and part-time workers, full-time workers take up at nearly double the rates of part-time workers.
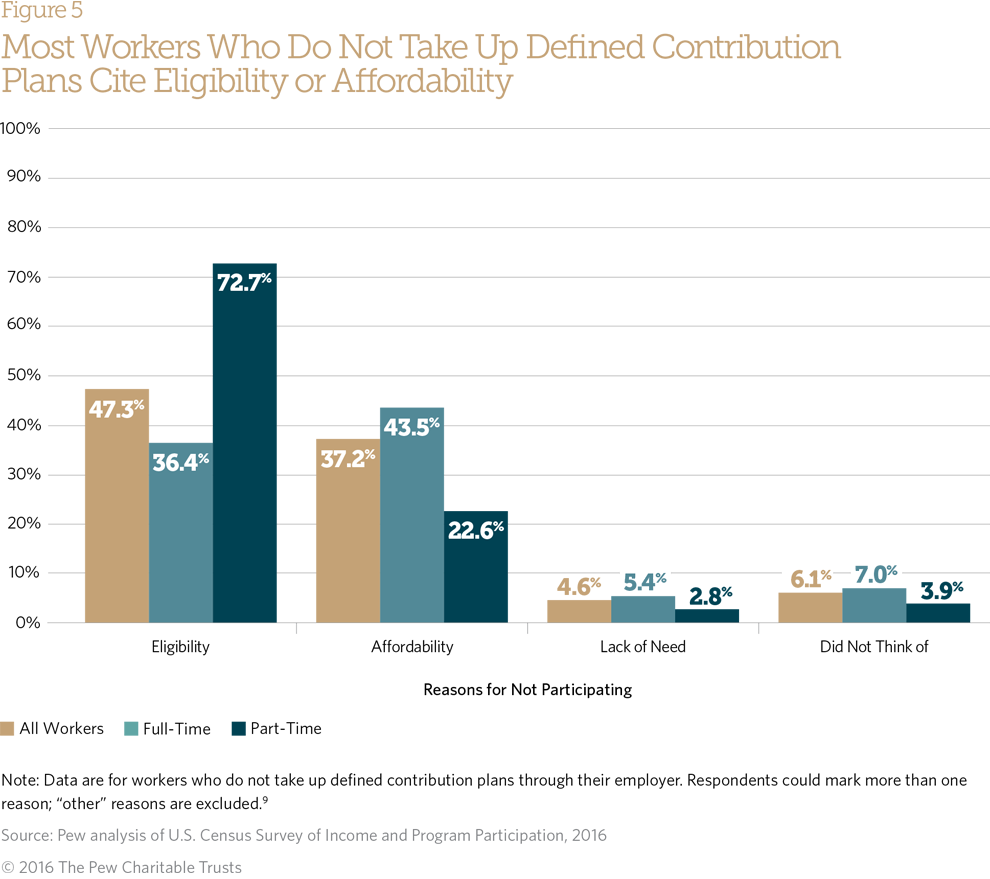
Even when workers have access to plans, the plan rules, such as requiring a minimum number of hours to participate, may effectively prevent participation in these plans: For example, almost three-quarters of part-time workers who do not participate say they were ineligible. This suggests that the 72.7 percent of part-time workers who are ineligible for the plan that their employer provides may effectively be the same as workers who do not have any plan at their workplace.
Affordability was the top concern among full-time workers; 43.5 percent of those who did not participate cited affordability issues. Some workers may feel they have too little disposable income to contribute to a retirement plan while others may be saving their money for other purposes.
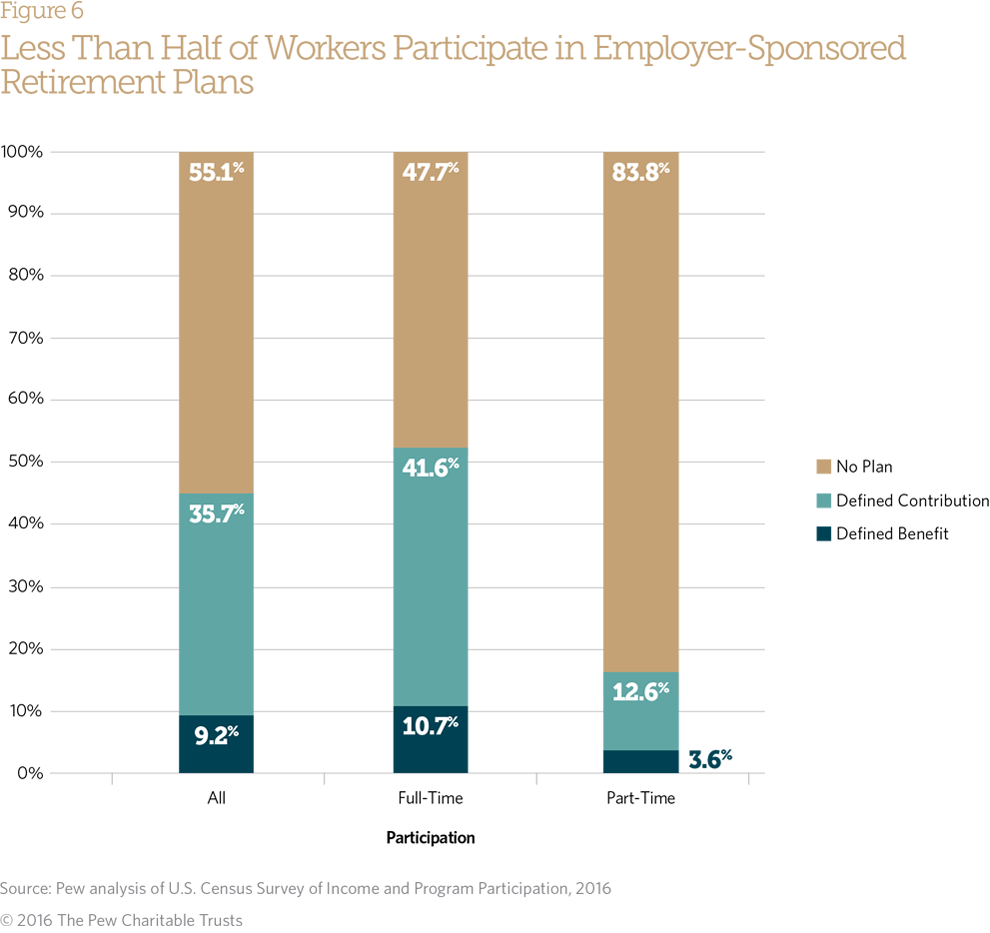
Less than half of all workers participate in an employer-provided retirement savings plan, and the rate varies greatly by employment status. Despite high takeup by full-time workers with access to plans (Figure 4), just over half of all full-time workers participate in an employer’s retirement savings plan, which reflects the low rates of access. Conversely, participation among part-time workers is dismal: Only 16.2 percent participate in employer-sponsored retirement savings plans, reflecting both low access and low takeup.
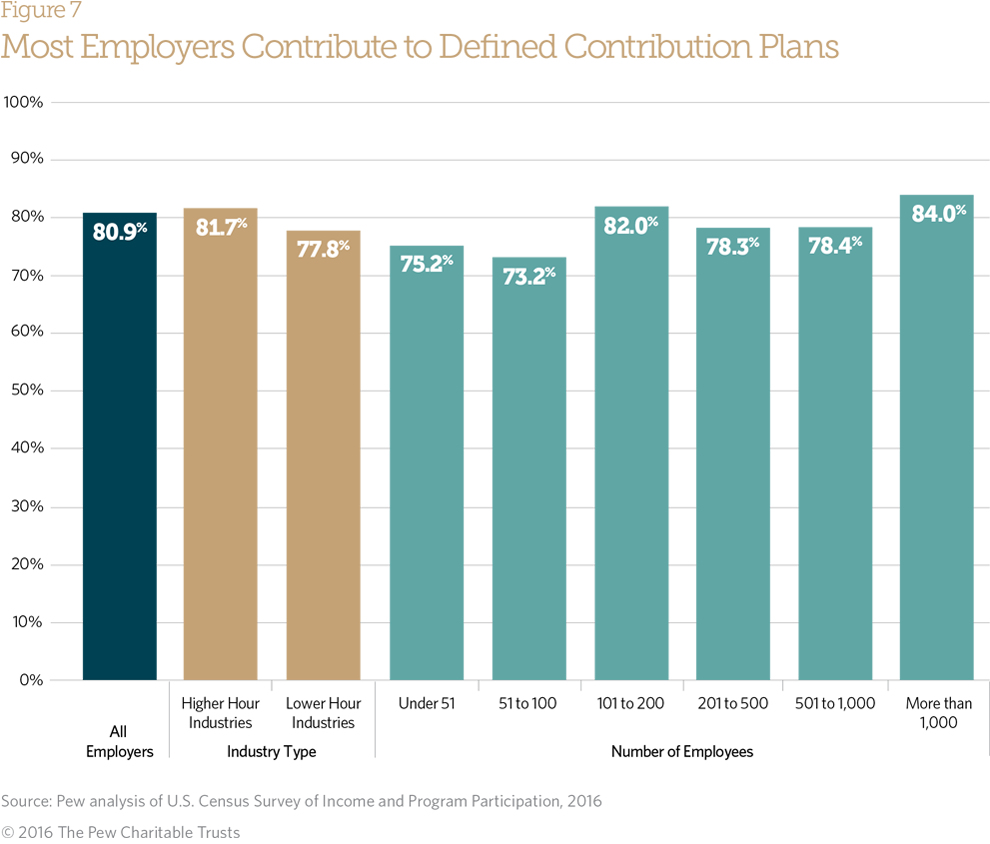
The majority of employers sponsoring retirement plans make contributions that add to employee retirement savings.10 There are differences between employer contributions in lower and higher hour industries (orange bars), where lower hour employees are less likely than those in higher hour industries to report that their employer makes contributions (77.8 percent and 81.7 percent, respectively).11 Employers use contributions to attract and retain workers, and contributions help to increase account balances, particularly for owners and key employees.
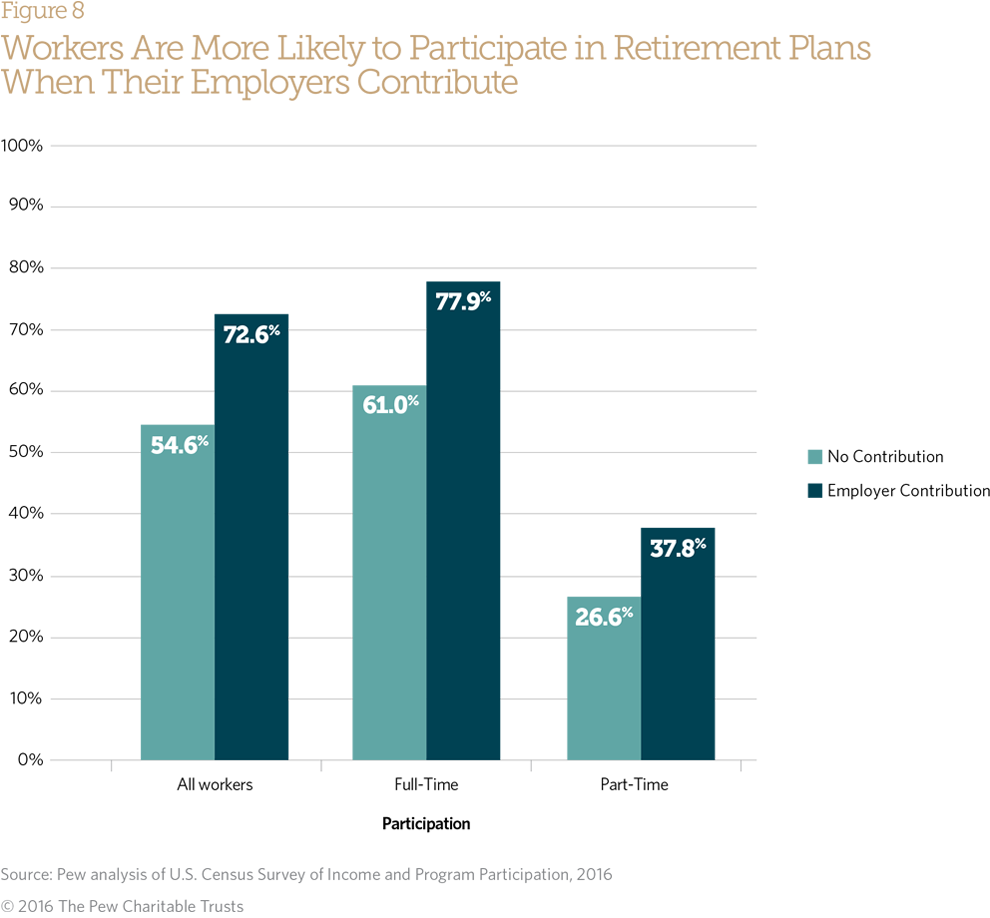
Employer contributions are an important motivation for workers to participate in plans. When an employer contributes, 77.9 percent of full-time workers take up a retirement plan compared with 61 percent of full-time workers whose employer does not contrib-ute. Because employer contributions are often structured as a match for employee contributions, this is an especially important incentive because it additionally boosts retirement savings balances.12
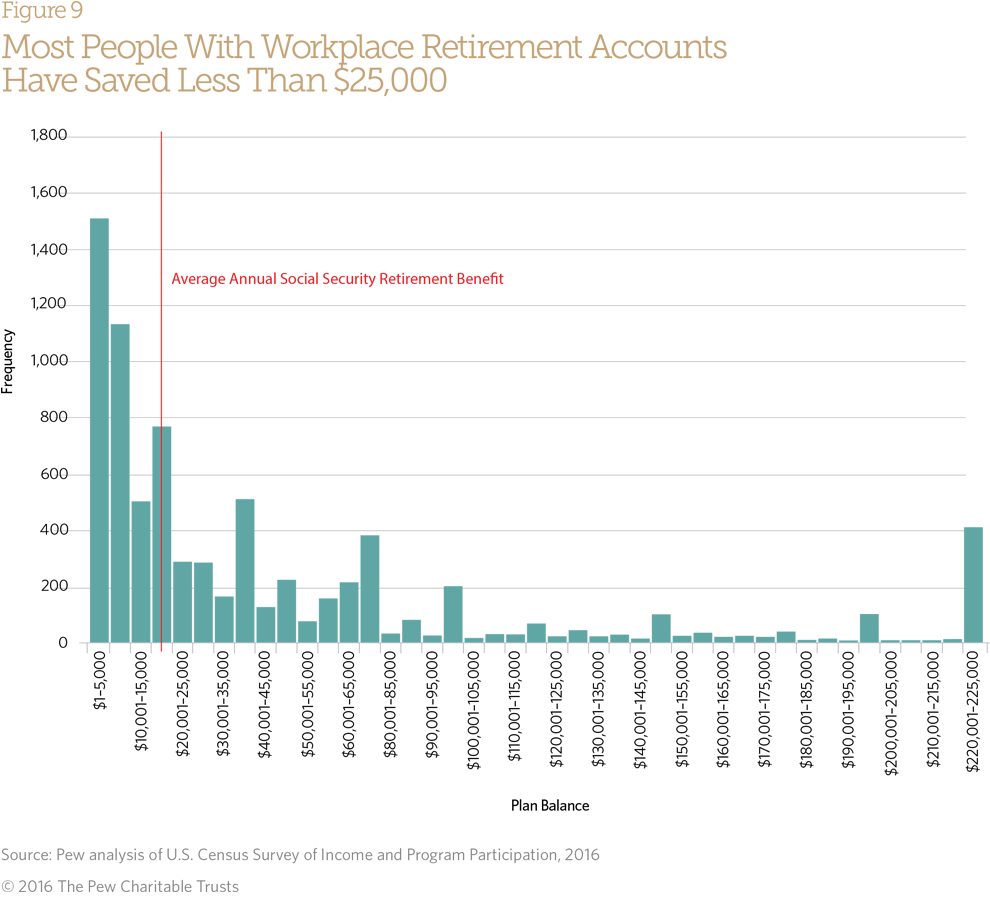
Merely participating in a workplace defined contribution plan doesn’t guarantee retirement security; the amount contributed matters greatly, and most Americans have not saved enough. The median plan balance for all workers is just $22,000, and 40 percent of workers with a defined contribution plan have saved less than the average annual Social Security retirement benefit ($16,146; indicated by the red line).13 One common retirement strategy is living off of 4 percent of total retirement savings annually; but for someone with $22,000 in retirement savings, that is only $880 of retirement income per year.
Endnotes
- The Pew Charitable Trusts, Who’s In, Who’s Out: A Look at Access to Employer-Based Retirement Plans Across the 50 States (January 2016), http://www.pewtrusts.org/en/research-and-analysis/reports/2016/01/a-look-at-access-to-employer-based-retirement-plans-andparticipation-in-the-states. See also Charles Schwab, “401(k) Participant Study: 2015” (2015), https://aboutschwab.com/images/uploads/inline/ 2015_Schwab_401(k)_Participant_Study.pdf.
- For a summary of how the myRA program works, see U.S. Department of the Treasury, “myRA/my Retirement Account,” https://myra. gov; and for a summary of how Secure Choice would work in Illinois, see Illinois State Treasurer, “Secure Choice,” http://illinoistreasurer.gov/Individuals/Secure_Choice. The Washington state marketplace provides a website for small employers to shop for retirement plan products. For more information, see Washington State Department of Financial Institutions, “Small Business Retirement Marketplace,” http://www.dfi.wa.gov/rulemaking/small-business-retirement-marketplace.
- Chi-square tests of significance show significant differences in access to employer-sponsored retirement savings plans between generations at p < 0.001.
- Baby boomers were born from 1946 to 1964, Generation Xers from 1965 to 1980, and millennials from 1981 to 1997.
- Chi-square tests of significance show significant differences in access to employer-sponsored retirement savings plans between generations at p < 0.001.
- Chi-square tests of significance show significant differences in access to employer-sponsored retirement savings plans between racialethnic groups at p < 0.001.
- Higher hour industries include all other industries: mining; construction; manufacturing; wholesale trade; transportation and utilities; information; finance and insurance; real estate and rental and leasing; professional, scientific, and technical services; administrative and support and waste management; educational services; health services; and other services. John L. Bishow, “The Relationship Between Access to Benefits and Weekly Work Hours,” Monthly Labor Review 138 (2015), http://www.bls.gov/opub/mlr/2015/article/therelationship-between-access-to-benefits-and-weekly-work-hours-1.htm.
- A chi-square test was conducted to indicate significant differences in access to employer-sponsored retirement savings plans between industry type among all workers and among full-time workers at p < 0.001. There are no significant differences among part-time workers.
- Respondents originally marked one or more of the following answers, which we then collapsed into five categories: eligibility (“No one in my type of job is allowed in the plan,” “Don’t work enough hours, weeks or months per year,” and “Haven’t worked long enough for this employer”), affordability (“Can’t afford to contribute” and “Don’t want to tie up money”), lack of need (“Don’t need it,” “Have an IRA or other pension plan coverage,” and “Spouse has pension plan”), did not think of (“Haven’t thought of”), and other (“Started job too close to retirement date,” “Too young,” “Employer doesn’t contribute, or contribute enough,” “Don’t plan to be in job long enough,” and “Some other reason”).
- The SIPP asked respondents whether their employer contributed in two survey questions depending on if they did or did not take up offered plans. Values reported are only for those who participated in the offered plan.
- A chi-square test indicates significant differences in employer contributions between industry types at p < 0.001. Other data sets exist that provide information on employer provision of employee benefits, including the Bureau of Labor Statistics’ National Compensation Survey. Pew analyzed this survey in its report “Worker Benefits—and the Costs—Vary Widely Across U.S. Industries.” However, measures of employer expenditures on retirement benefits include all expenditures, whether contributions to retirement accounts, administration fees, or some other cost of operating the retirement plan. Pew uses size of firms across all locations that offer a defined contribution plan. A chi-square test indicates significant differences in employer contributions by firm size at p < 0.001.
- A chi-square test indicates significant differences in employer contributions between those who do and do not participate at p < 0.01.
- The average annual Social Security retirement benefit is calculated from the average monthly benefit paid to retired workers ($1,345.49) as reported by the Social Security Administration in March 2016. Social Security Administration, “Monthly Statistical Snapshot, March 2016,” https://www.ssa.gov/policy/docs/quickfacts/ stat_snapshot/.
- Chi-square tests indicate significant differences between plan balance quintiles in ever taking out a loan at p < 0.001.
- An analysis of variance test on a log transformed loan balance shows statistically significant differences between plan quintiles at p < 0.001.
- The Pew Charitable Trusts, The Role of Emergency Savings in Family Financial Security: What Resources Do Families Have for Financial Emergencies? (November 2015), http://www.pewtrusts.org/~/media/assets/2015/11/ emergencysavingsreportnov2015.pdf.
- Barbara Butrica and Richard Johnson, Racial, Ethnic, and Gender Differentials in Employer-Sponsored Pensions, Urban Institute, statement before the ERISA Advisory Council of the U.S. Department of Labor (June 30, 2010), http://www.urban.org/sites/default/files/alfresco/publication-pdfs/901357-Racial-Ethnic-and-Gender-Differentials-in-Employer-Sponsored-Pensions.PDF. The authors make the point that Social Security was meant to supplement retirement incomes and help keep many Americans out of poverty but that Social Security as a sole source of income leaves many Americans, and especially women and minorities, vulnerable to poverty.
- Full-time or part-time status was determined based on the number of hours reported by respondents; those who said they worked 35 hours or more during the reference period are labeled as full-time workers. Self-employment status was determined based on whether they wanted to use their job or their business as a reference point for the topical module.
- Defined benefit and defined contribution categories were determined by Pew based on a number of characteristics surrounding respondents’ primary pension plan. As part of the survey, respondents were asked about plan type (“plan based on earnings and years on the job” and “cash balance plan” were initially coded as defined benefit plans and “individual account plan” coded as defined contribution plans). Plan type was coded as a defined benefit plan if it was reported that participation in Social Security would affect the plan benefit. We then coded plan type as a defined contribution plan if the primary plan allowed tax-deferred contributions as well as one of the following: Employers’ contributions depended on participants’ own contributions, participants had the ability to choose how money was invested, or they had taken or had the ability to take a loan from their plan. We additionally coded a plan type as a defined contribution plan if respondents answered that the plan was like a 401(k). Finally, respondents were additionally asked clarifying questions to determine that they did not actually have access to employer-sponsored plans. We used their responses to these questions of whether the sponsored plan is tax-deferred, like a 401(k), to code plan types to defined contribution plans. Because of these two lines of questions, takeup was determined based on whether respondents said they participated in the primary plan and whether they answered the applicable follow-up questions. If answers to the primary and follow-up questions were inconsistent, we used answers to the primary questions. Participation is based on takeup. The Stata code is available upon request.


America’s Overdose Crisis
Sign up for our five-email course explaining the overdose crisis in America, the state of treatment access, and ways to improve care
Sign up

Employer-based Retirement Plan Access and Participation
Who’s in, who’s out
ADDITIONAL RESOURCES

Fact Sheet

Podcast