Colorado Voting Reforms: Early Results
2013 election overhaul has yielded greater efficiency and a better experience for citizens
 Shutterstock
Overview
Nearly three years ago, significant changes to Colorado election law necessitated an overhaul of the state’s voting process. The Voter Access and Modernized Elections Act of 2013 mandated that mail ballots be sent to every registered voter for most elections; eliminated assigned polling places while establishing voter service and polling centers where any voter in a county can cast a ballot—either early or on Election Day; authorized inperson same-day registration; and shortened the state residency requirements for voter registration.
The Pew Charitable Trusts funded research on the impact of these changes, and although study of future elections is needed to better evaluate the effects, initial findings include:
- Costs decreased by an average of 40 percent in five election administration-related categories. The 46 (of 64) counties with data available spent about $9.56 per vote in the 2014 general election, compared with nearly $16 in 2008.1
- The use of provisional ballots declined nearly 98 percent. In the 2010 general election, voters in the state cast 39,361 provisional ballots. In 2014, that number dropped to 981.
- Nearly two-thirds of voters in the 2014 general election said they returned their ballots in person, rather than by mail. Of these voters, almost 80 percent said it took them less than 10 minutes to get to a designated location, usually a drop box.
Colorado’s Voter Access and Modernized Elections Act of 2013
Governor John Hickenlooper (D) signed the act, H.B. 13-1303, into law in May 2013, and it fundamentally changed how elections are administered in the state, including:
- Requiring that mail ballots be sent to all registered voters while still accommodating in-person voting before and on Election Day.
- Directing counties to establish a minimum number—determined by the size of each county’s voting population2—of voter service and polling centers (known as “vote centers” in many other states) where all eligible voters in the county can register to vote; update their voting information; cast their ballots, including provisional ballots when necessary; and drop off completed mail ballots.
- Allowing in-person same-day registration and extending the deadlines to register by mail, online, at a voter registration agency, or at a local driver’s license examination center.3
- Shortening state residency requirements for voter registration from 30 days to 22 days and eliminating the minimum time that a voter must have resided within a precinct.
Election costs
Although capturing the precise cost of administering an election can be challenging, initial evidence indicates that certain election costs in Colorado decreased after the law was enacted. Counties spent an average of $9.56 per vote in 2014, down from $15.96 in 2008, and all but three counties spent less per vote in 2014 than in 2008.4
Five cost categories were tracked: printing, labor, rental, postage, and miscellaneous. Cost per vote decreased in four of the five expense categories.
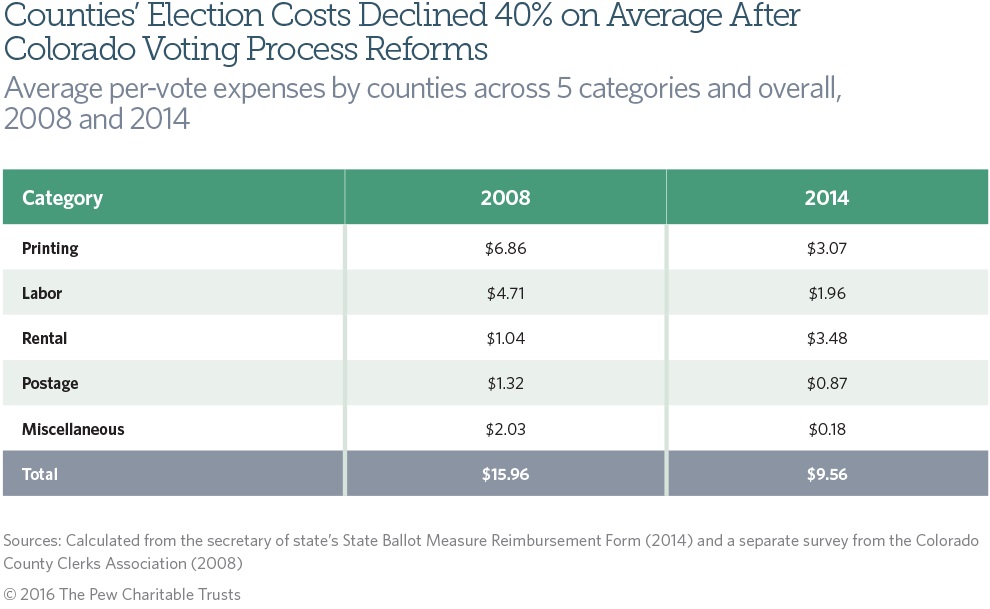
Printing costs dropped by half in 2014; local and state election officials cited several reasons for the sharp decline. “The huge reduction of provisional ballots is one factor,” said Pam Anderson, executive director of the Colorado County Clerks Association and former Jefferson County clerk and recorder. Provisional ballots require custom envelopes, which incur a high printing cost. Anderson also pointed to the reduced need for preprinted ballots resulting from “the increased use of ballot-on-demand systems, which prevent you from having to stock a lot of ballots.”5
The lower labor cost per vote is consistent with the elimination of traditional precinct polling places. With the shift to vote centers, the numbers of polling locations and poll workers needed decrease.6
In 2008, Colorado had over 16,000 poll workers at more than 1,800 polling locations across its 64 counties, of which 43 used traditional precinct-based polling places and 21 used vote centers.7 In 2014, with vote centers required in all counties and most voters casting their ballots by mail, fewer than 4,000 poll workers were employed at approximately 300 voting locations statewide.8
One cost that rose after the act was implemented was the rental cost per vote. This may be attributable to the need for Internet connections in vote centers to allow poll workers to access the statewide voter registration database, which limits the types of locations that can be used to those that may have higher rental fees. However, cost reductions in other categories more than offset this increase.
Impact on election administration
Provisional ballots
The implementation of same-day registration, vote centers, and the delivery of mail ballots to all voters appears to have contributed to the dramatic reduction in the issuance of provisional ballots between 2010 (39,361) and 2014 (981). Thirty-six of the 64 counties had no provisional ballots cast in 2014, up from just eight in 2010.
In the city and county of Denver, only 179 provisional ballots were issued in 2014—compared with more than 6,000 issued in 2010. Director of Elections Amber McReynolds estimates her office saved approximately $28,000 as a result of this reduction.9
Mail ballots
The rate at which mail ballots were returned decreased, falling from 78 percent in 2010 to 65 percent in 2014. This is probably due to the significant increase in the use of mail ballots associated with the modernization law’s requirement that all registered voters receive a ballot by mail automatically: In 2010, the state sent 1,615,308 ballots to voters, compared with 3,032,934 in 2014. The decline in return rate is not necessarily surprising: When more eligible voters are sent ballots in the mail, the number of those ballots that are never returned is likely to also rise.
Turnout
Statewide, turnout in Colorado grew from 51.7 percent in 2010 to 54.7 percent in 2014. Many factors affect turnout, and the impact of the new law on voter participation cannot be precisely measured. Colorado had a competitive, high-profile Senate contest in 2014, which may have driven turnout higher. Further, Colorado has seen turnout in midterm elections increase every year since 1994, making it difficult to tell to what degree the gain reported in 2014 was due to the new law or evidence of a much longer-term trend in the state.10
Impact on the voter experience
In a survey of more than 1,500 individuals about the voter experience in Colorado, mail and in-person voters reported almost identical high rates of satisfaction with their voting experience. Among mail voters, 95 percent indicated that they were satisfied or very satisfied with their voting experience, compared with 96 percent of inperson voters. Additionally, although all Colorado voters receive mail ballots, they do not necessarily return them via the Postal Service. Nearly two-thirds (64 percent) of respondents said they returned their ballot in person, usually to a drop box. Convenience seems to have been a factor; of these voters, 78 percent said it took less than 10 minutes to get to a drop box location or voter service center.11
Conclusion
The Voter Access and Modernized Elections Act significantly changed election administration in Colorado, probably contributing to decreased election costs and reduced reliance on provisional ballots. As more elections are held under these new guidelines, additional research will help to determine the full scope and scale of the law’s impact.
Methodology
This report is primarily based on research conducted by Robert Stein, Ph.D., professor of political science at Rice University, and funded by Pew.
Cost data were collected for 2014 from Colorado’s State Ballot Measure Reimbursement Form, which each county is required to complete in order to receive partial reimbursement from the state. These data were matched against the findings of a 2008 survey conducted by the Colorado County Clerks Association. Only 46 of the 64 counties completed the survey, but the matched and unmatched counties do not differ significantly on most demographic indicators. The categories analyzed are population, mean family income, median age, percent with a high school diploma or greater, percent white, percent African-American, and percent Hispanic. Only the difference in percent with a college degree or greater is statistically significant.12
The voter opinion data were collected through a survey performed in 2014 by Ciruli Associates and funded by Pew. Three sets of telephone interviews were conducted with a representative sample of registered voters Oct. 23 to 26, Oct. 31 to Nov. 3, and Nov. 5 to 7. The margin of error was plus or minus 2.5 percentage points.
Endnotes
- Before 2014, the only cost data available were from 2008.
- Voter service and polling center requirements for federal general elections are as follows:
- Counties with 25,000 or more active voters must have:
- During early voting—at least one voter service and polling center per 30,000 active voters, with a minimum of one center in each county.
- On Election Day—at least one voter service and polling center per 15,000 active voters, with a minimum of three centers in each county.
- Counties with between 10,000 and 25,000 active voters must have one center during early voting and three centers on Election Day.
- Counties with fewer than 10,000 active voters must have at least one center during early voting and on Election Day.
- Counties with 25,000 or more active voters must have:
- The Colorado Division of Motor Vehicles uses separate offices for title and registration.
- Cost categories were the same for both 2008 and 2014 and were compared by dividing total expenditures by the number of ballots cast in each year. Given that turnout is generally higher in a presidential election than in a midterm election (2,426,253 ballots were cast in 2008, compared with 2,075,858 in 2014), economies of scale may result in lower costs per vote in presidential years.
- Pam Anderson (executive director, Colorado County Clerks Association), email correspondence, Dec. 2, 2015.
- Other states that use vote centers, including Indiana, New Mexico, and South Dakota, have reported reductions in the number of poll workers and voting sites.
- Data on poll workers and polling locations in 2008 were available for 57 of 64 counties.
- U.S. Election Assistance Commission, “2008 Election Administration and Voting Survey: A Summary of Key Findings” (November 2009), http://www.eac.gov/assets/1/ Documents/2008%20Election%20Administration%20and%20Voting% 20Survey%20EAVS%20Report. pdf; and U.S. Election Assistance Commission, “The 2014 EAC Election Administration and Voting Survey Comprehensive Report” (June 30, 2015), http://www.eac.gov/assets/1/ Page/2014_EAC_EAVS_Comprehensive_Report_508_Compliant.pdf.
- Amber McReynolds (director of elections, city and county of Denver), email correspondence, Oct. 20, 2015.
- United States Election Project, “State Turnout Rates,” http://www.electproject.org/home/voter-turnout/voter-turnout-data.
- For more detailed discussion of how mail ballots are returned in Colorado and nationally, see Sean Greene and Kyle Ueyama, “Vote-by-Mail Rates More Than Double Since 2000,” Stateline, April 29, 2015, http://www.pewtrusts.org/en/research-and-analysis/blogs/ stateline/2015/4/29/vote-by-mail-practices-more-than-double-since-2000.
- Matched counties had an average of 31.1 percent with a bachelor’s degree or higher, compared with 24.1 percent among unmatched counties.


America’s Overdose Crisis
Sign up for our five-email course explaining the overdose crisis in America, the state of treatment access, and ways to improve care
Sign up


Election Dispatches
Data, research, and analysis about election administration.
Learn More
ADDITIONAL RESOURCES
Article

Article