Federal Drug Sentencing Laws Bring High Cost, Low Return
Penalty increases enacted in 1980s and 1990s have not reduced drug use or recidivism

Overview
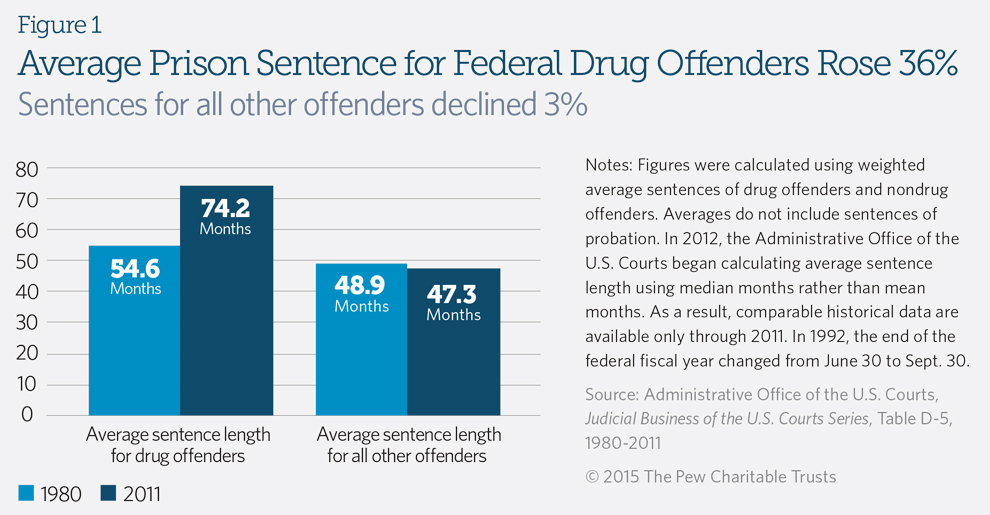
More than 95,000 federal prisoners are serving time for drug-related offenses—up from fewer than 5,000 in 1980.1 Changes in drug crime patterns and law enforcement practices played a role in this growth, but federal sentencing laws enacted during the 1980s and 1990s also have required more drug offenders to go to prison— and stay there much longer—than three decades ago.2 (See Figure 1.) These policies have contributed to ballooning costs: The federal prison system now consumes more than $6.7 billion a year, or roughly 1 in 4 dollars spent by the U.S. Justice Department.3
Despite substantial expenditures on longer prison terms for drug offenders, taxpayers have not realized a strong public safety return. The self-reported use of illegal drugs has increased over the long term as drug prices have fallen and purity has risen.4 Federal sentencing laws that were designed with serious traffickers in mind have resulted in lengthy imprisonment of offenders who played relatively minor roles.5 These laws also have failed to reduce recidivism. Nearly a third of the drug offenders who leave federal prison and are placed on community supervision commit new crimes or violate the conditions of their release—a rate that has not changed substantially in decades.6
More imprisonment, higher costs
Congress increased criminal penalties for drug offenders during the 1980s—and, to a lesser extent, in the 1990s—in response to mounting public concern about drug-related crime.7 In a 1995 report that examined the history of federal drug laws, the U.S. Sentencing Commission found that “drug abuse in general, and crack cocaine in particular, had become in public opinion and in members’ minds a problem of overwhelming dimensions.”8 The nation’s violent crime rate surged 41 percent from 1983 to 1991, when it peaked at 758 violent offenses per 100,000 residents.9
Congress increased drug penalties in several ways. Lawmakers enacted dozens of mandatory minimum sentencing laws that required drug offenders to serve longer periods of confinement. They also established compulsory sentence enhancements for certain drug offenders, including a doubling of penalties for repeat offenders and mandatory life imprisonment without the possibility of parole for those convicted of a third serious offense. These laws have applied broadly: As of 2010, more than 8 in 10 drug offenders in federal prisons were convicted of crimes that carried mandatory minimum sentences.10
Also during the 1980s, Congress created the Sentencing Commission, an appointed panel that established strict sentencing guidelines and generally increased penalties for drug offenses. The same law that established the commission, the Sentencing Reform Act of 1984, also eliminated parole and required all inmates to serve at least 85 percent of their sentences behind bars before becoming eligible for release.
Federal data show the systemwide effects of these policies:
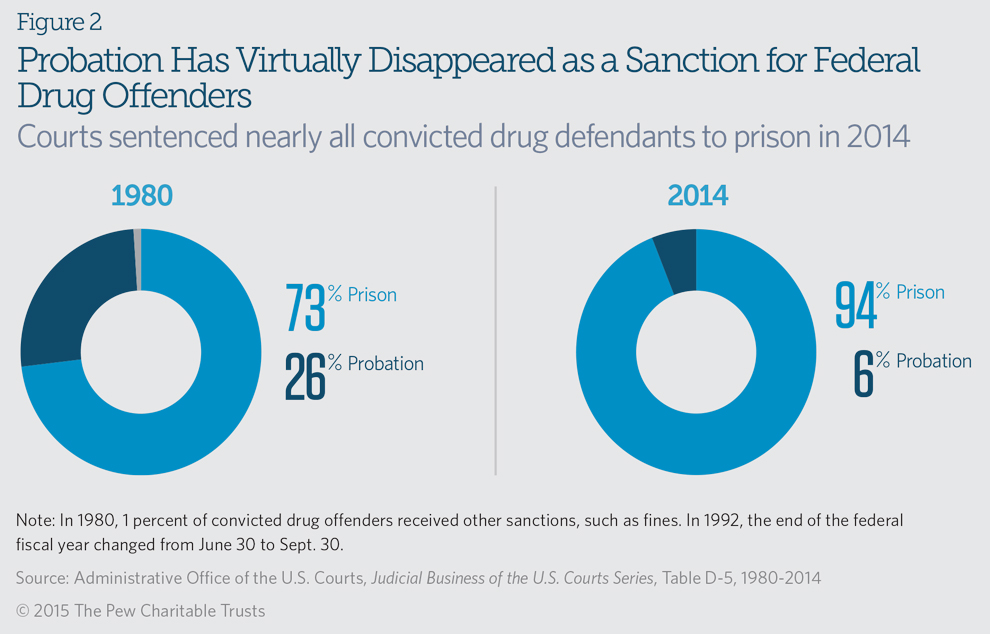
- Probation has all but disappeared as a sanction for drug offenders. In 1980, federal courts sentenced 26 percent of convicted drug offenders to probation. By 2014, the proportion had fallen to 6 percent, with judges sending nearly all drug offenders to prison.11 (See Figure 2.)
- The length of drug sentences has increased sharply. As shown in Figure 1 above, from 1980 to 2011 (the latest year for which comparable statistics are available), the average prison sentence imposed on drug offenders increased 36 percent—from 54.6 to 74.2 months—even as it declined 3 percent for all other offenders.12
- The proportion of federal prisoners who are drug offenders has nearly doubled. The share of federal inmates serving time for drug offenses increased from 25 percent in 1980 to a high of 61 percent in 1994.13 This proportion has declined steadily in recent years—in part because of rising prison admissions for other crimes—but drug offenders still represent 49 percent of all federal inmates.14
- Time served by drug offenders has surged. The average time that released drug offenders spent behind bars increased 153 percent between 1988 and 2012, from 23.2 to 58.6 months.15 This increase dwarfs the 39 and 44 percent growth in time served by property and violent offenders, respectively, during the same period.16
The increased imprisonment of drug offenders has helped drive the explosive overall growth of the federal prison system, which held nearly 800 percent more inmates in 2013 than it did in 1980.17 One study found that the increase in time served by drug offenders was the “single greatest contributor to growth in the federal prison population between 1998 and 2010.”18
Growth in the prison population has driven a parallel surge in taxpayer spending. From 1980 to 2013, federal prison spending increased 595 percent, from $970 million to more than $6.7 billion in inflation-adjusted dollars.19 Taxpayers spent almost as much on federal prisons in 2013 as they paid to fund the entire U.S. Justice Department—including the Federal Bureau of Investigation, the Drug Enforcement Administration, and all U.S. attorneys—in 1980, after adjusting for inflation.20
Increased availability and use of illegal drugs
Measurements of the availability and consumption of illegal drugs in the United States are imprecise. Users may be reluctant to share information about their illegal behavior, and national surveys may not capture responses from specific populations—such as homeless or incarcerated people—who may have high rates of drug use. Drug markets also vary considerably from city to city and state to state, and among different drugs.
Despite these limitations, the best available data suggest that increased penalties for drug offenders—both at the federal and state levels—have not significantly changed long-term patterns of drug availability or use:
- Illegal drug prices have declined. The estimated street price of illegal drugs is a commonly cited measure of supply. Higher prices indicate scarcity while lower prices suggest wider availability. After adjusting for inflation, the estimated retail prices of cocaine, heroin, and methamphetamine all decreased from 1981 to 2012, even as the purity of the drugs increased.21
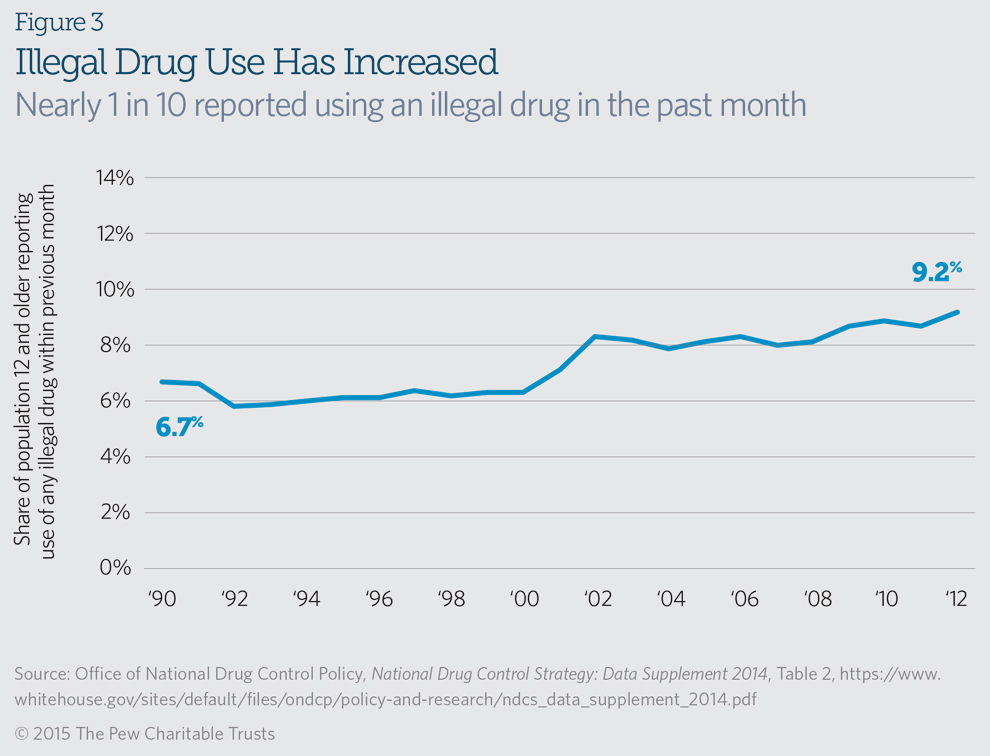
- Illegal drug use has increased. The share of Americans age 12 and older who said in a national survey that they had used an illicit drug during the previous month increased from 6.7 percent in 1990 to 9.2 percent—or nearly 24 million people—in 2012.22 (See Figure 3.) An increase in marijuana use helped drive this trend, more than offsetting a decline in cocaine use.
Just as enhanced criminal penalties have not reduced the availability or use of illegal drugs, research shows that they are unlikely to significantly disrupt the broader drug trade. One study estimated that the chance of being imprisoned for the sale of cocaine in the U.S. is less than 1 in 15,000—a prospect so remote that it is unlikely to discourage many offenders.23 The same applies for longer sentences. The National Research Council concluded in a 2014 report that mandatory minimum sentences for drug and other offenders “have few if any deterrent effects.”24 Even if street-level drug dealers are apprehended and incarcerated, such offenders are easily replaced, ensuring that drug trafficking can continue, researchers say.25
To be sure, many criminologists agree that the increased imprisonment of drug offenders—both at the federal and state levels—played a role in the ongoing nationwide decrease in crime that began in the early 1990s. But research credits the increased incarceration of drug offenders with only a 1 to 3 percent decline in the combined violent and property crime rate.26 “It is unlikely that the dramatic increase in drug imprisonment was cost- effective,” one study concluded in 2004.27
Penalties do not match roles
The federal government is responsible for combating illegal drug trafficking into the United States and across state lines. As a result, traffickers represent the vast majority of the drug offender population in federal prisons.28 Federal sentencing laws have succeeded in incarcerating kingpins and other serious drug offenders for whom prison is the appropriate option. At the same time, however, they have resulted in the lengthy imprisonment of many offenders who played relatively minor roles in drug trafficking.
The Anti-Drug Abuse Act of 1986 demonstrates this trend. The law established a five-year mandatory minimum sentence for “serious” drug traffickers, defined as those convicted of crimes involving a minimum amount of illegal drugs, including 100 grams of heroin or 500 grams of cocaine. The law also created a 10-year mandatory minimum sentence for “major” traffickers—those convicted of crimes involving larger amounts, including 1 kilogram of heroin or 5 kilograms of cocaine.29 Under the law, mandatory minimum sentences double from five to 10 years—and from 10 years to 20—for second offenses.
Although the law was intended to separate offenders into lower and higher degrees of culpability based on the amount of drugs involved in their crimes, these distinctions have not always captured individuals’ true roles in drug distribution networks. “The quantity of drugs involved in an offense is not as closely related to the offender’s function in the offense as perhaps Congress expected,” the Sentencing Commission concluded in a special report to Congress in 2011.30
The quantity of drugs involved in an offense is not as closely related to the offender’s function in the offense as perhaps Congress expected.U.S. Sentencing Commission, 2011
Historical data limitations make it difficult to assess whether the drug traffickers incarcerated in federal prisons today are more or less serious than those of three decades ago. But the Sentencing Commission’s report underscores that federal resources have not been directed at the most serious drug traffickers.31 According to the report, in 2009:
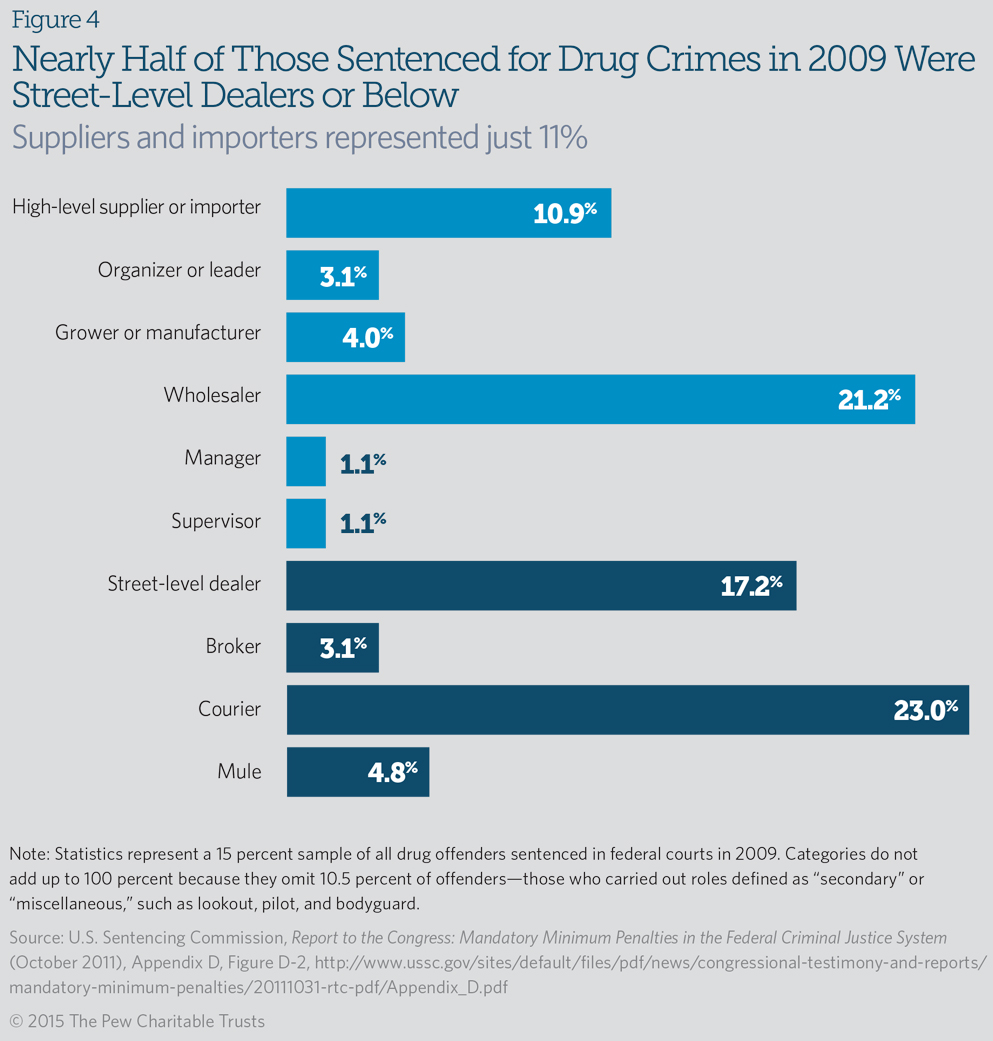
- Those sentenced for relatively minor roles represented the biggest share of federal drug offenders. More than a quarter of federal drug offenders—and two-thirds of federal marijuana offenders—were “couriers” or “mules,” the lowest-level trafficking roles on a culpability scale developed by the commission.32 (See Figure 4.) The average sentences for couriers and mules—defined as those who transport illegal drugs either in a vehicle or on their person—were 39 and 29 months, respectively.
- Nearly a fifth of federal drug offenders were street dealers. Offenders defined as “street-level dealers”—those who distributed an ounce or less of illegal drugs directly to users—made up 17 percent of federal drug offenders and nearly half of federal crack cocaine offenders.33 The average sentence for these individuals was 77 months.
- The highest-level traffickers represented a comparatively small share of federal drug offenders. Those defined as “high-level suppliers” or “importers”—the top function on the culpability scale—represented 11 percent of federal drug offenders. The average sentence for these offenders was 101 months.
- Sentence lengths did not always align with offenders’ functions. Although lower-level functionaries generally received much shorter average sentences than higher-level offenders, there were notable exceptions: Midlevel “managers,” for example, received an average sentence of 147 months, or nearly four years longer than the 101-month average sentence imposed on the highest-level traffickers.
It is important to note that federal law permits two exemptions to mandatory minimum sentences that frequently benefit many lower-level drug traffickers.34 One allows sentence reductions for those who provide prosecutors with “substantial assistance” during the course of an investigation. The other, known as the “safety valve,” applies to offenders who meet five specific criteria, including a limited criminal history and a nonleadership role in the drug trade.
Although these sentence reduction tools are intended to—and generally do—benefit low-level traffickers the most, there are exceptions. More than half of offenders deemed to be high-level suppliers or importers, for example, received relief from mandatory minimum penalties in 2009, compared with less than a third of those classified as street-level dealers—despite the much lower culpability level of the latter group.35
Post-prison outcomes unchanged
Research has found little relationship between the length of prison terms and recidivism rates generally—a pattern that holds among drug offenders at the federal level.
Of the more than 20,000 federal drug offenders who concluded periods of post-release community supervision in 2012 (the latest year for which statistics are available), 29 percent either committed new crimes or violated the conditions of their release.36 This proportion has changed little since the mid-1980s, when sentences and time served began increasing sharply.37
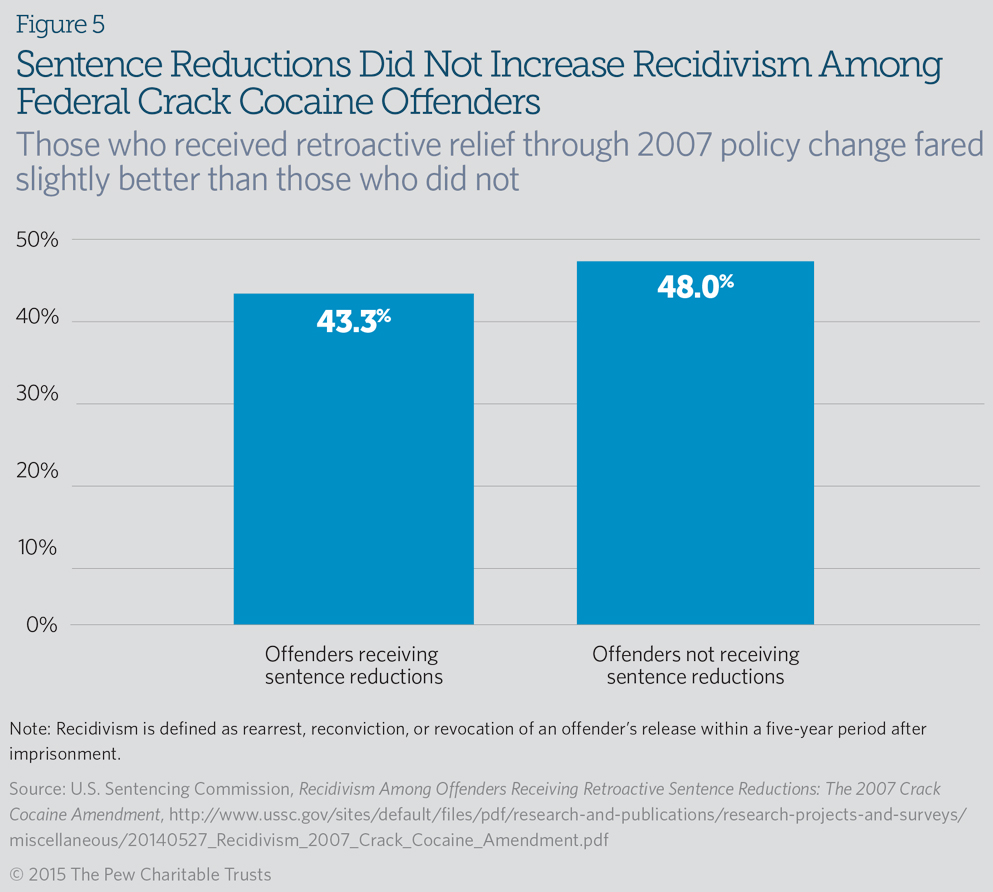
Conversely, targeted reductions in prison terms for certain federal drug offenders have not led to higher recidivism rates. In 2007, the Sentencing Commission retroactively reduced the sentences of thousands of crack cocaine offenders.38 A follow-up study on the effects of this change found no evidence of increased recidivism among offenders who received sentence reductions compared with those who did not.39 (See Figure 5.) In 2010, Congress followed the Sentencing Commission’s actions with a broader, statutory reduction in penalties for crack cocaine offenders.
Timeline
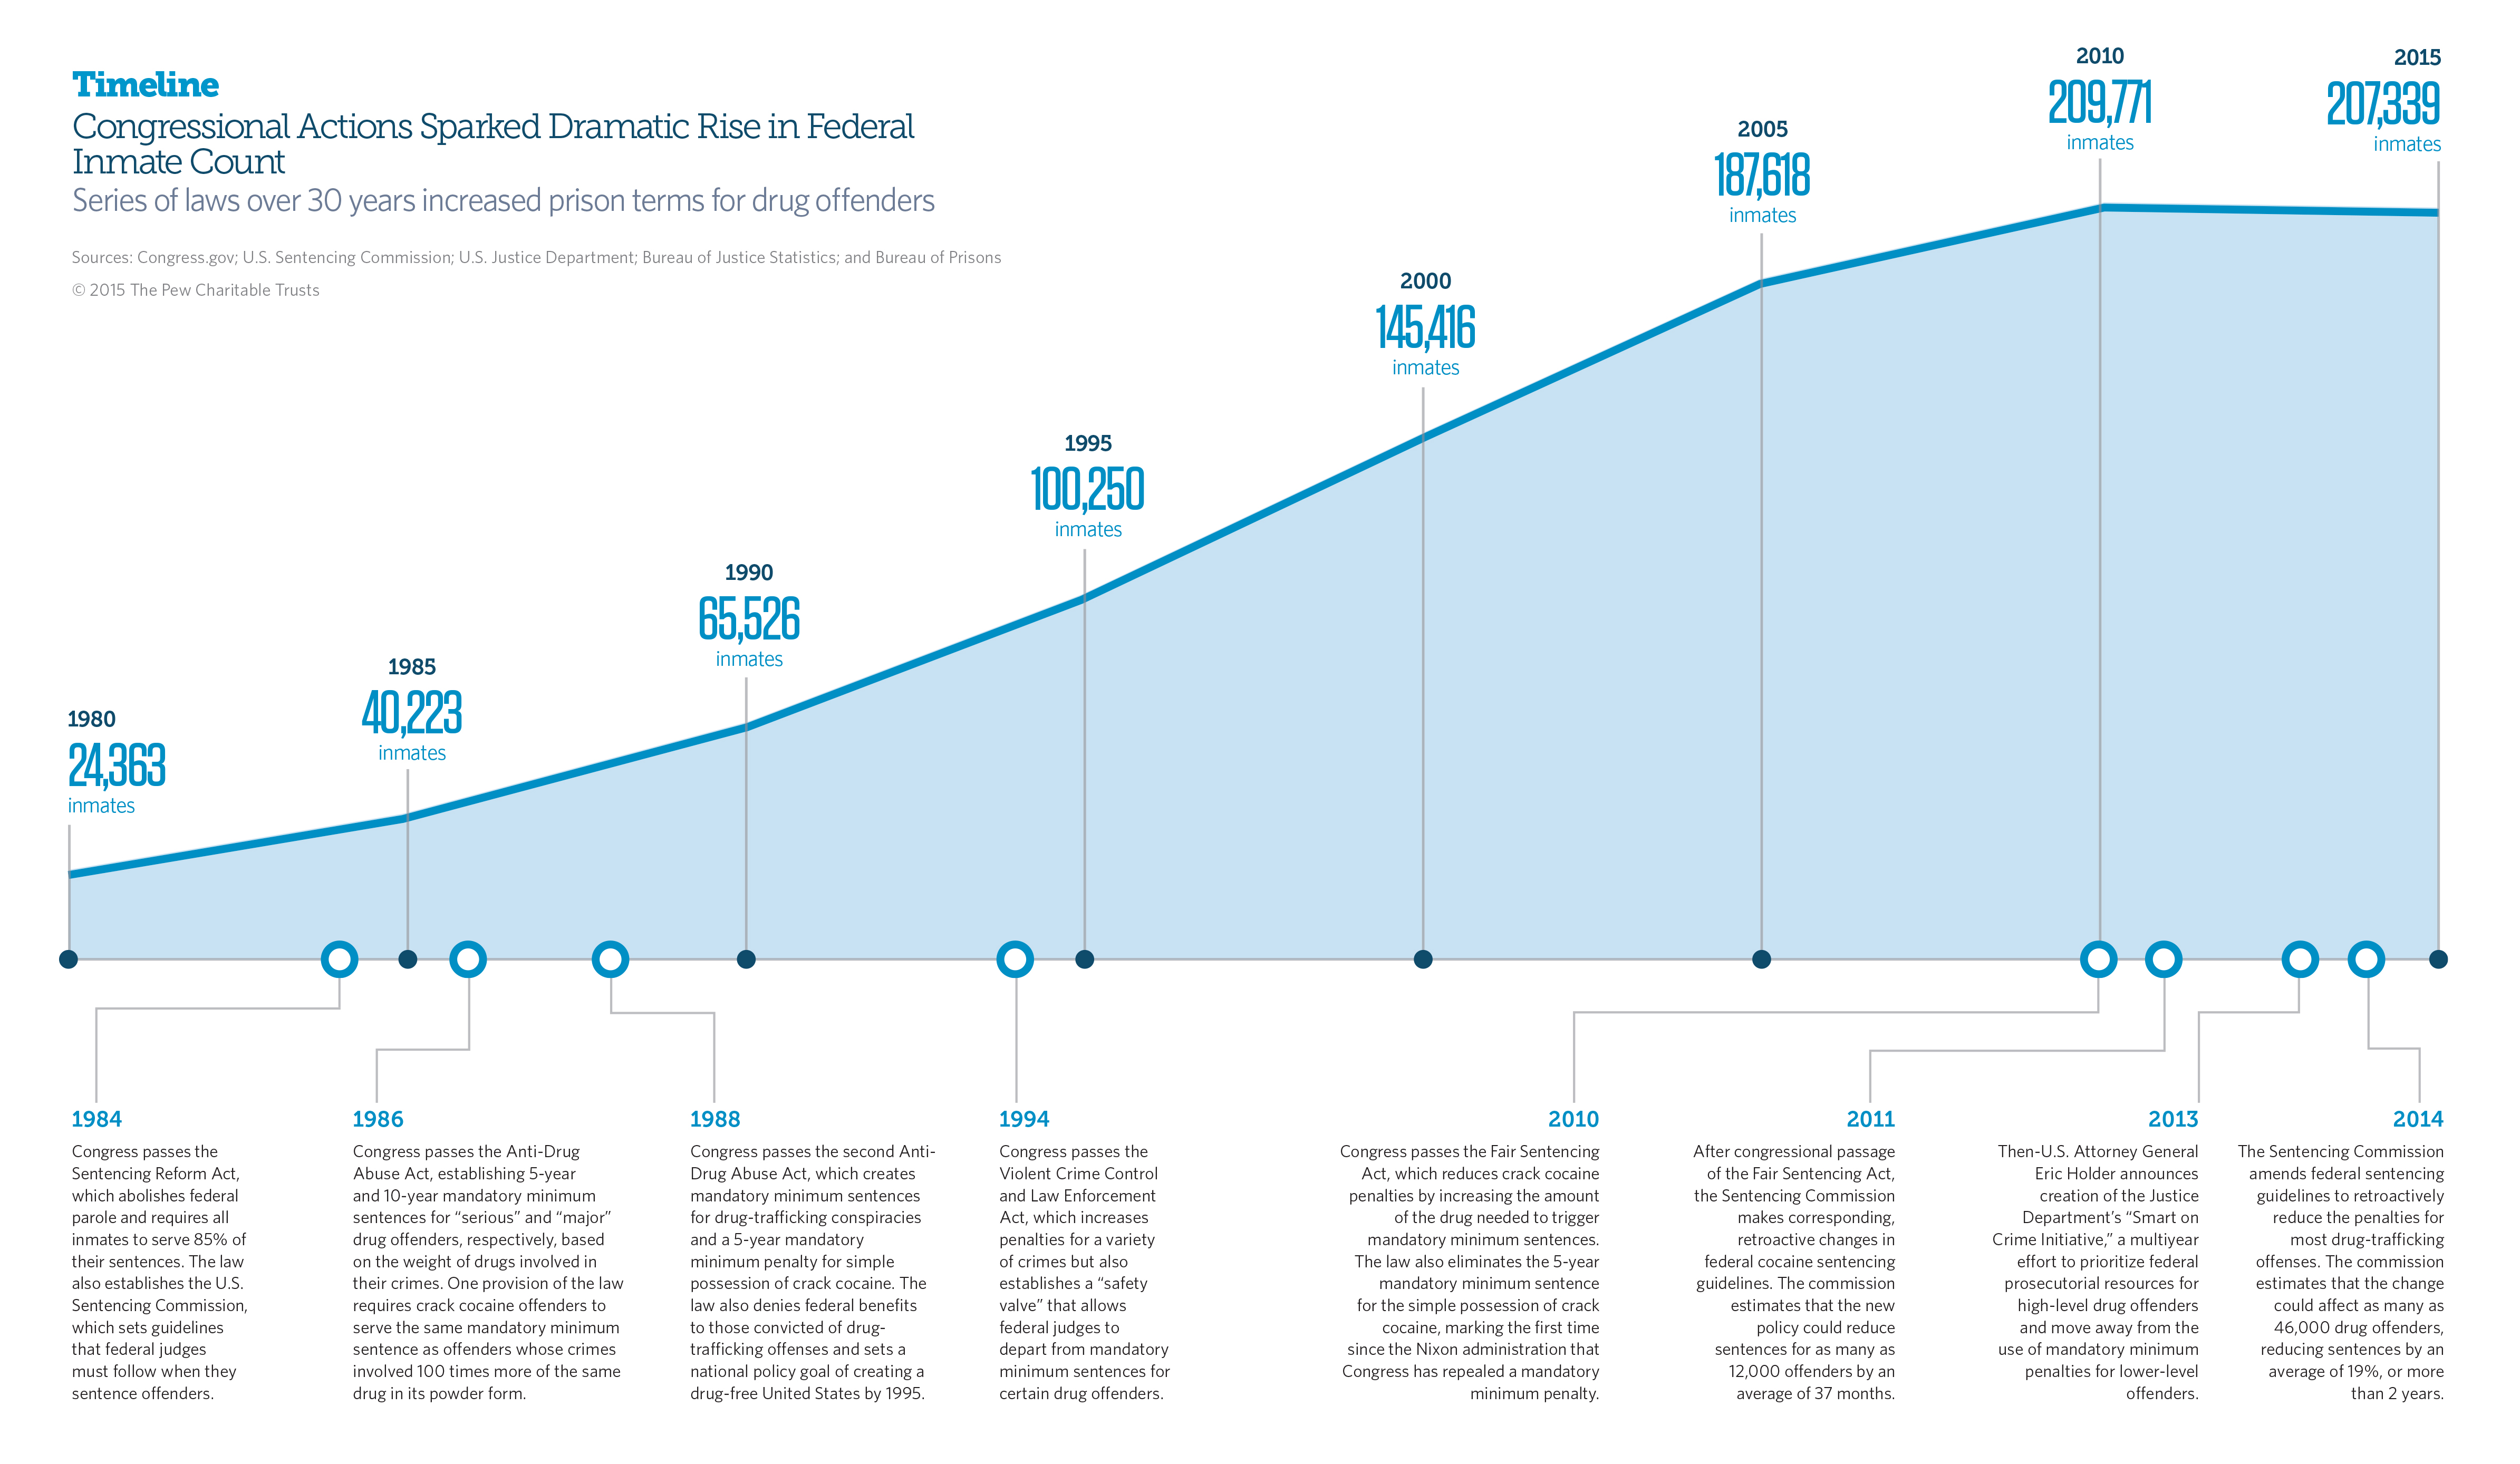
Click on the graphic to expand.
Conclusion
The federal government has a uniquely important role to play in the fight against the illegal drug trade: It is responsible for preventing the trafficking of narcotics into the United States and across state lines. In response to rising public concern about high rates of drug-related crime in the 1980s and 1990s, Congress enacted sentencing laws that dramatically increased penalties for drug crimes, which in turn sharply expanded the number of such offenders in federal prison and drove costs upward. These laws—while playing a role in the nation’s long and ongoing crime decline since the mid-1990s—have not provided taxpayers with a strong public safety return on their investment.
The availability and use of illegal drugs has increased even as tens of thousands of drug offenders have served lengthy terms in federal prisons. Recidivism rates for drug offenders have remained largely unchanged.
Meanwhile, federal sentencing laws that were designed to focus penalties on the most serious drug traffickers have resulted in long periods of imprisonment for many offenders who performed relatively minor roles in the drug trade.
In response to these discouraging trends, federal policymakers recently have made administrative and statutory revisions that have reduced criminal penalties for thousands of drug offenders while maintaining public safety and controlling costs to taxpayers.
Endnotes
- For the current figure, see “Inmate Statistics - Offenses,” Federal Bureau of Prisons, accessed June 29, 2015, http://www.bop.gov/about/statistics/statistics_inmate_offenses.jsp. For the 1980 figure, see University at Albany, Sourcebook of Criminal Justice Statistics 2003, Table 6.57, http://www.albany.edu/sourcebook/pdf/t657.pdf.
- Nathan James, The Federal Prison Population Buildup: Overview, Policy Changes, Issues, and Options (Washington: Congressional Research Service, 2014), https://www.fas.org/sgp/crs/misc/R42937.pdf.
- The Pew Charitable Trusts, “Federal Prison System Shows Dramatic Long-Term Growth” (February 2015), http://www.pewtrusts.org/~/media/Assets/2015/02/ Pew_Federal_Prison_Growth.pdf.
- Office of National Drug Control Policy, National Drug Control Strategy: Data Supplement 2014, Tables 1 and 2, https://www.whitehouse.gov/sites/default/files/ondcp/policy-and-research/ndcs_data_supplement_2014.pdf. Pew used the 1990-2012 period to capture all available yearly data.
- U.S. Sentencing Commission, Report to the Congress: Mandatory Minimum Penalties in the Federal Criminal Justice System (October 2011), Chapter 8, http://www.ussc.gov/sites/default/files/pdf/news/congressional-testimony-and-reports/mandatory-minimum-penalties/20111031-rtc-pdf/Chapter_08.pdf.
- Bureau of Justice Statistics, Federal Justice Statistics Statistical Tables Series 2005-2012, Compendium of Federal Justice Statistics Series 1984- 2004, http://www.bjs.gov/index.cfm?ty=tp&tid=65.
- U.S. Sentencing Commission, Mandatory Minimum Penalties in the Federal Criminal Justice System, Chapter 2, http://www.ussc.gov/news/congressional-testimony-and-reports/mandatory-minimum-penalties/special-report-congress.
- U.S. Sentencing Commission, Report on Cocaine and Federal Sentencing Policy, Chapter 6, http://www.ussc.gov/report-cocaine-and-federal- sentencing-policy-2.
- Federal Bureau of Investigation, Uniform Crime Reporting data tool, http://www.ucrdatatool.gov.
- U.S. Sentencing Commission, Report to the Congress: Mandatory Minimum Penalties in the Federal Criminal Justice System (October 2011), Chapter 8, 165, http://www.ussc.gov/sites/default/files/pdf/news/congressional-testimony-and-reports/mandatory-minimum-penalties/20111031-rtc-pdf/Chapter_08.pdf.
- Administrative Office of the U.S. Courts, Judicial Business of the U.S. Courts Series, Table D-5, 1980-2014, http://www.uscourts.gov/statistics-reports/analysis-reports/judicial-business-united-states-courts. The 1980 report is available in print only. In 1992, the end of the federal fiscal year changed from June 30 to Sept. 30.
- Administrative Office of the U.S. Courts, Judicial Business of the U.S. Courts Series, Table D-5, 1980-2011. The 1980 report is available in print only. Figures calculated using weighted average sentences of drug offenders and nondrug offenders. Average does not include sentences of probation. In 2012, the Administrative Office of the U.S. Courts began calculating average sentence length using median months rather than mean months. As a result, comparable historical data are available only through 2011. In 1992, the end of the federal fiscal year changed from June 30 to Sept. 30.
- University at Albany, Sourcebook of Criminal Justice Statistics 2003, Table 6.57, http://www.albany.edu/sourcebook/pdf/t657.pdf.
- “Inmate Statistics - Offenses,” Federal Bureau of Prisons, accessed June 29, 2015, http://www.bop.gov/about/statistics/statistics_inmate_offenses.jsp.
- For the 1988 figure, see Bureau of Justice Statistics, Federal Criminal Case Processing, 1982-93, Table 18, http://www.bjs.gov/content/pub/pdf/Fccp93.pdf; for the 2012 figure, see Bureau of Justice Statistics, Federal Justice Statistics 2012—Statistical Tables, Table 7.11, http://www.bjs.gov/content/pub/pdf/fjs12st.pdf. Pew used the 1988-2012 period to capture all available yearly data.
- Ibid.
- The Pew Charitable Trusts, “Federal Prison System Shows Dramatic Long-Term Growth.”
- Kamala Mallik-Kane, Barbara Parthasarathy, and William Adams, “Examining Growth in the Federal Prison Population, 1998 to 2010” (September 2012), Urban Institute, http://www.urban.org/sites/default/files/alfresco/publication-pdfs/412720-Examining-Growth-in-the-Federal-Prison-Population--to--.PDF.
- The Pew Charitable Trusts, “Federal Prison System Shows Dramatic Long-Term Growth.”
- Ibid.
- Office of National Drug Control Policy, National Drug Control Strategy: Data Supplement 2014, Tables 66, 67, and 68, https://www.whitehouse.gov/sites/default/files/ondcp/policy-and-research/ndcs_data_supplement_2014.pdf.
- Office of National Drug Control Policy, National Drug Control Strategy: Data Supplement 2014, Tables 1 and 2, https://www.whitehouse.gov/sites/default/files/ondcp/policy-and-research/ndcs_data_supplement_2014.pdf. Pew used the 1990-2012 period to capture all available yearly data.
- David Boyum and Peter Reuter, An Analytic Assessment of U.S. Drug Policy, American Enterprise Institute for Public Policy Research (2005), 57, http://www.aei.org/wp-content/uploads/2014/07/-an-analytic-assessment-of-us-drug-policy_112041831996.pdf.
- National Research Council, The Growth of Incarceration in the United States: Exploring Causes and Consequences (2014), 83, http://www.nap.edu/catalog/18613/the-growth-of-incarceration-in-the-united-states-exploring-causes.
- Mark A.R. Kleiman, “Toward (More Nearly) Optimal Sentencing for Drug Offenders,” Criminology & Public Policy 3, no. 3 (2004): 435–440, https://drive.google.com/file/d/0B6taQDF0rdAwYnJNTDU2bDVBNFU/edit.
- Ilyana Kuziemko and Steven D. Levitt, “An Empirical Analysis of Imprisoning Drug Offenders,” Journal of Public Economics 88 (2004): 2043–2066, https://www0.gsb.columbia.edu/faculty/ikuziemko/papers/kl_jpube.pdf.
- Ibid.
- U.S. Sentencing Commission, 2014 Sourcebook of Federal Sentencing Statistics, Table 12, http://www.ussc.gov/sites/default/files/pdf/research-and-publications/annual-reports-and-sourcebooks/2014/Table12.pdf.
- U.S. Sentencing Commission, Report on Cocaine and Federal Sentencing Policy, Chapter 6, http://www.ussc.gov/report-cocaine-and-federal-sentencing-policy-2.
- U.S. Sentencing Commission, Report to the Congress: Mandatory Minimum Penalties in the Federal Criminal Justice System (October 2011), Chapter 12, 350, http://www.ussc.gov/sites/default/files/pdf/news/congressional-testimony-and-reports/mandatory-minimum-penalties/20111031-rtc-pdf/Chapter_12.pdf.
- Unless otherwise indicated, all data about offender roles are drawn from U.S. Sentencing Commission, Report to the Congress: Mandatory Minimum Penalties in the Federal Criminal Justice System (October 2011), Appendix D, Figure D-2, http://www.ussc.gov/sites/default/files/pdf/news/congressional-testimony-and-reports/mandatory-minimum-penalties/20111031-rtc-pdf/Appendix_D.pdf; and Figure 8-12, 173, http://www.ussc.gov/sites/default/files/pdf/news/congressional-testimony-and-reports/mandatory-minimum-penalties/20111031-rtc-pdf/Chapter_08.pdf.
- For share of marijuana offenders considered mules or couriers, see U.S. Sentencing Commission, Report to the Congress: Mandatory Minimum Penalties in the Federal Criminal Justice System (October 2011), Appendix D, Figure D-34, http://www.ussc.gov/sites/default/files/pdf/news/congressional-testimony-and-reports/mandatory-minimum-penalties/20111031-rtc-pdf/Appendix_D.pdf.
- For share of crack cocaine offenders considered street-level dealers, see U.S. Sentencing Commission, Report to the Congress: Mandatory Minimum Penalties in the Federal Criminal Justice System (October 2011), Appendix D, Figure D-22, http://www.ussc.gov/sites/default/files/pdf/news/congressional-testimony-and-reports/mandatory-minimum-penalties/20111031-rtc-pdf/Appendix_D.pdf.
- Charles Doyle, “Federal Mandatory Minimum Sentences: The Safety Valve and Substantial Assistance Exceptions” (Washington: Congressional Research Service, 2013), https://www.hsdl.org/? view&did=746019.
- U.S. Sentencing Commission, Report to the Congress: Mandatory Minimum Penalties in the Federal Criminal Justice System (October 2011), Chapter 8, 170, http://www.ussc.gov/sites/default/files/pdf/news/congressional-testimony-and-reports/mandatory-minimum-penalties/20111031-rtc-pdf/Chapter_08.pdf.
- Bureau of Justice Statistics, Federal Justice Statistics 2012—Statistical Tables, Table 7.5, http://www.bjs.gov/content/pub/pdf/fjs12st.pdf.
- Bureau of Justice Statistics, Federal Justice Statistics/Compendium of Federal Justice Statistics Series, 1984-2012, http://www.bjs.gov/index.cfm?ty=pbtp&tid=65&iid=1. Data not available for 1987, 1991, 1992, and 2005.
- U.S. Sentencing Commission, “U.S. Sentencing Commission Votes Unanimously to Apply Amendment Retroactively for Crack Cocaine Offenses” (Dec. 11, 2007), http://www.ussc.gov/news/press-releases-and-news-advisories/december-11-2007.
- Kim Steven Hunt and Andrew Peterson, “Recidivism Among Offenders Receiving Retroactive Sentence Reductions: The 2007 Crack Cocaine Amendment” (May 2014), U.S. Sentencing Commission, http://www.ussc.gov/sites/default/files/pdf/research-and-publications/research-projects-and-surveys/miscellaneous/ 20140527_Recidivism_2007_Crack_Cocaine_Amendment.pdf.
ADDITIONAL RESOURCES

Fact Sheet

Podcast