State Personal Income Growing Slowly Since Recession
Note: These data have been updated. To see the most recent data and analysis, visit Fiscal 50.
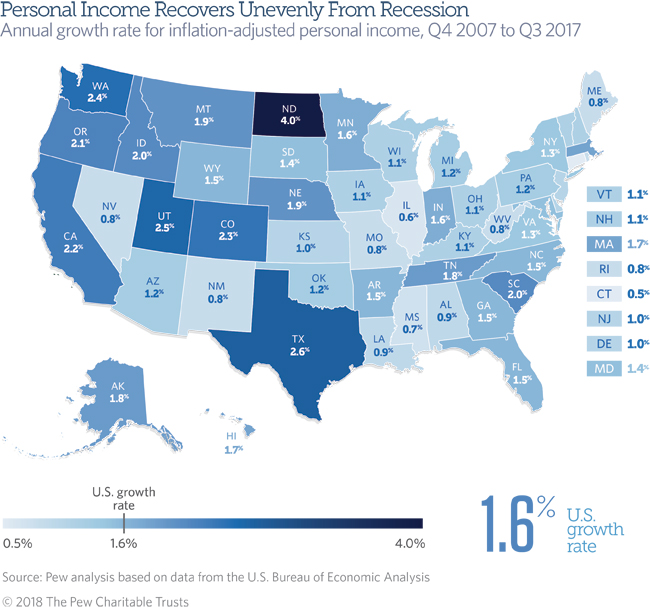
One of the longest U.S. economic expansions has lifted personal income in all states above pre-recession levels. But growth has varied, ranging from a constant annual rate of 0.5 percent in Connecticut to 4.0 percent in North Dakota. In 18 states, personal income fell over the year ending in the third quarter of 2017 as U.S. growth remained slow—less than one-fifth the rate seen three years earlier.
Since the recession began, national economic growth, as measured by personal income, has been lower than its historical pace. Estimated U.S. personal income increased by the equivalent of 1.6 percent a year from the fourth quarter of 2007 through the third quarter of 2017, compared with the equivalent of 2.6 percent a year over the past 30 years, after accounting for inflation.
States have recovered at different paces. Only in mid-2015 did the final state—Nevada—recoup its personal income losses and return to its 2007 pre-recession level, after accounting for inflation. Since the end of 2007, personal income in 17 states has grown faster than that of the nation as a whole.
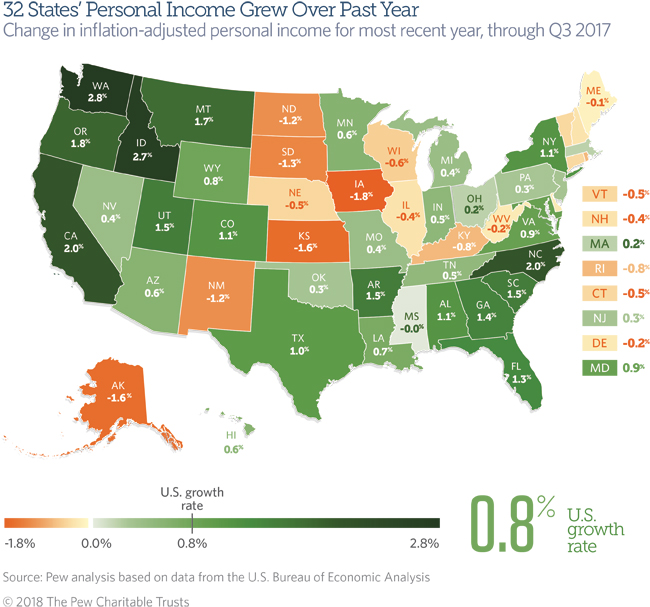
Looking at recent trends, inflation-adjusted U.S. personal income grew by a slim 0.8 percent in the third quarter of 2017 from a year earlier, compared with a peak of 4.7 percent at the end of 2014. These results are based on estimates and subject to revision, as is Pew’s ranking of growth rates for state personal income.
Focusing on earnings by industry, lingering weakness in farming was the biggest drag on national growth over the year, edging out manufacturing. In the decade since the recession began, manufacturing has been the leading detractor from national growth. Health care and social assistance made the largest positive contribution to growth over the year and since the recession began. Economists predict federal tax reform will boost U.S. economic growth in 2018.
Personal income estimates are widely used to track state economic trends. The statewide sum should not be used to describe trends for individuals and households. Trends in personal income matter to state governments because tax revenue and spending demands may rise or fall along with residents’ incomes. Comprising far more than simply employees’ wages, the measure sums up all sorts of income received by state residents, such as earnings from owning a business or investing, as well as benefits provided by employers or the government.
Trends in personal income from the recession’s onset in 2007 through the third quarter of 2017:
- North Dakota has enjoyed the fastest annualized growth (4.0 percent) since the start of the recession. However, a worldwide drop in petroleum prices has cooled its oil boom, and the state’s personal income has trended down for nearly three years.
- The next-fastest growth since late 2007 has been in Texas (2.6 percent), Utah (2.5 percent), Washington (2.4 percent), and Colorado (2.3 percent).
- Connecticut’s expansion since the end of 2007 slowed to the equivalent of 0.5 percent a year—the lowest in any state—after year-over-year drops in personal income for four straight quarters.
- The next-slowest growth since the start of the recession has been in Illinois (0.6 percent); Mississippi (0.7 percent), and Maine, Missouri, Nevada, New Mexico, Rhode Island, and West Virginia (each at 0.8 percent).
Trends in personal income for the third quarter of 2017, compared with a year earlier:
- Growth was fastest in Washington (2.8 percent), Idaho (2.7 percent), California and North Carolina (each at 2.0 percent), and Oregon (1.8 percent).
- Washington stands out as the only state that has consistently ranked among the five fastest-growing states in each of the last four quarters.
- Personal income fell in 18 states from a year earlier, with the biggest drop in Iowa (down 1.8 percent), followed by Alaska and Kansas (each down 1.6 percent), South Dakota (down 1.3 percent), New Mexico and North Dakota (each down 1.2 percent), Kentucky and Rhode Island (each down 0.8 percent), Wisconsin (down 0.6 percent), Connecticut, Nebraska, and Vermont (each down 0.5 percent), Illinois and New Hampshire (each down 0.4 percent), Delaware and West Virginia (each down 0.2 percent), Maine (down 0.1 percent), and Mississippi (just below 0.0 percent).
- Nine states stand out for recording year-over-year drops during each of the four most recent quarters: Alaska, Connecticut, Illinois, Iowa, Kansas, Nebraska, North Dakota, Rhode Island, and South Dakota.
- In 45 states, trends in personal income over the year ending in the third quarter of 2017 were weaker than growth since the start of the recession. In the other five states—Alabama, Arkansas, Idaho, North Carolina, and Washington—the one-year rate was faster than the pace since the recession began.
Trends in personal income for calendar years beginning in 2007
Personal income has fluctuated since the recession, which lasted from December 2007 to June 2009. Growth in each calendar year shows the variation that occurred from 2007 to 2016. (See the “Year by year” tab for annual results in each state between calendar years 2007 and 2016.) By contrast, constant annual rates show the steady pace that income would have to rise each year to reach its latest level.
- In 2009, the second year of the Great Recession, only one state—West Virginia—escaped without a drop in personal income.
- As the country rebounded from the recession, personal income rose in 46 states in 2010—Arizona, Delaware, Kansas, and North Carolina were the exceptions. All states saw increases in 2011, and all but Delaware and Georgia recorded gains in 2012.
- In 2013, personal income fell in 36 states, reflecting a number of taxpayers accelerating income into 2012 in anticipation of a potential federal tax hike in 2013.
- The rebound resumed over the next two years, with personal income rising in every state but Kansas in 2014, and every state but North Dakota, Oklahoma, and Wyoming in 2015.
- In 2016, personal income increased in all but 11 states. Weak earnings from sectors such as energy, farm, and manufacturing cut personal income in Alaska, Connecticut, Iowa, Kansas, Louisiana, North Dakota, Oklahoma, South Dakota, Texas, West Virginia, and Wyoming.
What is personal income?
Personal income sums up residents’ paychecks, Social Security benefits, employers’ contributions to retirement plans and health insurance, income from rent and other property, and benefits from public assistance programs such as Medicare and Medicaid, among other items. Personal income excludes capital gains.
Federal officials use state personal income to determine how to allocate support to states for certain programs, including funds for Medicaid. State governments use personal income statistics to project tax revenue for budget planning, set spending limits, and estimate the need for public services.
Growth in personal income should not be interpreted solely as wage growth; wages and salaries account for about half of U.S. personal income.
Looking at personal income per capita or state gross domestic product, which measures the value of all goods and services produced within a state, can yield different insights on state economies. So can looking at household data, which are based on a different measure of income.
Download the data to see state-by-state growth rates for personal income from 2007 through the third quarter of 2017. Visit Pew’s interactive resource Fiscal 50: State Trends and Analysis to sort and analyze data for other indicators of state fiscal health.

ADDITIONAL RESOURCES

Fact Sheet

Podcast


