States' Tax Portfolios Drive Differences in Revenue Volatility
What different tax types mean for fiscal stability
Volatility in state tax collections can pose challenges for policymakers, making it difficult to forecast revenue, craft a budget, and manage long-term priorities. Just as individual tax streams account for varying shares of revenue in each state, collections from these taxes fluctuate to differing degrees. For example, a state may experience relatively low overall tax volatility even as certain tax streams are highly volatile. Policy decisions and shifts in the economy affect these streams in different ways.
The volatility of a state’s tax portfolio can also obscure underlying economic trends affecting revenue sources. Over time, a highly volatile tax stream may account for an increasingly large or small share—because of market forces or a changing tax base—and pull overall volatility up or down. Often, these trends signal structural shifts in a state’s budget that may require new policy solutions.
Overall volatility depends on tax types and shares
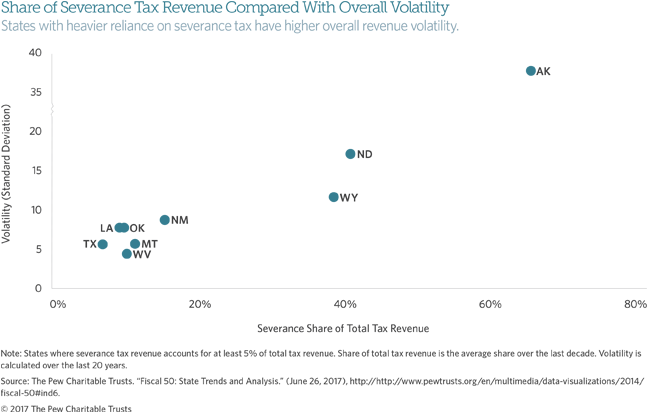
A state’s overall revenue volatility depends on both the volatility of individual tax streams and the share of revenue that each stream represents. If volatile streams make up only a small share of a state’s total revenue, overall volatility may be low or moderate. Conversely, if volatile streams make up a large portion of a state’s total revenue, overall volatility will be high. To help compare states and tax sources, The Pew Charitable Trusts calculates a “volatility score” for each tax as well as total tax revenue in a state over the past 20 years, which is a measure of the typical fluctuations above and below the average growth rate. A higher volatility score means larger swings in tax revenue from year to year. The 50-state score for overall tax revenue is 5.0 over 1997 to 2016, meaning total collections typically fluctuated 5 percentage points above and below their average growth rate over this period.
Four of the most common major revenue streams are taxes on personal income, sales, corporate income, and natural resource extraction (known as severance taxes). These taxes all exhibit different levels of volatility. Personal income and sales taxes—levied in 41 and 45 states, respectively—form the largest share of most states’ tax collections and are typically more stable year to year, with scores falling between 2.5 and 16 in Pew’s analysis. Corporate income tax and severance tax are significantly more volatile. However, they represent a significant share of total tax collections in only a handful of states.
Two natural resource states, Alaska and Texas, illustrate contrasting experiences. While both collect severance taxes, their tax portfolios are quite different, and their volatility scores reflect that. In Alaska, severance tax has been the state’s primary source of revenue over the past two decades, with its share of total tax revenue peaking at 82 percent in 2012. These collections are highly volatile, scoring a 66.6 in Pew’s volatility analysis. Because Alaska has relied so heavily on severance tax revenue, the state’s total tax revenue is also highly volatile. With an overall volatility score of 37.6 over this time frame, Alaska has by far the highest revenue volatility in the country.
In Texas, severance tax had a volatility score of 40.0 between 1997 and 2016. However, severance revenue only accounted for an average of 7.2 percent of the state’s overall revenue over the past decade. As a result, Texas’ overall revenue volatility was only 5.9, which ranks it near the middle of the 50 states.
Similarly, corporate income tax collections, though volatile, often do not substantially affect overall revenue volatility. In Utah, corporate income tax revenue between 1997 and 2016 had a volatility score of 25.7 but represented only an average of 5.2 percent of overall revenue over the past 10 years. Because nearly 75 percent of the state’s revenue came from less-volatile personal income and sales taxes, overall volatility for Utah was only 6.5—far lower than that of corporate tax volatility alone.
Changes in tax shares over time can drive the evolution of a state’s tax volatility
Assessing individual tax streams can also illuminate underlying trends that are driving changes in tax volatility. For example, the growth of severance tax receipts has dramatically affected tax collections and revenue volatility in some natural resource states. In the past two decades, North Dakota has benefited from successive windfalls driven by oil and gas extraction and production. As a result, the state has seen a spike of over 40 percentage points in its severance tax revenue as a share of total revenue, from 12 percent in 1996 to a high of 54 percent in 2014. In contrast, the shares of personal income and sales tax revenue—the state’s other two major, and much less volatile, tax streams—fell below the severance tax share in the late 2000s. With severance tax collections as North Dakota’s largest and most unpredictable revenue stream—with a volatility score of 34.1—the state currently ranks second in overall revenue volatility.
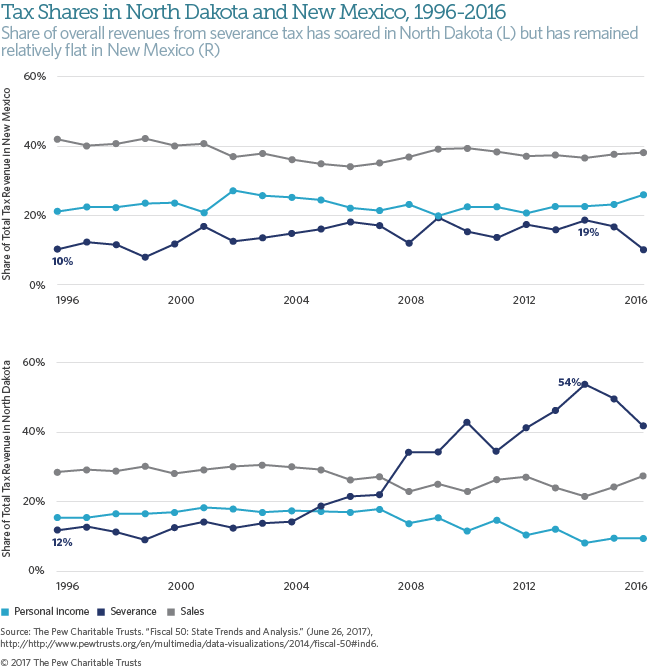
In contrast, while severance tax collections in New Mexico are as volatile as collections in North Dakota, they have not grown as quickly as a share of total revenue. Although shares in the two states were similar in 1996, the severance tax share grew to only 19 percent in New Mexico by 2014—against 54 percent in North Dakota. Furthermore, personal income and sales tax remain the two biggest tax streams in New Mexico. As a result, the volatility score of the state’s overall tax portfolio is more than 7 percentage points lower than that of North Dakota. Recognizing the extraordinary growth as well as the volatile and finite nature of severance tax revenue, North Dakota established a sovereign wealth fund in 2010 to capture these revenue peaks and create a perpetual source of state revenue.
Less volatile personal income and sales tax revenue still poses challenges
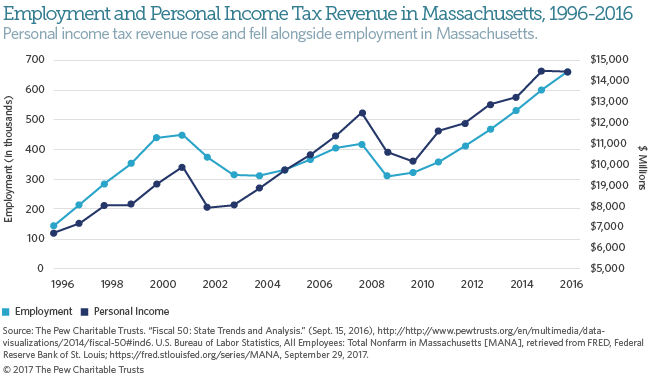
Personal income tax, levied in 41 states, is a less volatile tax stream for most states. Nevertheless, its ups and downs are directly tied to a state’s economic condition through employment. Taxable income falls during recessions, leading to bigger revenue shortfalls just as demand rises for public programs such as Medicaid. Certain components of personal income tax amplify these swings. For example, revenue from taxes on capital gains income is closely tied to market fluctuations, which results in revenue surges during expansions and dramatic revenue declines during recessions. Massachusetts was the first state to tie deposits into its rainy day fund to volatility in capital gains tax revenue to build up reserves as well as limit spending that relied on a highly unpredictable revenue source. After it adopted this rule, the state’s Commonwealth Stabilization Fund more than doubled in the years after the Great Recession—from $670 million to almost $1.7 billion.
General sales tax, like personal income, is a typically less volatile revenue source that accounts for a relatively large share of states’ tax collections. However, low volatility does not necessarily translate to budget stability. On the whole, sales tax revenue growth has slowed significantly since the Great Recession, which poses a challenge for states that depend on this source to fund a large portion of their expenditures. Revenue volatility also depends on the scope of the tax base. Some states only tax select consumer goods, others do not tax services, and most states do not tax online sales even though e-commerce has accounted for an increasing share of the market. For states that have long relied on sales tax revenue, examining the underlying factors that drive revenue performance is necessary to understand the overall and long-term stability of their tax portfolio.
Volatility is constantly changing
Measuring the historic volatility of a state’s tax portfolio provides a useful measure of how variable revenue has been over a fixed period. In the case of Pew’s Fiscal 50 revenue volatility indicator, the volatility score is calculated over the past 20 years. Studying past revenue performance can help states craft policy responses and ensure that budgets are balanced. However, each state’s revenue experience changes over time. Policymakers should therefore seek to better understand the drivers of revenue volatility and regularly reevaluate their strategies to manage revenue fluctuations. By closely examining different tax streams and assessing how they have evolved over time, states can mitigate revenue volatility as well as better anticipate future fiscal challenges.

ADDITIONAL RESOURCES

Fact Sheet

Podcast


