Despite Slow Growth, Tax Revenue Has Recovered in 31 States
Note: These data have been updated. To see the most recent data and analysis, visit Fiscal 50
Tax revenue has recovered slowly and unevenly after falling in every state during the Great Recession. By the first quarter of 2016, tax collections had bounced back in 31 states after accounting for inflation. But amid inconsistent growth, receipts had slumped in 17 states at the start of the year.
Nationally, total state tax revenue recovered in mid-2013 from losses in the recession that ended in 2009. In the first quarter of 2016, states collectively took in 6.5 percent more tax revenue than they did in the third quarter of 2008 before receipts plunged in the recession, after accounting for inflation and seasonal fluctuations.
But the national trend masks how widely recovery has varied across the states. In eight of the 31 states in which tax revenue had rebounded by the first quarter of 2016, receipts were more than 15 percent higher than at their inflation-adjusted peak before or during the recession. Conversely, collections in four of the 19 states with below-peak tax revenue were down 15 percent or more, after adjusting for inflation.
Although total state tax revenue rose for the seventh straight quarter at the beginning of 2016, state-by-state growth trends were mixed. In 17 states, tax collections fell in the first quarter of 2016, including in eight states that have recovered from their recession-era losses. Besides tax revenue fallout from a steep drop in oil prices, other reasons for tax declines included a weak stock market, state tax cuts, and growth that was slower than inflation.
State results differ dramatically because of variations in economic conditions, population changes, and tax policy choices since the recession. Among states in which tax revenue has recovered, some such as California and Minnesota raised taxes after the recession, contributing to gains. Among states in which receipts remain below their previous peaks, some such as Florida and Ohio chose to cut taxes since the recession.
Source: Pew analysis is based on the U.S. Census Bureau’s quarterly tax revenue data, as adjusted by the Nelson A. Rockefeller Institute of Government.
State highlights
A comparison of each state’s tax receipts in the first quarter of 2016 with its peak quarter of revenue before the end of the recession, averaged across four quarters and adjusted for inflation, shows:
- Among the 31 states where tax revenue has recovered, eight have rebounded by 15 percent or more: North Dakota (52.5 percent), Iowa (27.6 percent), Minnesota (21.5 percent), Colorado (20.3 percent), California (17.0 percent), Maryland (16.6 percent), Oregon (16.2 percent), and Hawaii (15.5 percent).
- In the first quarter of 2016, three states moved for the first time onto the list of states in which tax revenue has recovered—Kansas (0.4 percent), Missouri (0.9 percent), and New Hampshire (0.9 percent); Montana (2.6 percent below peak) fell off the list. Kansas’ tax revenue would still be below its peak, however, if not for a 2014 technical change that began redirecting property tax dollars for schools through the state treasurer before distribution.
- Alaska was furthest below its peak, down 92.8 percent. This means the state collected only 7 percent as much tax revenue as it did at its short-lived peak in 2008, when a new state oil tax coincided with record-high crude prices. Without personal income or general sales taxes, Alaska is highly dependent on severance and other oil-related tax revenue, which began falling as its oil production waned even before worldwide crude prices dropped in 2014.
- Also down more than 15 percent from their previous peaks, which occurred more than seven years ago, were Wyoming (-28.4 percent), Louisiana (-18.3 percent), and Florida (-17.8 percent).
- In the most recent quarter, tax revenue in six of the top 10 oil-producing states registered a decline amid low oil prices: Colorado, New Mexico, North Dakota, Oklahoma, Texas, and Wyoming.
- The most dramatic drop since the 2014 plunge in oil prices has been in North Dakota, where tax collections in the first quarter of 2016 were 52.5 percent above their highest point during the recession, compared with 124.5 percent above at the end of 2014. Still, North Dakota remained the leader among all states in tax revenue growth since the recession.
- Eleven other states also saw declines in the first quarter of 2016: Alabama, Illinois, Michigan, Mississippi, Montana, Nebraska, New Jersey, New York, Ohio, Vermont, and West Virginia.
- Five states have experienced at least a full year of declining tax revenue: Illinois and oil-producers New Mexico, North Dakota, Oklahoma, and Texas. The lengthiest slide—of six straight quarters—was in Illinois, where a temporary personal income tax hike expired in January 2015.
- West Virginia’s tax revenue fell to its lowest point in more than five years (4.5 percent below its pre-recession peak) amid weak coal and natural gas prices.
- Two states with receipts well above peak—Colorado (20.3 percent) and Oregon (16.2 percent)—have constitutional caps on tax revenue growth that can trigger refunds to taxpayers. Both issued such refunds for 2015.
Trends
The increasing number of states to regain their tax revenue levels shows that the effects of the Great Recession are receding—but slowly. By this time after the 2001 recession, which was shorter and less severe, tax collections had rebounded in all but one state—Michigan.
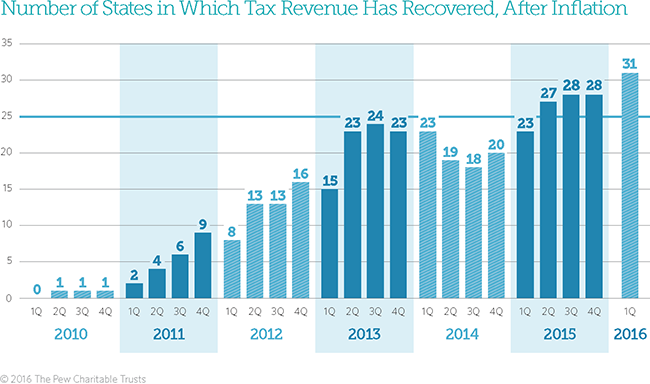
In 2010, North Dakota was the first state to surpass its recession-era peak, followed by Vermont, then Arkansas and New York by mid-2011. Tax receipts were above peak in nine states at the end of calendar 2011; 16 states at the end of 2012; 23 states at the end of 2013; 20 states at the end of 2014; and 28 states at the end of 2015.
Combined, the 50 states now have the equivalent of 6.5 cents more in purchasing power for every $1 they collected at their 2008 peak. Even states with extra purchasing power since the recession, though, can face budget pressures because of increased expenditures due to population growth, changes in Medicaid costs and enrollment, and deferred or new needs for schools, safety-net programs, corrections, employee salaries and pensions, and road maintenance and construction.
Revenue outlook
Preliminary figures indicate that total state tax revenue fell in the second quarter of 2016, the end of the last budget year for most states, according to the Nelson A. Rockefeller Institute of Government. Based on states’ own forecasts, Rockefeller predicted that total state tax revenue would grow—though at a slow pace—in fiscal 2017, the current budget year that began in July in most states.
State budgets do not adjust revenue for inflation, so tax revenue totals in states’ own documents will appear higher than or closer to pre-recession totals. Without adjusting for inflation, 50-state tax revenue was 18.9 percent above peak and tax collections had recovered in 45 states—all except Alaska, Florida, Louisiana, Oklahoma, and Wyoming¬—as of the first quarter of 2016. Unadjusted figures do not take into account changes in the price of goods and services.
Adjusting for inflation is just one way to evaluate state tax revenue growth. Different insights would be gained by tracking revenue relative to population growth or state economic output.
Download the data to see individual state trends from the first quarter of 2006 to the first quarter of 2016. Visit Pew's interactive resource Fiscal 50: State Trends and Analysis to sort and analyze data for other indicators of state fiscal health.


America’s Overdose Crisis
Sign up for our five-email course explaining the overdose crisis in America, the state of treatment access, and ways to improve care
Sign up

Fiscal 50: State Trends and Analysis
Sort and chart data about key fiscal and economic trends in the 50 states, and read Pew's insights.
ADDITIONAL RESOURCES

Fact Sheet

Podcast