Federal Funds Supply 30.8 Cents of Each State Revenue Dollar
Note: These data have been updated. To see the most recent data and analysis, visit Fiscal 50
The share of states’ revenue made up by federal dollars was largely unchanged in fiscal year 2014 even as expanded Medicaid grants began to flow to some states. The federal government provided 30.8 percent of 50-state revenue, a slight increase from 30.5 percent a year earlier.
Fiscal 2014 saw the largest group of states with an increase in their reliance on federal dollars since fiscal 2010, when U.S. economic stimulus funds swelled the federal portion of revenue in all 50 states after the Great Recession. The share rose in 30 states in fiscal 2014, which included the first six months of enhanced federal aid to states that expanded their Medicaid health insurance programs under the Patient Protection and Affordable Care Act.
Federal funds to states rose 4.5 percent in fiscal 2014, outpacing overall revenue growth of 3.2 percent, but not enough to markedly boost the federal slice of states’ revenue. The increase in federal funding was due, in part, to the first wave of Medicaid expansion, in which the U.S. government agreed to reimburse states that chose to extend health coverage to previously ineligible low-income adults for 100 percent of the costs through 2016, gradually dropping to 90 percent by 2020. Health care grants, and particularly Medicaid, have been the main driver of increases in federal funding to states in recent years. States also receive funds for a range of other programs, including education and training, and transportation. (See "Federal Spending Decisions Affect State Budgets.")
At 30.8 percent, the federal share of 50-state revenue in fiscal 2014 was within a historical range of about one-quarter to one-third, according to data going back more than 50 years, and above its 10-year pre-recession average of 28.5 percent.
State highlights
Federal shares vary across the country. Fiscal 2014 data show:
- Of 25 states that chose to expand Medicaid by June 2014, the end of the fiscal year for most states, 18 saw a rise in the federal share of their revenue compared with the previous year.
- Seven Medicaid expansion states did not see a rise, either because their federal revenue dropped while nonfederal revenue held steady or increased, or because federal revenue increases were eclipsed by even larger jumps in nonfederal sources.
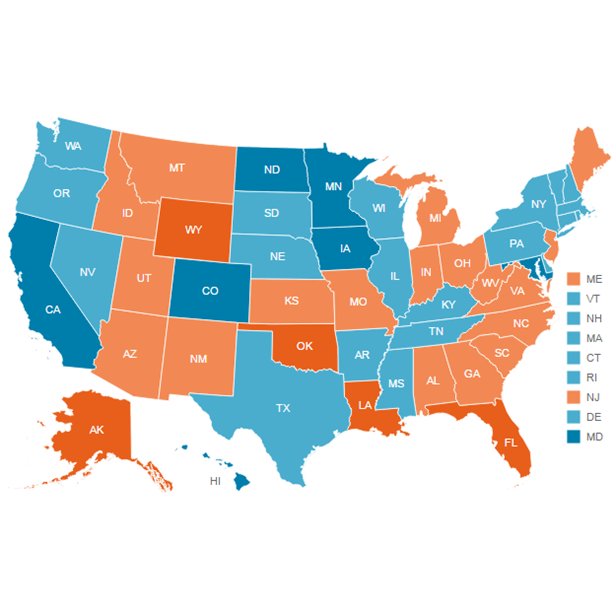
- Mississippi had the largest proportion of revenue from federal dollars at 40.9 percent, and North Dakota had the smallest, 16.8 percent.
- Mississippi and Louisiana were the only states in which federal funds made up more than 40 percent of state revenue. Federal dollars accounted for 30 to 39.9 percent in 29 states, and 16 to 29.9 percent in the remaining 19.
- In nine states, the percentage of revenue from federal funds was below its 10-year pre-recession average. The greatest drop was in North Dakota, which has experienced an oil boom. The federal share of North Dakota’s revenue averaged 34.4 percent before the recession but was 17.7 percentage points below that threshold in fiscal 2014. The next-biggest drops were in Wyoming (3.8 percentage points), Kansas (2.8 points), and South Carolina (1.7 points).
- Among the 41 states where the federal shares exceeded their 10-year pre-recession averages, Kentucky’s was most above its average—by 7.5 percentage points. The next-biggest increases were in Delaware (7.4 points), Florida (6.7 points), and Michigan (6.3 points).
Federal dollars remained the second-largest source of states’ revenue in fiscal 2014, accounting for approximately $536 billion, or about one-third, of the $1.7 trillion collected by state governments. Tax collections are states’ leading revenue generator and reached $866 billion in fiscal 2014. In addition to taxes and federal funds, states’ revenue includes money such as public university tuition, tolls, and lottery income.
Federal dollars as a share of state revenue hit a high of 35.5 percent in fiscal 2010—the greatest portion in at least 50 years—driven by an influx of U.S. stimulus funds and reduced state tax collections in the wake of the Great Recession. Declines in the federal share after 2010 reflected both the final phaseout of temporary economic stimulus funds and the recovery of states’ tax collections. Changes in either revenue source affect the ratio of federal to total dollars.
The federal share of state revenueindicator measures the combined effects of swings in state and federal funds. A higher or lower percentage does not necessarily indicate a problem for state budgets.
Download the data to see individual state trends. Visit Pew’s interactive resource Fiscal 50: State Trends and Analysis to sort and analyze data for other indicators of state fiscal health.
Analysis by Anne Stauffer and Justin Theal


