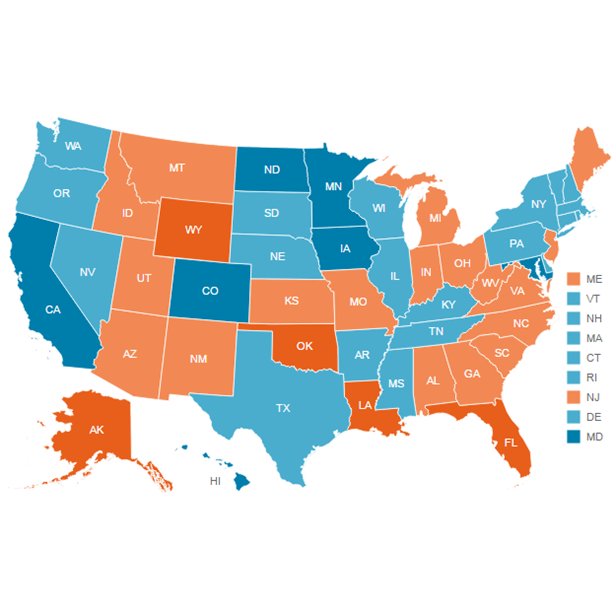
Employment Rates Creep Closer to Pre-Recession Levels
These data have been updated. To see the most recent data and analysis, visit Fiscal 50.
The U.S. employment rate for adults of prime working age rose in 2015, extending a now four-year growth trend. But even with those gains, the percentage of 25- to 54-year-olds with a job in 2015 clearly remained lower than before the Great Recession, nationally and in 22 states.
The employment-to-population ratio for 25- to 54-year-olds, which measures the share of people in their prime working years who have jobs, rose incrementally in 2015, an improvement that can help both household and state finances.
Nationwide, an average of 77.2 percent of prime-working-age adults were employed in 2015, up from lows of about 75 percent after the 2007-09 recession. In addition, more states moved closer to pre-recession levels on this measure. In 2015, 22 states had rates below 2007 levels by statistically significant amounts, down from 28 in 2014, 34 in 2013, and 37 in 2012.
However, more than six years since the downturn ended, the labor market had yet to completely recover, after accounting for population changes. In 2015, the U.S. employment-to-population ratio for prime-working-age adults was 2.7 percentage points below 2007’s level of 79.9 percent. The difference means that for every 100 adults in this age group, 2.7 fewer had jobs in 2015 than before the recession.
State highlights
A state-by-state comparison of the difference in the employment-to-population ratio for 25- to 54-year-olds between 2007 and 2015 shows:
- Among the 22 states with statistically significant differences in their employment rates, the largest difference was in New Mexico. For every 100 prime-working-age New Mexicans, 7.2 fewer were employed.
- Employment rates were lower in an additional 26 states but not by statistically significant amounts, so it is unclear whether their rates had recovered.
- Iowa’s and Michigan’s rates were higher than in 2007, by 1.1 and 0.2 percentage points, respectively. However, the differences were not statistically significant.
- In 2015, seven states fell off the 2014 list of those with statistically significant differences in their employment rates — Kansas, Mississippi, Missouri, Oregon, Pennsylvania, Rhode Island, and South Carolina. This means their rates today are probably closer to their pre-recession levels than they were last year. Elsewhere, Colorado moved onto the list of states with statistically significant differences in employment rates.
How employment affects state ledgers
Economic conditions, including employment, are major drivers of state finances. Changes in employment rates among adults in their prime working years can affect both sides of a state’s budget ledger.
- Revenue: Paychecks help generate individual income tax dollars and fuel consumer spending, which produces tax revenue from sales and business income.
- Expenditures: Unemployed people frequently need more services such as Medicaid and other safety-net programs, which can increase states’ costs.
A rebound in employment rates may provide some relief to states that have experienced budget pressures in recent years. According to Pew’s Fiscal 50 research, inflation-adjusted tax receipts in 29 states have bounced back from drops during the Great Recession. However, most states have smaller financial cushions than they did before the recession.
What is the employment-to-population ratio?
Although unemployment figures receive substantial media attention, many economists also track the employment-to-population ratio because it provides a broader view of labor market conditions. The unemployment rate, for example, excludes people who are not looking for jobs, but the employment rate captures this group in its measurement of population.
Focusing on 25- to 54-year-olds reduces the distortion of employment trends resulting from demographic effects such as older and younger workers’ choices regarding retirement or full-time education.
Another gauge of employment trends is the labor force participation rate. While the employment-to-population ratio tracks people who have jobs, the labor force participation rate measures people with jobs and those actively looking for work.
A statistically significant decrease or increase indicates a high level of confidence that there was a true change in the employment rate. Changes that are not statistically significant offer less certainty and could be the result of variations in sampling or other methods used to produce employment estimates. Without additional testing for statistical significance, caution should be exercised when comparing changes in employment rates among states.
Download the data to see individual state trends. Visit The Pew Charitable Trusts’ interactive resource Fiscal 50: State Trends and Analysis to sort and analyze data for other indicators of state fiscal health.


