Despite Growth, Tax Revenue Has Yet to Recover in 27 States
These data have been updated. To see the most
recent data and analysis, visit Fiscal 50.
Nationally, total state tax revenue recovered two years ago from its plunge in the Great Recession, but the state-by-state picture is far more mixed. Adjusted for inflation, tax receipts in 27 states had not fully rebounded by the first quarter of 2015.
Overall, states collected 4 percent more tax revenue in the first quarter of 2015 than they did in the third quarter of 2008, just before receipts plummeted midway through the recession, after accounting for inflation and seasonal fluctuations. It was the eighth straight quarter in which 50-state tax revenue exceeded its 2008 peak.
This means that states collectively had four additional cents of purchasing power for every dollar’s worth that they had in 2008.
But the 50-state total masks how unevenly revenue is recovering. Almost six years after the recession’s end, 27 states were still collecting less in real terms than at their individual peaks before or during the recession. In seven states, tax revenue was down 10 percent or more from those peaks.
Tax revenue trends reflect economic changes as well as the effects of tax policy decisions. For example, tax revenue has recovered in states such as California, Illinois, and Minnesota, which raised taxes after the recession. Collections remain below their previous peak in states such as Florida, Kansas, North Carolina, Ohio, and Wisconsin, which cut taxes or fees since the recession.
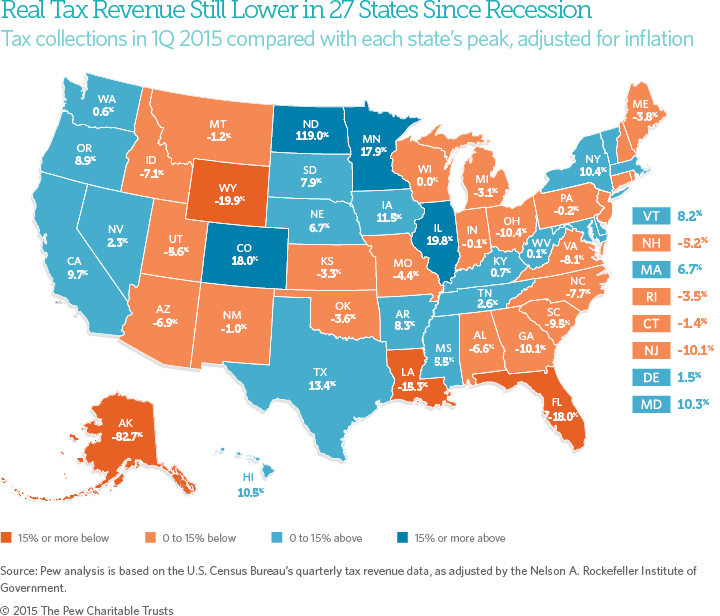
A comparison of each state’s tax receipts in the first quarter of 2015 with its peak quarter of revenue before the end of the recession, averaged across four quarters and adjusted for inflation, shows:
- Alaska was furthest from its peak, down 82.7 percent. This was its lowest point since a short-lived windfall in 2008, when a new state oil tax coincided with record-high crude prices. As oil production has waned, the state has seen revenue decline for the past nine quarters, even before a steep drop in worldwide crude prices.
- Three other states’ receipts also were down more than 15 percent from their prior peaks: Wyoming (-19.9 percent), Florida (-18 percent), and Louisiana (-15.3 percent).
- North Dakota, buoyed by an oil boom, continued to outpace all states with tax receipts 119 percent above their highest point during the recession. The next largest rebounds since the downturn were in Illinois (19.8 percent), Colorado (18 percent), and Minnesota (17.9 percent).
- Amid falling oil prices, only three of the top 12 oil-producing states registered a decline from last quarter’s tax revenue levels: Alaska, Louisiana, and North Dakota. In total, seven states’ levels declined from last quarter; the other four were Illinois, Nebraska, Ohio, and South Dakota.
- For the first time, Washington moved onto the list of states where tax revenue has recovered from the recession, with receipts 0.6 percent above their prior peak. Indiana fell off the list after revised data showed it was still 0.1 percent below its previous high.
- Two states with receipts well above peak—Colorado (18 percent) and Oregon (8.9 percent)—may not keep all of the tax revenue they collected in fiscal 2015. Both have constitutional caps on tax revenue growth that can trigger refunds to taxpayers.
Total 50-state tax revenue has hovered above its 2008 high mark—even though most states had below-peak receipts—largely because of the recovery of collections in four states with large tax bases: California, Illinois, New York, and Texas. If those states were excluded, overall tax revenue still would fall short of its 2008 level.
Looking ahead, preliminary figures for April through June 2015 show increases in nationwide estimates of personal income, corporate income, sales, and total tax revenue, according to the Nelson A. Rockefeller Institute of Government. However, tax collections in the second half of 2015 could be susceptible to stock market declines.
As states regain fiscal ground lost in the recession, policymakers face pressure to catch up on investments and spending that were postponed because of the downturn. That may be more difficult in states where tax revenue remains below its previous peak. But even a return to peak levels can leave states with little extra to make up for cuts in federal aid or to pay for costs associated with population increases, growth in Medicaid enrollment, deferred needs, and accumulated debts.
State budgets do not adjust revenue for inflation, so tax collections may appear closer to prerecession totals in those documents. Without adjusting for inflation, 50-state quarterly tax revenue was 14.7 percent above peak, and tax collections had recovered in 44 states as of the first quarter of 2015. Unadjusted figures do not take into account changes in the price of goods and services.
Adjusting for inflation is just one way to evaluate state tax revenue growth. Different insights would be gained by tracking revenue relative to population growth or state economic output.
Download the data to see individual state trends from the first quarter of 2006 to the first quarter of 2015. Visit The Pew Charitable Trusts’ interactive resource Fiscal 50: State Trends and Analysis to sort and analyze data for other indicators of state fiscal health.


America’s Overdose Crisis
Sign up for our five-email course explaining the overdose crisis in America, the state of treatment access, and ways to improve care
Sign up

Fiscal 50: State Trends and Analysis
Sort and chart data about key fiscal and economic trends in the 50 states, and read Pew's insights.
ADDITIONAL RESOURCES

Fact Sheet

Podcast


