Medicaid Consumes Growing Slice of States' Dollars
These data have been updated. To see the most recent data and analysis, visit Fiscal 50.
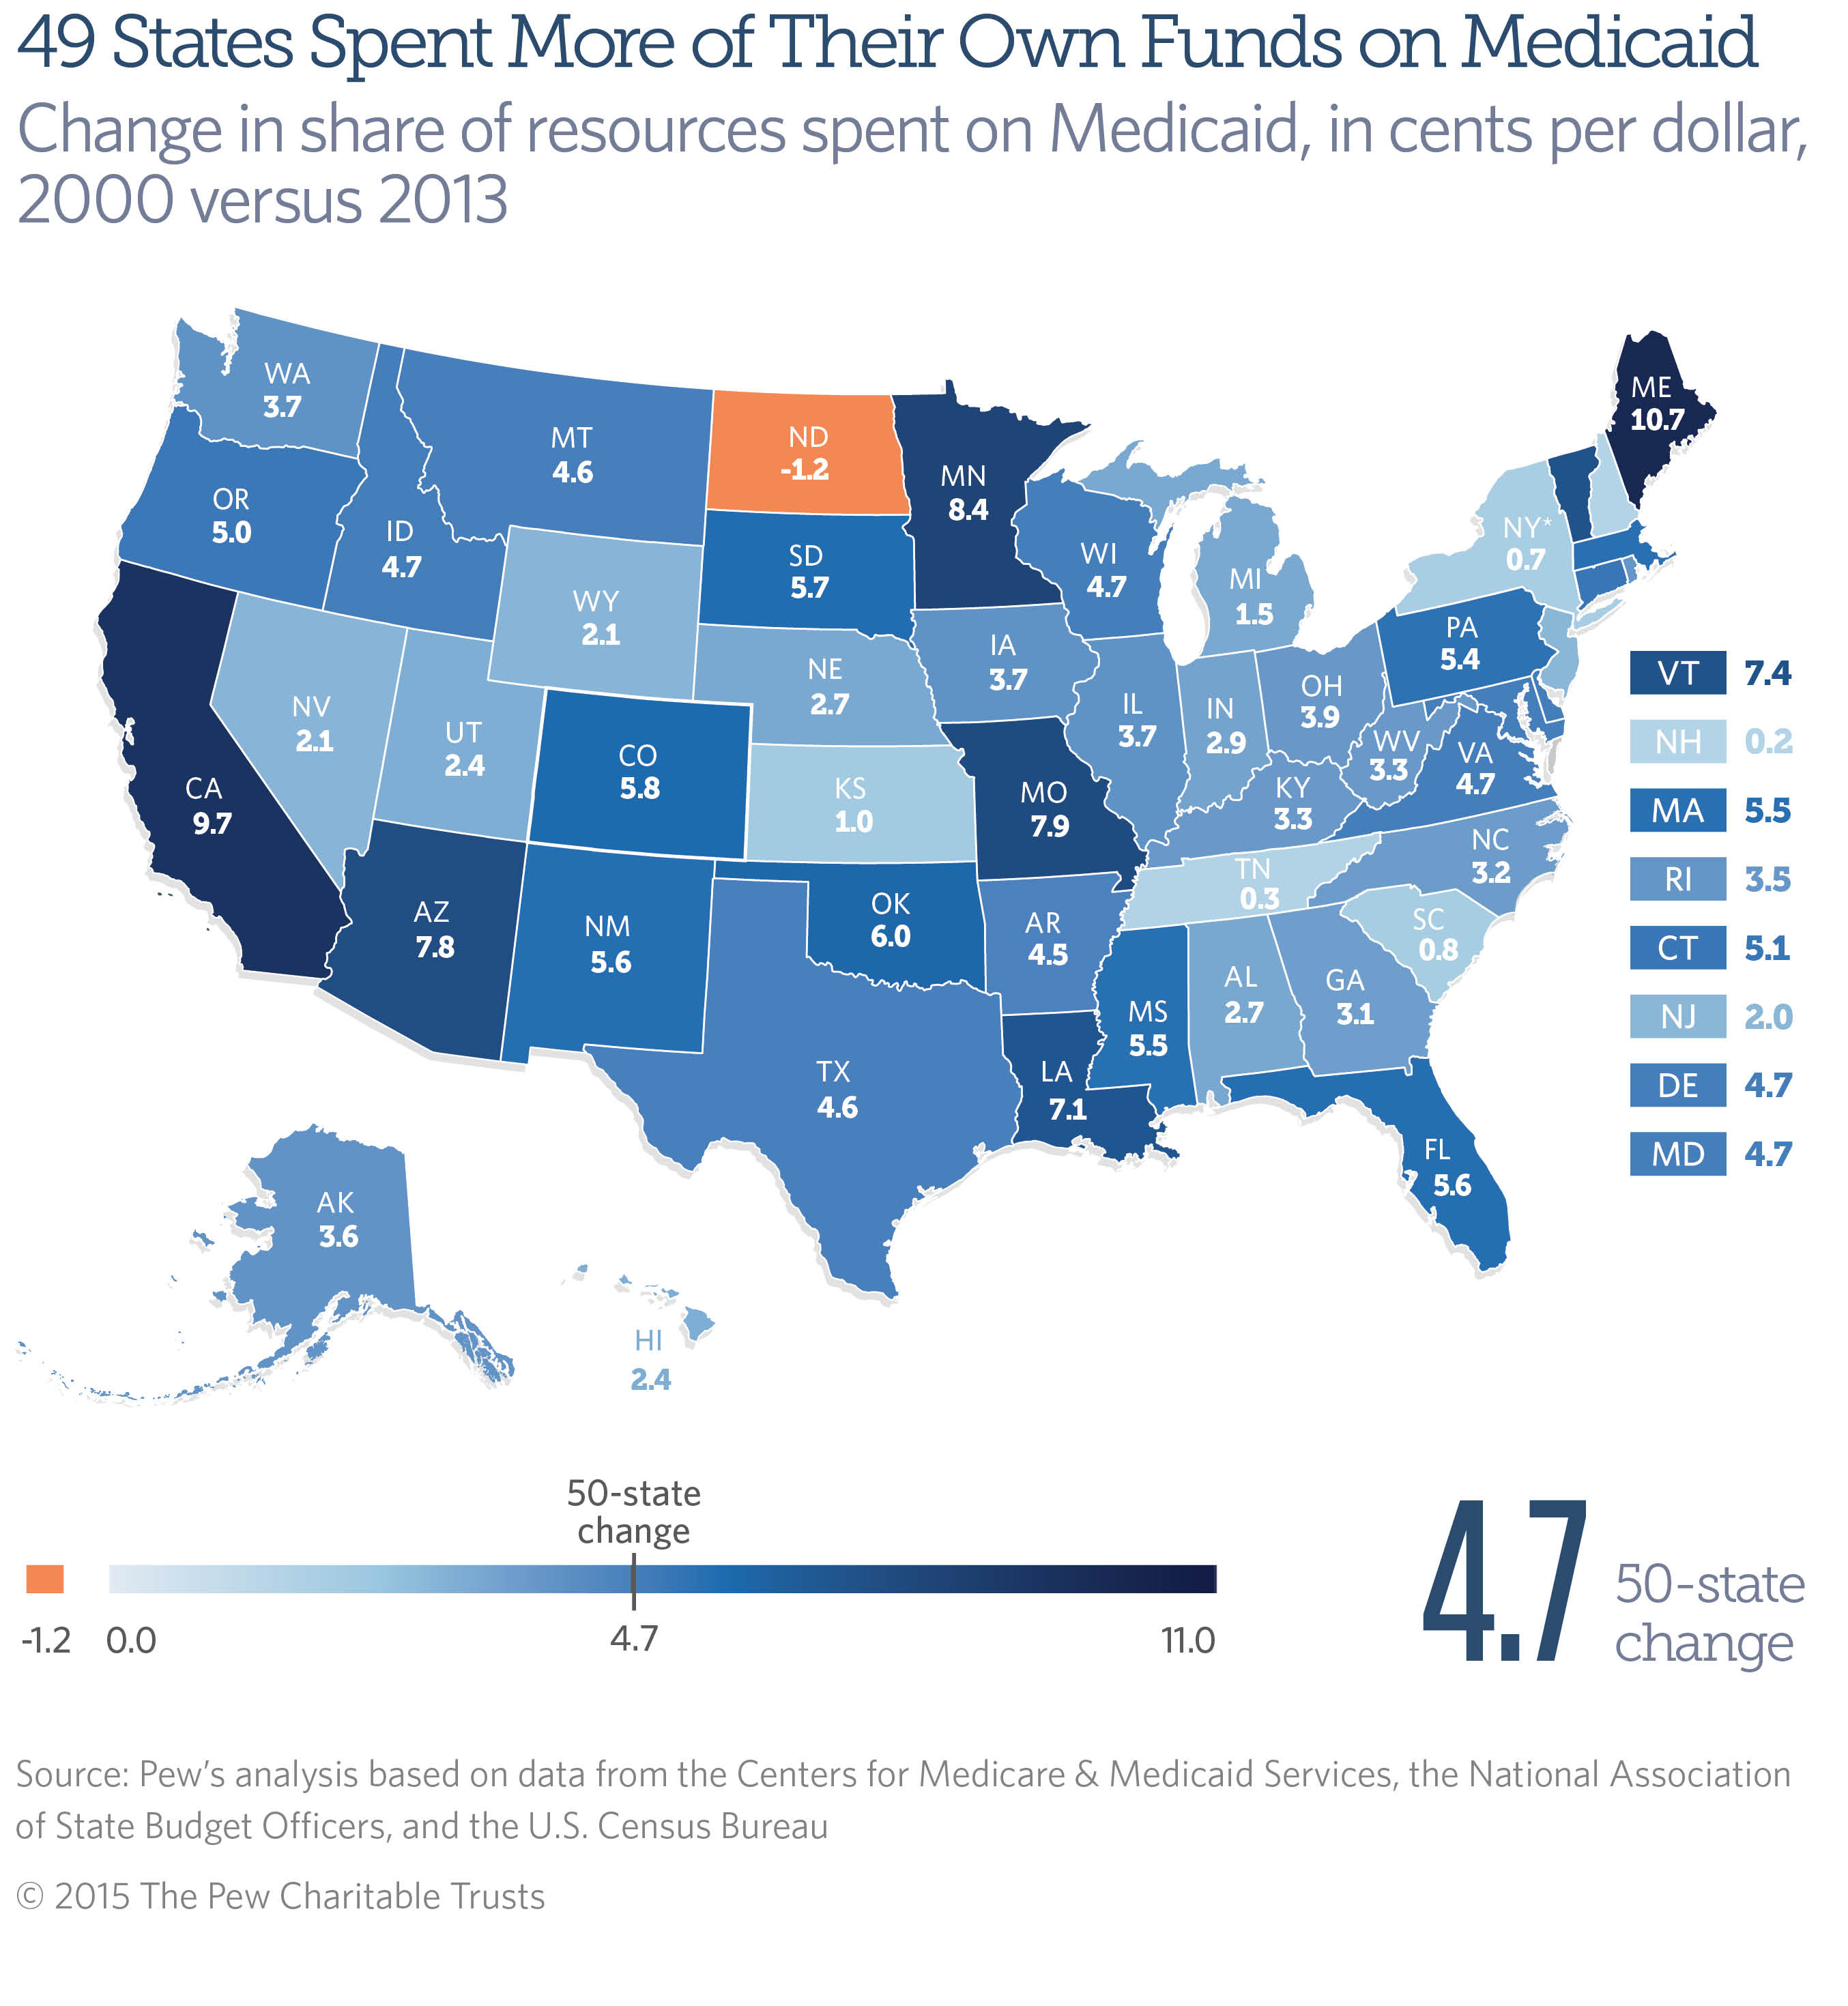
The share of states’ own money spent on Medicaid coverage for low-income Americans in fiscal year 2013 was higher in all but one state—North Dakota—compared with fiscal 2000. In the 49 states, Medicaid spending grew by a bigger percentage than did own-source revenue.
After the Great Recession, the costs borne by states for the joint federal-state health care program for low-income children, parents, people with disabilities, and the elderly increased nationally with the end of temporarily enhanced federal Medicaid funding. Overall and in 15 states, 2013 state Medicaid spending was at its highest level since at least 2000 as a share of own-source revenue.
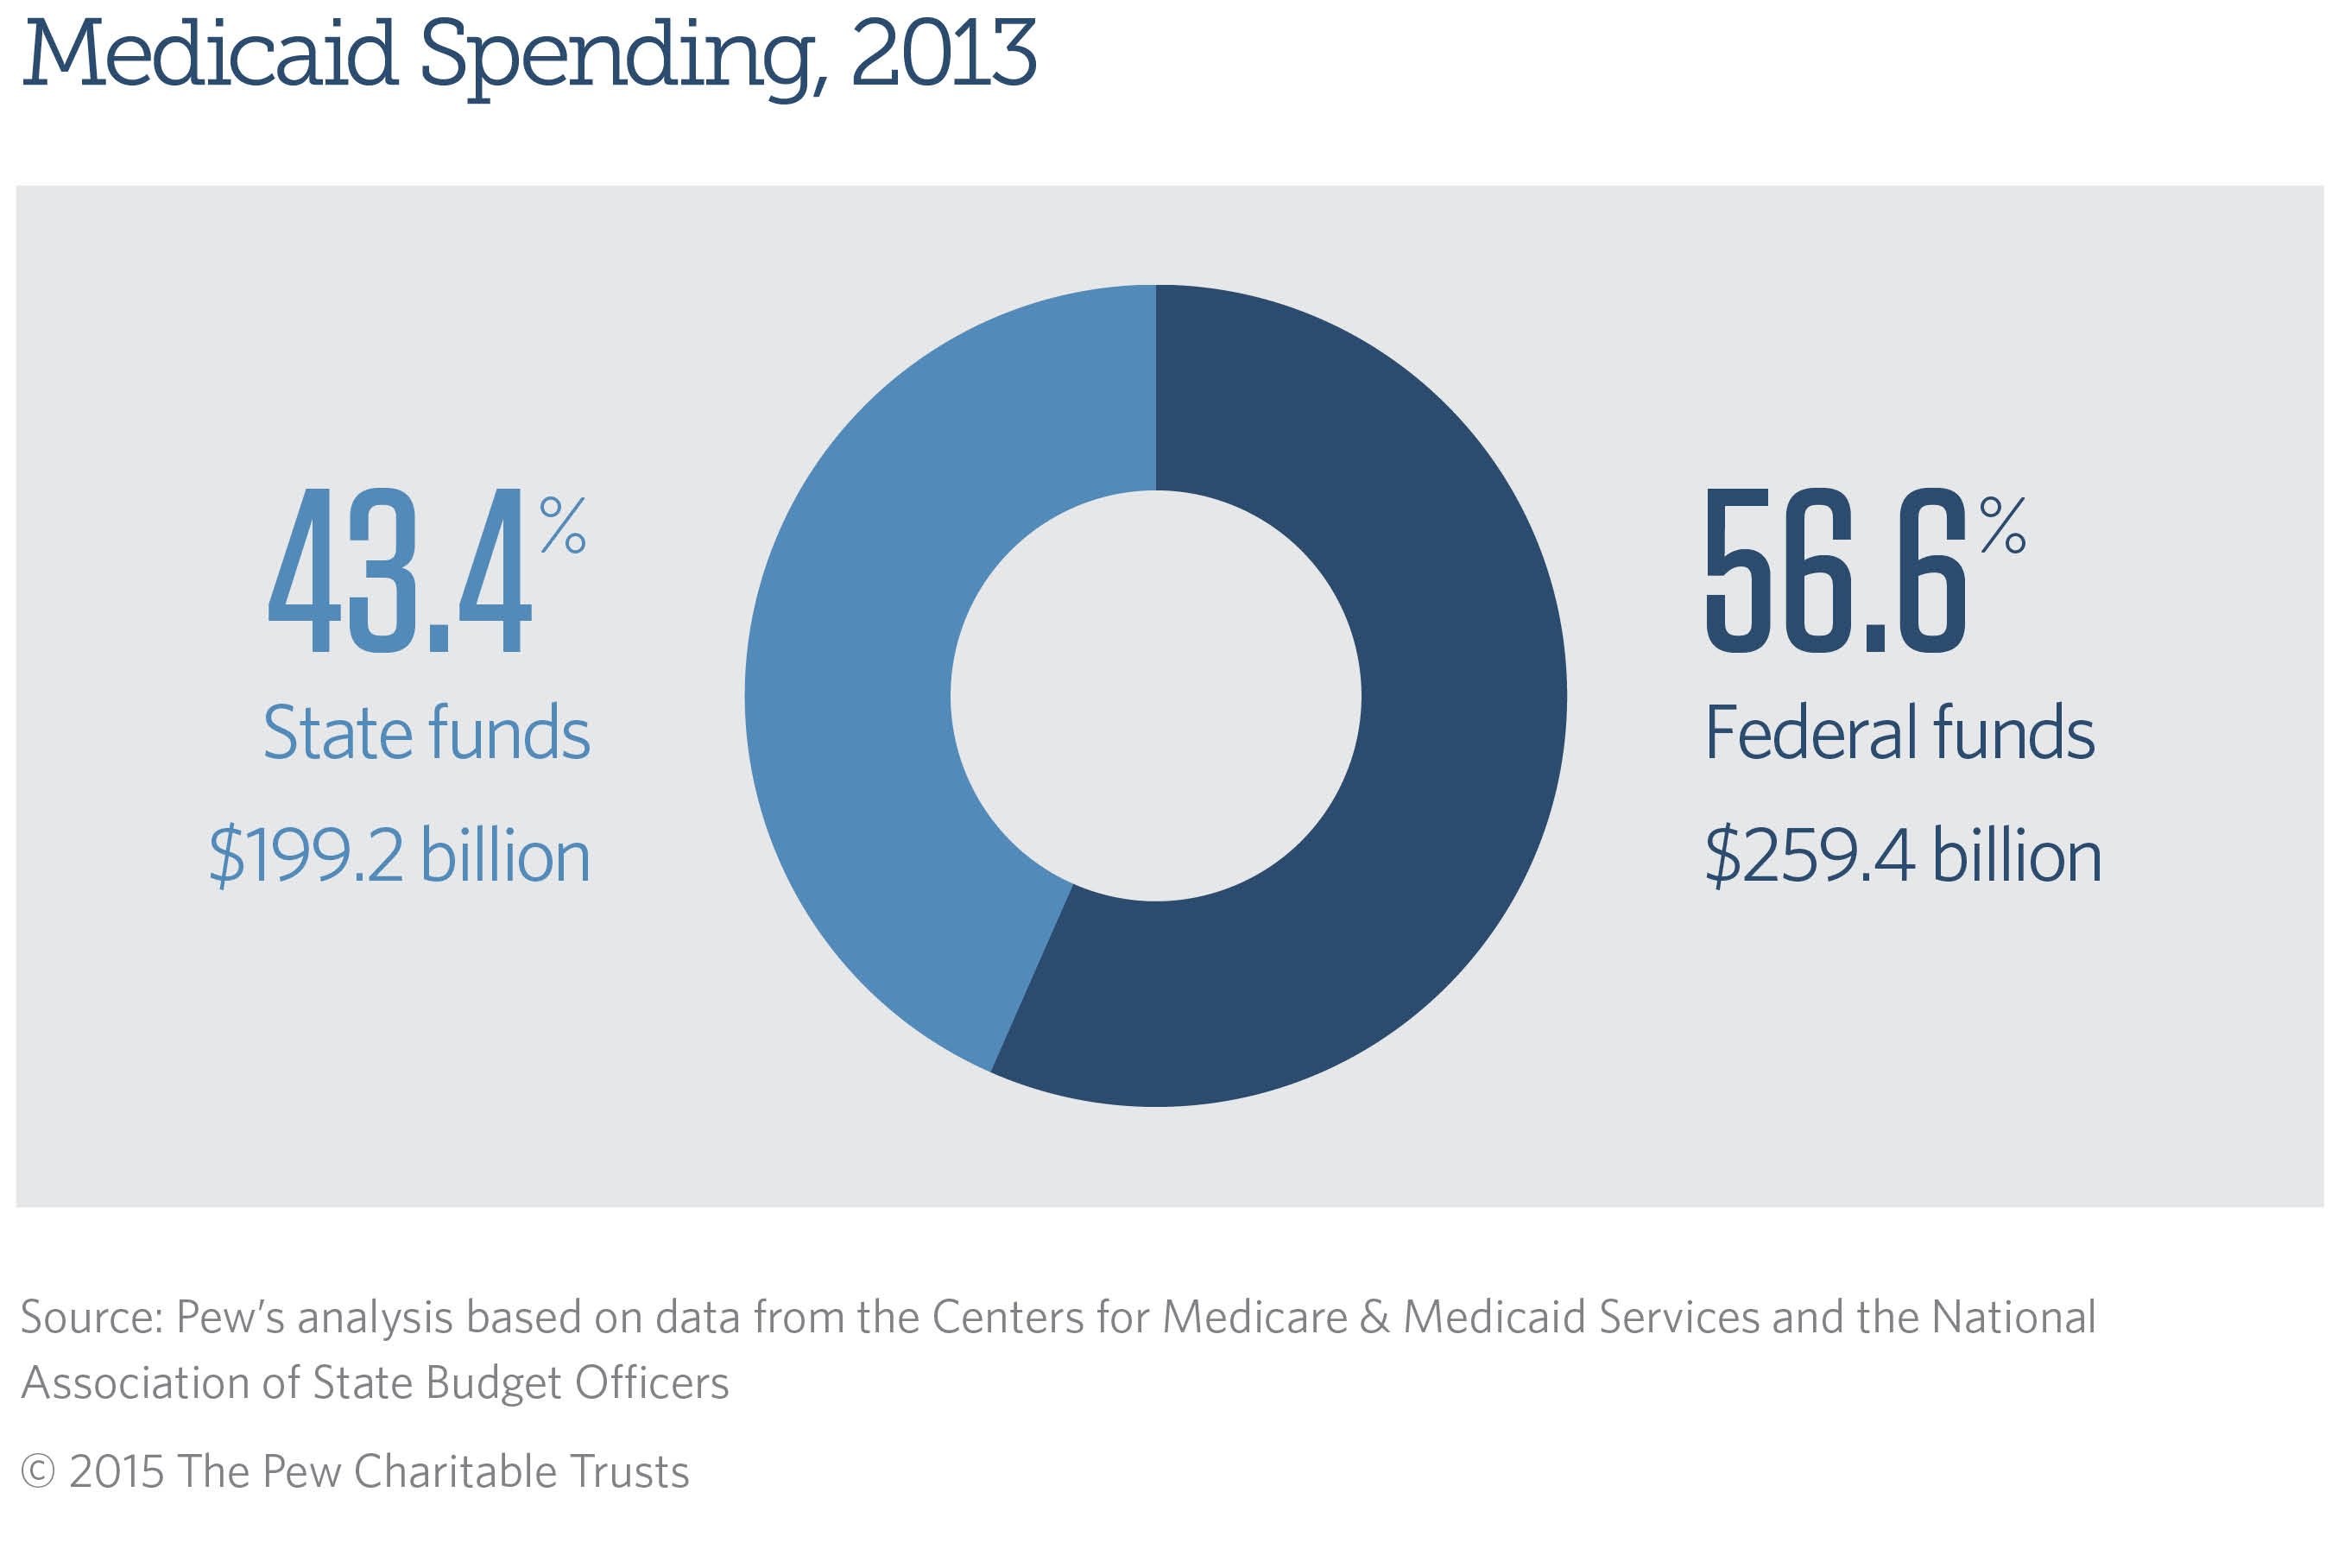
In the aggregate, states spent $199.2 billion of their own resources in 2013 on Medicaid health services, making it their biggest expense after K-12 education. Medicaid spending accounted for 16.9 percent of all state-generated funds, or nearly 17 cents of each dollar—4.7 cents more than in 2000.
One of the major drivers of the increased spending was growth in Medicaid enrollment, which rose by 70 percent from 2000 to 2013. Because Medicaid is an entitlement program, states must provide certain federally required benefits for any eligible enrollee. Higher enrollment was due to a number of factors, including two economic downturns, which caused people to lose jobs and associated health insurance coverage; an erosion of employer-sponsored insurance; and decisions by several states to broaden eligibility even before the federal Affordable Care Act’s 2014 Medicaid expansion.
Although Medicaid costs in dollar terms increased in all states between 2000 and 2013, the effect on states’ finances varied widely after factoring in how much money a state took in each year. Compared with 2000, Medicaid in 2013 consumed about 1 cent less of each dollar raised by North Dakota but at least 8 cents more of every dollar generated by California, Maine, and Minnesota.
An increase in Medicaid’s claim on each revenue dollar reduces the share of state resources available for other priorities, such as education, transportation, and public safety. Because Medicaid has certain mandatory spending, policymakers have less control over growth in their states’ costs than they do with many other programs. The State Medicaid Spending indicator excludes federal support and examines only the cost to states because that spending has a direct impact on state budgets, which rely on state-generated revenue.
A comparison of states’ Medicaid spending relative to their own resources in 2000 and 2013 shows:
- Only in North Dakota did Medicaid spending fall as a share of own-source revenue. Medicaid accounted for 7.3 percent of state dollars in 2000 and 6.1 percent in 2013, a drop of 1.2 percentage points—a little more than a penny per dollar. The share declined because the state’s oil boom pushed up revenue 175 percent over the period, outpacing the 131 percent increase in Medicaid costs, in inflation-adjusted dollars.
- Maine’s share increased the most. In 2013, the state spent 10.7 cents more of each state-generated dollar on Medicaid than in 2000. The next-largest increases per revenue dollar were California (9.7 cents) and Minnesota (8.4 cents). Six states had Medicaid growth of less than 2 cents per own-source dollar: New Hampshire (0.2), Tennessee (0.3), New York* (0.7), South Carolina (0.8), Kansas (1.0), and Michigan (1.5).
- Medicaid spending was at its highest level as a share of own-source revenue in 2013 in 15 states: California, Colorado, Idaho, Indiana, Kentucky, Louisiana, Maine, Mississippi, Missouri, Oregon, Rhode Island, South Dakota, Utah, Vermont, and West Virginia.
- Seven states spent more than one-fifth of their own-source revenue on Medicaid in 2013: New York* (27.2 percent), Missouri (22.3 percent), Maine (22.1 percent), Rhode Island (21.9 percent), Pennsylvania (21.3 percent), Massachusetts (20.5 percent), and California (20.3 percent).
- The states that spent the lowest share of own-source dollars on Medicaid—at 10 percent or less—in 2013 were North Dakota (6.1 percent), Alaska (6.5 percent), Utah (6.8 percent), Wyoming (7.6 percent), Nevada (9.1 percent), Hawaii (9.7 percent), and South Carolina (9.9 percent).
Medicaid is a state-administered program, but the federal government covers 50 to about 75 percent of each state’s Medicaid bills, for a total of 56.6 percent of costs nationwide in 2013.
In 2006, the federal government began relieving states of prescription drug costs for “dual eligibles,” individuals who qualify for both Medicaid and the federal Medicare program. In return, states are required to share some of their savings with the federal government through annual “clawback” payments, which are included in this analysis as part of state Medicaid spending.
In response to the 2001 and 2007-to-2009 recessions, as state tax revenue fell, the federal government sent extra dollars to states to help cover the increased costs associated with higher Medicaid enrollment. Enhanced federal aid from the Great Recession tapered off between December 2010 and June 2011.
The latest 50-state data are for 2013 and do not reflect the impact of the Affordable Care Act’s Medicaid expansion, which took effect in January 2014. The law expanded Medicaid eligibility to low-income adults, a change that the Supreme Court later ruled was optional for states. Potential costs and savings to states are still being assessed. For fiscal 2014, according to a Kaiser Family Foundation issue brief, state Medicaid spending was growing more slowly than total Medicaid spending as the federal government picked up 100 percent of costs for the expansion.
The level of federal assistance is one of several factors that influence the wide range in the share of state own-source revenue spent on Medicaid, according to a report by the State Health Care Spending Project, a collaboration between The Pew Charitable Trusts and the John D. and Catherine T. MacArthur Foundation. This variation is attributable not only to state Medicaid policy decisions—the breadth of health care services covered, eligible populations, and provider payment rates—but also to tax and other policy decisions that determine state revenue. Variation also is driven by factors outside of policymakers’ control, such as state economic performance, demographics, resident health status, and regional differences in health care costs and practices.
Download the data to see individual state’s Medicaid spending as a share of own-source revenue for each fiscal year from 2000 to 2013. Visit The Pew Charitable Trusts’ interactive resource Fiscal 50: State Trends and Analysis to sort and analyze data for other indicators of state fiscal health.
* The latest data for New York are from fiscal 2012 because of a discrepancy between state and U.S. Census Bureau revenue figures for 2013. For fiscal 2013, the 50-state share is calculated using New York’s fiscal 2012 values.


America’s Overdose Crisis
Sign up for our five-email course explaining the overdose crisis in America, the state of treatment access, and ways to improve care
Sign up

Fiscal 50: State Trends and Analysis
Sort and chart data about key fiscal and economic trends in the 50 states, and read Pew's insights.
ADDITIONAL RESOURCES

Fact Sheet

Podcast


