Employment Rates Remain Below Prerecession Levels in Most States
These data have been updated. To see the most
recent data and analysis, visit Fiscal 50.
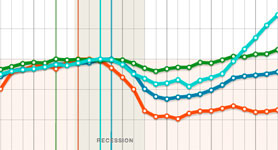
Employment rates for 25- to 54-year-olds were lower in 29 states in fiscal year 2014 than in 2007, before the Great Recession. This decline means less revenue for state governments from personal and business income taxes and sales tax—and often increased strain on assistance programs.
In 2007, leading up to the Great Recession, 79.9 percent of people ages 25 to 54 in the United States had a job. In the 12 months ending June 2014, five years after the recession ended, only 76.2 percent of people in that age group were working. Download the data.
The latest rates show a slight improvement from fiscal 2013, when 75.9 percent of people in their prime working years had a job nationally. At that time, employment rates were below prerecession levels in 35 states.
Still, at 3.7 percentage points lower than before the recession, the employment to population ratio for prime-age workers shows that the U.S. labor market remains weak. This finding has significant budgetary consequences for states:
- Without paychecks, people pay less income tax and tend to buy less, reducing sales and business income tax revenue.
- Unemployed people frequently need more services, such as Medicaid and other safety-net programs, increasing costs at a time when state governments may have less tax revenue.
A state-by-state comparison of calendar year 2007 with fiscal 2014 shows:
- No state reported employment rate gains for 25- to 54-year-olds.
- 29 states had statistically significant decreases.
- The largest decline in the employment rate was in New Mexico, where 69.9 percent of prime-age workers had jobs in fiscal 2014—9.2 percentage points lower than in 2007.
- Among the least affected were Vermont and Nebraska, which recorded the smallest observed changes in their current employment rates of 83.3 and 85.2 percent, respectively.
Although unemployment figures receive more media attention, the employment rate is a preferred index for many economists because it provides a sharper picture of changes in the labor market. The unemployment rate, for example, fails to count workers who stopped looking for a job. By focusing on 25- to 54-year-olds, trends are less distorted by demographic effects such as older and younger workers’ choices regarding retirement or full-time education.
Where Employment Rates Lag the Most |
|||
| For every 100 prime-age workers, how many fewer had a job in 2013 than in 2007? | |||
| New Mexico | -8.9 | ||
| Nevada | -8.0 | ||
| Arizona | -6.3 | ||
| Florida | -6.2 | ||
| Montana | -6.0 | ||
| Source: Pew analysis of data from the Current Population Survey, published by the U.S. Bureau of Labor Statistics and the U.S. Census Bureau | |||
A statistically significant decrease indicates a high level of confidence that there was a true change in the employment rate. Changes that are not statistically significant offer less certainty and could be the result of variations in sampling and other methods used to produce employment estimates. Without additional testing for statistical significance, caution should be exercised when comparing change in one state’s employment rate to change in another state’s rate.
Analysis by Jeff Chapman and Julie Srey
ADDITIONAL RESOURCES

Fact Sheet

Podcast


