How States Allocate Their Prison Health Care Dollars
Detailed spending data helps track trends and evaluate cost-effectiveness

This is the fifth analysis in a series examining how health care is funded and delivered in state-run prisons, as well as how care continuity is facilitated upon release.
Prison health care spending varies dramatically among states even though they have common goals, such as meeting constitutional obligations to provide “reasonably adequate” health care, strengthening public health, protecting public safety, and practicing fiscal prudence. This variation in spending among states raises questions about what causes the variation and what it signifies.
A first-of-its-kind report by The Pew Charitable Trusts explores several factors behind interstate spending variation, including how spending is distributed. The report provides key information that officials need to determine outcomes achieved and to map out avenues for any necessary changes.
States must examine spending distributions to understand interstate variation and evaluate cost-effectiveness, and officials can benefit from practical, detailed trend figures. The collection and analysis of such material support vital management activities, such as identifying and tracking cost drivers and evaluating the results of cost-containment strategies and other policy decisions.
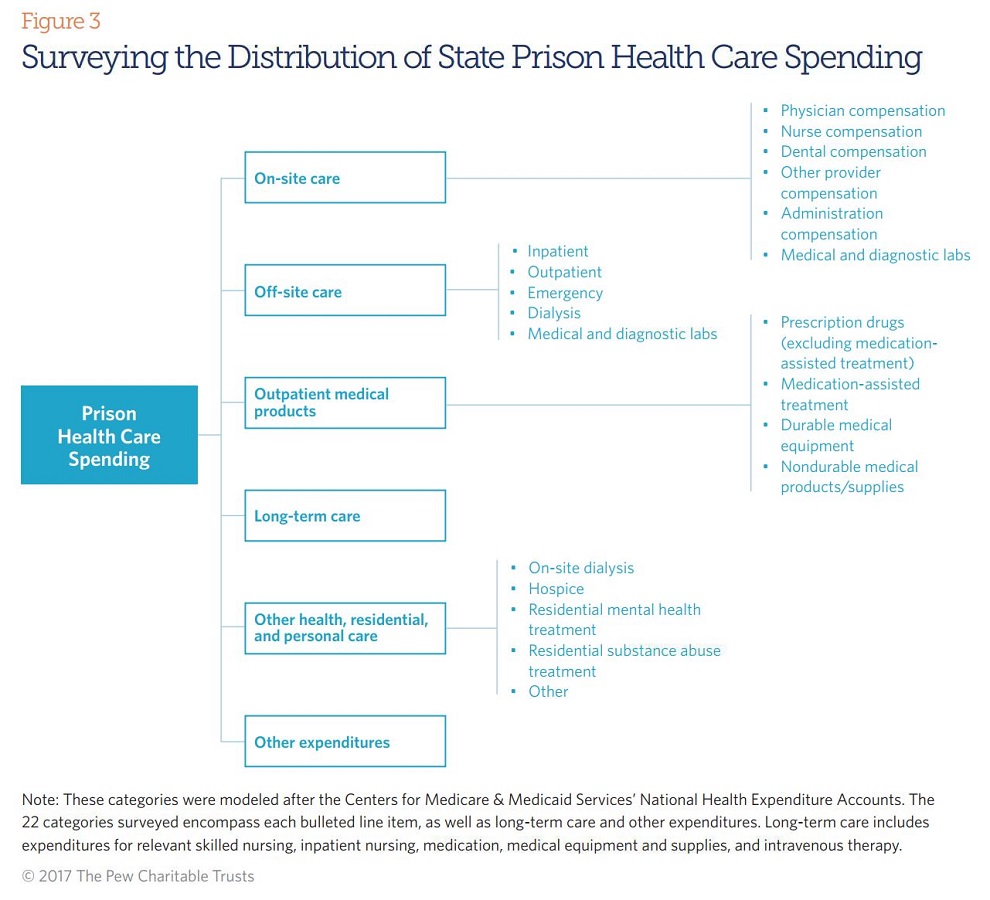
Researchers asked states to categorize their total spending in 22 line items, modeled after those used by the Centers for Medicare & Medicaid Services to track national health care expenditures. (See Figure below.) Many reported having a limited ability to dig deep into their spending data, and no state submitted data for all 22 categories requested. Thirty-three said they were unable to provide data across the categories, with a majority saying that their systems do not allow them to parse spending in this fashion or that they lack access to detailed spending records from contractors.
Seven states (Kansas, Kentucky, Maine, Missouri, New York, Ohio, and South Dakota) did use the provided categories to report at least partial data, with just four (Maine, New York, Ohio, and South Dakota) providing breakouts that summed to their total expenditures.
The categories in which the seven states were most likely to report data were spending on prescription drugs, durable medical equipment (such as hearing aids or wheelchairs), nondurable products and supplies (such as instruments or needles), residential mental health treatment, and compensation for on-site providers.
With so few states reporting complete disaggregated expenditures using the categories provided, it is not possible to thoroughly analyze and compare states’ spending distributions and trends. However, some insights do emerge from the four standout states. For example, compensation for nurses and spending on prescription drugs were among the three largest categories for each of the four states. Also, prescription drugs were among the categories that recently grew the fastest.
State approaches
States were also invited to break out spending based on their own approaches, and 27 provided such information. Like the four states that reported the most complete data using the scheme provided, the group of 27 was made up largely of states that provide health care services directly, rather than contracting out. A majority of contracted-provision states reported no detailed data at all. (For data on states’ delivery systems, see Table 1 of “Prison Health Care Costs and Quality.”) Policymakers and correctional administrators in every state, regardless of delivery system model, grapple with similar managerial considerations and therefore would benefit from some level of detailed spending data.
The categories that states track offer mixed analytic opportunities. Of the 27 states that submitted their own spending breakouts, figures in seven of them did not add up to total expenditures. Additionally, several states reported a set of classifications that may hinder a deep examination of spending drivers. In some cases, this was because the categories were not germane. Others included catch-all classifications that contain large proportions of spending.
Given their potential magnitude and volatility, expenditures for prescription drugs and off-site care can be two particularly useful areas for departments to track. Of the 27 states, 10 track both, with an additional seven monitoring pharmaceuticals but not hospitalizations and other off-site care.
Using detailed spending data
New York and Maine each reported using expenditure analyses to inform decision-making. New York recently replaced its statewide financial system. Building on the old technology’s capabilities, the upgrade allows for tracking specific expenditure categories and analyzing trends and variations in high-cost areas. Corrections officials have been monitoring increases in spending for hepatitis C treatment, informing a targeted increase in the department’s health budget.
Maine also revamped its system, empowering officials to run more finely grained analyses. Financial data are now gathered and can be parsed and sifted according to queries by analysts and administrators. Officials report that the system and the information it produces allow for data-driven budgeting by helping them to establish historical cost trends, recognize emerging changes, and determine whether deviations are likely to require temporary or permanent adjustments.
Matt McKillop is an officer with the states’ fiscal health project of The Pew Charitable Trusts.


ADDITIONAL RESOURCES

Fact Sheet

Article